NIST SPECIAL PUBLICATION 1800-10C
Protecting Information and System Integrity in Industrial Control System Environments:
Cybersecurity for the Manufacturing Sector
Volume C:
How-to Guides
Michael Powell
National Cybersecurity Center of Excellence
National Institute of Standards and Technology
Michael Pease
Keith Stouffer
CheeYee Tang
Timothy Zimmerman
Engineering Laboratory
National Institute of Standards and Technology
Joseph Brule
Chelsea Deane
John Hoyt
Mary Raguso
Aslam Sherule
Kangmin Zheng
The MITRE Corporation
McLean, Virginia
Matthew Zopf
Strativia
Largo, Maryland
March 2022
FINAL
This publication is available free of charge from https://doi.org/10.6028/NIST.SP.1800-10
The first draft of this publication is available free of charge from https://www.nccoe.nist.gov/publications/practice-guide/protecting-information-and-system-integrity-industrial-control-system-draft

DISCLAIMER
Certain commercial entities, equipment, products, or materials may be identified in this document in order to describe an experimental procedure or concept adequately. Such identification is not intended to imply special status or relationship with NIST or recommendation or endorsement by NIST or NCCoE; neither is it intended to imply that entities, equipment, products, or materials are necessarily the best available for the purpose.
While NIST and the NCCoE address goals of improving management of cybersecurity and privacy risk through outreach and application of standards and best practices, it is the stakeholder’s responsibility to fully perform a risk assessment to include the current threat, vulnerabilities, likelihood of a compromise, and the impact should the threat be realized before adopting cybersecurity measures such as this recommendation.
Domain name and IP addresses shown in this guide represent an example domain and network environment to demonstrate the NCCoE project use case scenarios and the security capabilities.
National Institute of Standards and Technology Special Publication 1800-10C, Natl. Inst. Stand. Technol. Spec. Publ. 1800-10C, 128 pages, March 2022, CODEN: NSPUE2.
FEEDBACK
As a private-public partnership, we are always seeking feedback on our practice guides. We are particularly interested in seeing how businesses apply NCCoE reference designs in the real world. If you have implemented the reference design, or have questions about applying it in your environment, please email us at manufacturing_nccoe@nist.gov.
All comments are subject to release under the Freedom of Information Act (FOIA).
NATIONAL CYBERSECURITY CENTER OF EXCELLENCE
The National Cybersecurity Center of Excellence (NCCoE), a part of the National Institute of Standards and Technology (NIST), is a collaborative hub where industry organizations, government agencies, and academic institutions work together to address businesses’ most pressing cybersecurity issues. This public-private partnership enables the creation of practical cybersecurity solutions for specific industries, as well as for broad, cross-sector technology challenges. Through consortia under Cooperative Research and Development Agreements (CRADAs), including technology partners—from Fortune 50 market leaders to smaller companies specializing in information technology security—the NCCoE applies standards and best practices to develop modular, easily adaptable example cybersecurity solutions using commercially available technology. The NCCoE documents these example solutions in the NIST Special Publication 1800 series, which maps capabilities to the NIST Cybersecurity Framework and details the steps needed for another entity to re-create the example solution. The NCCoE was established in 2012 by NIST in partnership with the State of Maryland and Montgomery County, Maryland.
To learn more about the NCCoE, visit https://www.nccoe.nist.gov/. To learn more about NIST, visit https://www.nist.gov
NIST CYBERSECURITY PRACTICE GUIDES
NIST Cybersecurity Practice Guides (Special Publication 1800 series) target specific cybersecurity challenges in the public and private sectors. They are practical, user-friendly guides that facilitate the adoption of standards-based approaches to cybersecurity. They show members of the information security community how to implement example solutions that help them align more easily with relevant standards and best practices, and provide users with the materials lists, configuration files, and other information they need to implement a similar approach.
The documents in this series describe example implementations of cybersecurity practices that businesses and other organizations may voluntarily adopt. These documents do not describe regulations or mandatory practices, nor do they carry statutory authority.
ABSTRACT
Today’s manufacturing organizations rely on industrial control systems (ICS) to conduct their operations. Increasingly, ICS are facing more frequent, sophisticated cyber attacks—making manufacturing the second-most targeted industry (C. Singleton et al., X-Force Threat Intelligence Index 2021, IBM, February 2021, https://www.ibm.com/security/data-breach/threat-intelligence). Cyber attacks against ICS threaten operations and worker safety, resulting in financial loss and harm to the organization’s reputation.
The architecture and solutions presented in this guide are built upon standards-based, commercially available products, and represent some of the possible solutions. The solutions implement standard cybersecurity capabilities, such as behavioral anomaly detection, application allowlisting, file integrity-checking, change control management, and user authentication and authorization. The solution was tested in two distinct lab settings: a discrete manufacturing work cell, which represents an assembly line production, and a continuous process control system (PCS), which represents chemical manufacturing industries.
Organizations that are interested in protecting the integrity of the manufacturing system and information from destructive malware, insider threats, and unauthorized software should first conduct a risk assessment and determine the appropriate security capabilities required to mitigate those risks. Once the security capabilities are identified, the sample architecture and solution presented in this document may be used.
The security capabilities of the example solution are mapped to NIST’s Cybersecurity Framework, the National Initiative for Cybersecurity Education Framework, and NIST Special Publication 800-53.
KEYWORDS
Application allowlisting; behavioral anomaly detection; file integrity checking; firmware modification; industrial control systems; manufacturing; remote access; software modification; user authentication; user authorization.
ACKNOWLEDGEMENTS
We are grateful to the following individuals for their generous contributions of expertise and time.
Name |
Organization |
|---|---|
Dan Frechette |
Microsoft |
Ian Schmertzler |
Dispel |
Ben Burke |
Dispel |
Chris Jensen |
Tenable |
Bethany Brower |
VMWare |
Dennis Hui |
OSIsoft (now part of AVEVA) |
John Matranga |
OSIsoft (now part of AVEVA) |
Michael A. Piccalo |
Forescout |
Tim Jones |
Forescout |
Yejin Jang |
Forescout |
Samantha Pelletier |
TDI Technologies |
Rusty Hale |
TDI Technologies |
Steve Petruzzo |
GreenTec-USA |
Josh Carlson |
Dragos |
Alex Baretta |
Dragos |
The Technology Partners/Collaborators who participated in this build submitted their capabilities in response to a notice in the Federal Register. Respondents with relevant capabilities or product components were invited to sign a Cooperative Research and Development Agreement (CRADA) with NIST, allowing them to participate in a consortium to build this example solution. We worked with:
Technology Partner/Collaborator |
Product |
|---|---|
Carbon Black App Control |
|
Azure Defender for the internet of things (IoT) (incorporating technology from the acquisition of CyberX) |
|
Dispel Wicket ESI Dispel Enclave Dispel VDI (Virtual Desktop Interface) |
|
Dragos Platform |
|
eyeInspect (Formerly SilentDefense)
ICS Patrol
EyeSight |
|
WORMdisk and ForceField |
|
PI System (which comprises products such as PI Server, PI Vision and others) |
|
ConsoleWorks |
|
Tenable.ot |
DOCUMENT CONVENTIONS
The terms “shall” and “shall not” indicate requirements to be followed strictly to conform to the publication and from which no deviation is permitted. The terms “should” and “should not” indicate that among several possibilities, one is recommended as particularly suitable without mentioning or excluding others, or that a certain course of action is preferred but not necessarily required, or that (in the negative form) a certain possibility or course of action is discouraged but not prohibited. The terms “may” and “need not” indicate a course of action permissible within the limits of the publication. The terms “can” and “cannot” indicate a possibility and capability, whether material, physical, or causal.
PATENT DISCLOSURE NOTICE
NOTICE: The Information Technology Laboratory (ITL) has requested that holders of patent claims whose use may be required for compliance with the guidance or requirements of this publication disclose such patent claims to ITL. However, holders of patents are not obligated to respond to ITL calls for patents and ITL has not undertaken a patent search in order to identify which, if any, patents may apply to this publication.
As of the date of publication and following call(s) for the identification of patent claims whose use may be required for compliance with the guidance or requirements of this publication, no such patent claims have been identified to ITL.
No representation is made or implied by ITL that licenses are not required to avoid patent infringement in the use of this publication.
List of Figures
Figure 1‑1: CSMS Network Architecture
Figure 2‑1 Dispel High-level Implementation, from Remote Access for ICS
Figure 2‑2 Mapping a Network Drive
Figure 2‑3 Authentication to File Server
Figure 2‑4 Dragos OSIsoft PI Server Integration
Figure 2‑5 Dragos PI Web API Configuration
Figure 2‑6 OSIsoft PI Server to Dragos Asset and Data Pairing
Figure 2‑7 OSIsoft PI Server and Dragos Paired Data Elements
Figure 2‑8 Dragos Zone Administration Page
Figure 2‑9 Dragos Create Zone Pop-up
Figure 2‑10 Forescout High-Level Components and Dataflows
Figure 2‑11 Forescout SecureConnector Distribution Tool
Figure 2‑12 Forescout Agent Download
Figure 2‑13 eyeInspect Sensor Admin/Overview Page – Add Sensor
Figure 2‑14 Adding a New SilentDefense Sensor Dialog
Figure 2‑15 eyeInspect ICMP Protocol/Port Scan Attempt Settings
Figure 2‑16 eyeInspect Sensor Configuration Options
Figure 2‑17 eyeInspect Portscan Detection Settings
Figure 2‑18 Add ICS Patrol Sensor Dialog
Figure 2‑19 ICS Patrol Sensor Admin Page
Figure 2‑20 Add an ICS Patrol Scan Policy
Figure 2‑21 eyeSight Add Dialog – General Information
Figure 2‑22 eyeSight Add – Command Center Credentials
Figure 2‑23 eyeSight OT Settings
Figure 2‑24 eyeSight Test Connection Successful Message
Figure 2‑25 Azure Defender for IoT SSH Session for Network Configuration
Figure 2‑26 Azure Defender for IoT Create New Data Mining Report for AMS Protocol Information
Figure 2‑27 Azure Defender for IoT Custom Alert for Firmware Major Version Number Change
Figure 2‑28 Azure Defender for IoT Custom Alert for Firmware Minor Version Number Change
Figure 2‑29 Azure Defender for IoT Custom Alert for Firmware Build Version Number Change
Figure 2‑30 Screenshot of the PI Interface Configuration Utility before the Interface is configured.
Figure 2‑39 Wazuh Agent Manager
Figure 2‑41 Wazuh Agent Manager User Interface
Figure 2‑42 Log Received After a File Change Was Detected
Figure 2‑43 ConsoleWorks Registration Screen
Figure 2‑44 ConsoleWorks Offline Registration Process
Figure 2‑45 ConsoleWorks System Backups
Figure 2‑46 ConsoleWorks Importing System Configurations and Components
Figure 2‑47 ConsoleWorks Password Settings
Figure 2‑48 ConsoleWorks Add the Local Graphical Gateway for RDP Access
Figure 2‑49 ConsoleWorks Example Device Type Definition
Figure 2‑50 ConsoleWorks List of Device Types
Figure 2‑51 ConsoleWorks Example Device Definition
Figure 2‑52 ConsoleWorks List of PCS (Build 1) Devices
Figure 2‑53 ConsoleWorks List of CRS (Build 3) Devices
Figure 2‑54 ConsoleWorks Example RDP Configuration
Figure 2‑55 ConsoleWorks List of PCS (Build 1) RDP Connections
Figure 2‑56 ConsoleWorks List of CRS (Build 3) RDP Connections
Figure 2‑57 ConsoleWorks Example Console (SSH) Connection
Figure 2‑58 ConsoleWorks Example Console (Web Forward) Connection
Figure 2‑59 ConsoleWorks List of PCS (Build 1) Console Connections
Figure 2‑60 ConsoleWorks List of CRS (Build 3) Console Connections
Figure 2‑61 ConsoleWorks List of Tags for PCS (Build 1)
Figure 2‑62 ConsoleWorks Example Tag Definition Screen
Figure 2‑63 ConsoleWorks Example Profile
Figure 2‑64 Tenable.OT Local Device Setting for NTP Service
Figure 2‑65 Tenable.OT Asset Discovery Settings
Figure 2‑66 Tenable.OT Controller Scans
Figure 2‑67 Tenable.OT Network Scan Settings
Figure 2‑68 Tenable.OT Create Asset Group Type
Figure 2‑69 Tenable.OT Create Asset Group Definition
Figure 2‑70 Tenable.OT Policy Settings
Figure 2‑71 Tenable.OT Create Policy – Event Type Options
Figure 2‑72 Tenable.OT Create Policy - Definition
Figure 2‑73 Tenable.OT Create Policy - Actions
Figure 2‑74 Excerpt from Carbon Black Documentation on Support Server Requirements
Figure 2‑75 IIS Configuration for Carbon Black, Server Roles
Figure 2‑76 Carbon Black Policy Edit
Figure 2‑77 Carbon Black App Control System Configuration
Figure 2‑78 Carbon Black App Control AD Policy Mappings
Figure 2‑79 Carbon Black Agent Download
Figure 2‑80 Carbon Black App Control Computers
Figure 2‑81 Carbon Black App Control File Catalog
Figure 2‑82 Setting Enforcement Properties
Figure 2‑83 Setting Security Level Default
Figure 2‑84 Additional Rules Defined for Lab Environment
Figure 2‑85 Menu Options for Accessing the Link an Existing GPO Option
Figure 2‑86 Dialog Box for Selecting GPO to Link
Figure B-1 Build 1 Architecture Diagram
Figure B-2 Build 2 Architecture Diagram
Figure B-3 Build 3 Architecture Diagram
Figure B-4 Build 4 Architecture Diagram
List of Tables
Table 2‑2 Firewall Rules for Dispel
Table 2‑5 Forescout Deployment
Table 2‑6 eyeSight Agent Deployment
Table 2‑7 Firewall Rules for Forescout
Table 2‑8 GreenTec-USA WORMdrive and ForceField Deployment
Table 2‑9 Microsoft Azure Defender IoT Deployment
Table 2‑10 OSIsoft PI Domain Hosts Deployment
Table 2‑11 OSIsoft PI CRS Hosts Deployment
Table 2‑12 OSIsoft PI PCS Hosts Deployment
Table 2‑13 Security Onion Domain Hosts Deployment
Table 2‑14 Security Onion PCS Hosts Deployment
Table 2‑15 Security Onion CRS Hosts Deployment
Table 2‑16 ConsoleWorks Build 1 Deployment
Table 2‑17 ConsoleWorks Build 3 Deployment
Table 2‑18 ConsoleWorks Device Type List
Table 2‑19 ConsoleWorks PCS (Build 1) Devices
Table 2‑20 ConsoleWorks CRS (Build 3) Devices
Table 2‑21 ConsoleWorks PCS (Build 1) Graphical Connections
Table 2‑22 ConsoleWorks CRS (Build 3) Graphical Connections
Table 2‑23 ConsoleWorks PCS (Build 1) Console Connections
Table 2‑24 ConsoleWorks CRS (Build 3) Console Connections
Table 2‑25 Tenable.OT Appliance Details.
Table 2‑26 Firewall Rules for Tenable.OT
Table 2‑27 Carbon Black App Control Domain Hosts Deployment
Table 2‑28 Carbon Black App Control PCS Hosts Deployment
Table 2‑29 Carbon Black App Control CRS Hosts Deployment
Table 2‑30 Windows SRP Domain Servers
Table 2‑31 Windows SRP Build 2 Deployment
Table 2‑32 Windows SRP Build 3 Deployment
1 Introduction
The following volume of this guide shows information technology (IT) professionals and security engineers how we implemented this example solution. We cover all the products employed in this reference design. We do not re-create the product manufacturers’ documentation, which is presumed to be widely available. Rather, these volumes show how we incorporated the products together in our environment.
Note: These are not comprehensive tutorials. There are many possible service and security configurations for these products that are out of scope for this reference design.
1.1 How to Use this Guide
This NIST Cybersecurity Practice Guide demonstrates a modular design and provides users with the information they need to replicate the described manufacturing industrial control system (ICS) security solutions, specifically focusing on information and system integrity. This reference design is modular and can be deployed in whole or in part.
This guide contains three volumes:
NIST SP 1800-10A: Executive Summary
NIST SP 1800-10B: Approach, Architecture, and Security Characteristics – what we built and why
NIST SP 1800-10C: How-To Guides – instructions for building the example solution (this document)
Depending on your role in your organization, you might use this guide in different ways:
Senior information technology (IT) executives, including chief information security and technology officers, will be interested in the Executive Summary, NIST SP 1800-10A, which describes the following topics:
challenges that enterprises face in ICS environments in the manufacturing sector
example solution built at the NCCoE
benefits of adopting the example solution
Technology or security program managers might share the Executive Summary, NIST SP 1800-10A, with your leadership to help them understand the importance of adopting a standards-based solution. Doing so can strengthen their information and system integrity practices by leveraging capabilities that may already exist within their operating environment or by implementing new capabilities.
Technology or security program managers who are concerned with how to identify, understand, assess, and mitigate risk will be interested in NIST SP 1800-10B, which describes what we did and why. The following sections will be of particular interest:
Section 3.4.4, Security Control Map, maps the security characteristics of this example solution to cybersecurity standards and best practices.
IT professionals who want to implement an approach like this will find this whole practice guide useful. You can use this How-To portion of the guide, NIST SP 1800-10C, to replicate all or parts of the build created in our lab. This How-To portion of the guide provides specific product installation, configuration, and integration instructions for implementing the example solution. We do not recreate the product manufacturers’ documentation, which is generally widely available. Rather, we show how we incorporated the products together in our environment to create an example solution.
This guide assumes that IT professionals have experience implementing security products within the enterprise. While we have used a suite of commercial products to address this challenge, this guide does not endorse any products. Your organization can adopt this solution or one that adheres to these guidelines in whole, or you can use this guide as a starting point for tailoring and implementing parts of this manufacturing ICS solution. Your organization’s security experts should identify the products that will best integrate with your existing tools and IT system infrastructure. We hope that you will seek products that are congruent with applicable standards and best practices. Section 3.5, Technologies, in NIST SP 1800-10B, lists the products that we used and maps them to the cybersecurity controls provided by this reference solution.
A NIST Cybersecurity Practice Guide does not describe “the” solution, but a possible solution. This is a draft guide. We seek feedback on its contents and welcome your input. Comments, suggestions, and success stories will improve subsequent versions of this guide. Please contribute your thoughts to manufacturing_nccoe@nist.gov.
1.2 Build Overview
The NCCoE partnered with NIST’s Engineering Laboratory (EL) to provide real-world scenarios that could happen in ICS in the manufacturing sector. This collaboration spawned four unique builds: two builds within the Collaborative Robotics (CRS) environment and two builds within the Process Control System (PCS) environment. For each build, the NCCoE and the EL performed eleven scenarios. The step-by-step instructions on how each product was installed and configured in this lab environment are outlined in this document. For more information on the two environments refer to Section 4.5 in NIST SP 1800-10B. Additionally, Appendix B of this Volume contains the four build architecture diagrams for reference.
1.3 Typographic Conventions
The following table presents typographic conventions used in this volume.
Typeface/ Symbol |
Meaning |
Example |
|---|---|---|
Italics |
file names and path names; references to documents that are not hyperlinks; new terms; and placeholders |
For language use and style guidance, see the NCCoE Style Guide. |
Bold |
names of menus, options, command buttons, and fields |
Choose File > Edit. |
Monospace |
command-line input, onscreen computer output, sample code examples, and status codes |
|
Monospace (block) |
multi-line input, on-screen computer output, sample code examples, status codes |
% mkdir -v nccoe_projects
mkdir: created directory 'nccoe_projects'
|
blue text |
link to other parts of the document, a web URL, or an email address |
All publications from NIST’s NCCoE are available at https://www.nccoe.nist.gov. |
1.4 Logical Architecture Summary
The security mechanisms and technologies were integrated into the existing NIST Cybersecurity for Smart Manufacturing Systems (CSMS) lab environment. This cybersecurity performance testbed for ICS is comprised of the PCS and the CRS environments along with additional networking capabilities to emulate common manufacturing environments. For more information see An Industrial Control System Cybersecurity Performance Testbed, NISTIR 8089, http://nvlpubs.nist.gov/nistpubs/ir/2015/NIST.IR.8089.pdf.
Typically, manufacturing organizations have unique cyber-ecosystems and specific needs for their operations. To demonstrate the modularity and interoperability of the provided solutions, this project used available Cooperative Research and Development Agreement (CRADA) partner technologies to assemble four “builds” deployed across both the PCS and CRS. Additionally, to increase the diversity of technologies between builds, two of the builds also utilized open source solutions (Security Onion Wazuh), native operating system features (Windows Software Restriction Policies [SRP]), and a Cisco Adaptive Security Appliance (ASA) device configured with the AnyConnect virtual private network (VPN) client.
Figure 1‑1 depicts a high-level architecture for the demonstration environment consisting of a Testbed Local Area Network (LAN), a demilitarized zone (DMZ), the PCS, and the CRS. The environment utilizes a combination of physical and virtual systems and maintains a local network time protocol (NTP) server for time synchronization. Additionally, the environment utilizes virtualized Active Directory (AD) servers for domain services. The tools used to support information and system integrity are deployed and integrated in the DMZ, Testbed LAN, PCS, and CRS per vendor recommendations and standard practices as described in the detailed sections for each build.
Figure 1‑1: CSMS Network Architecture
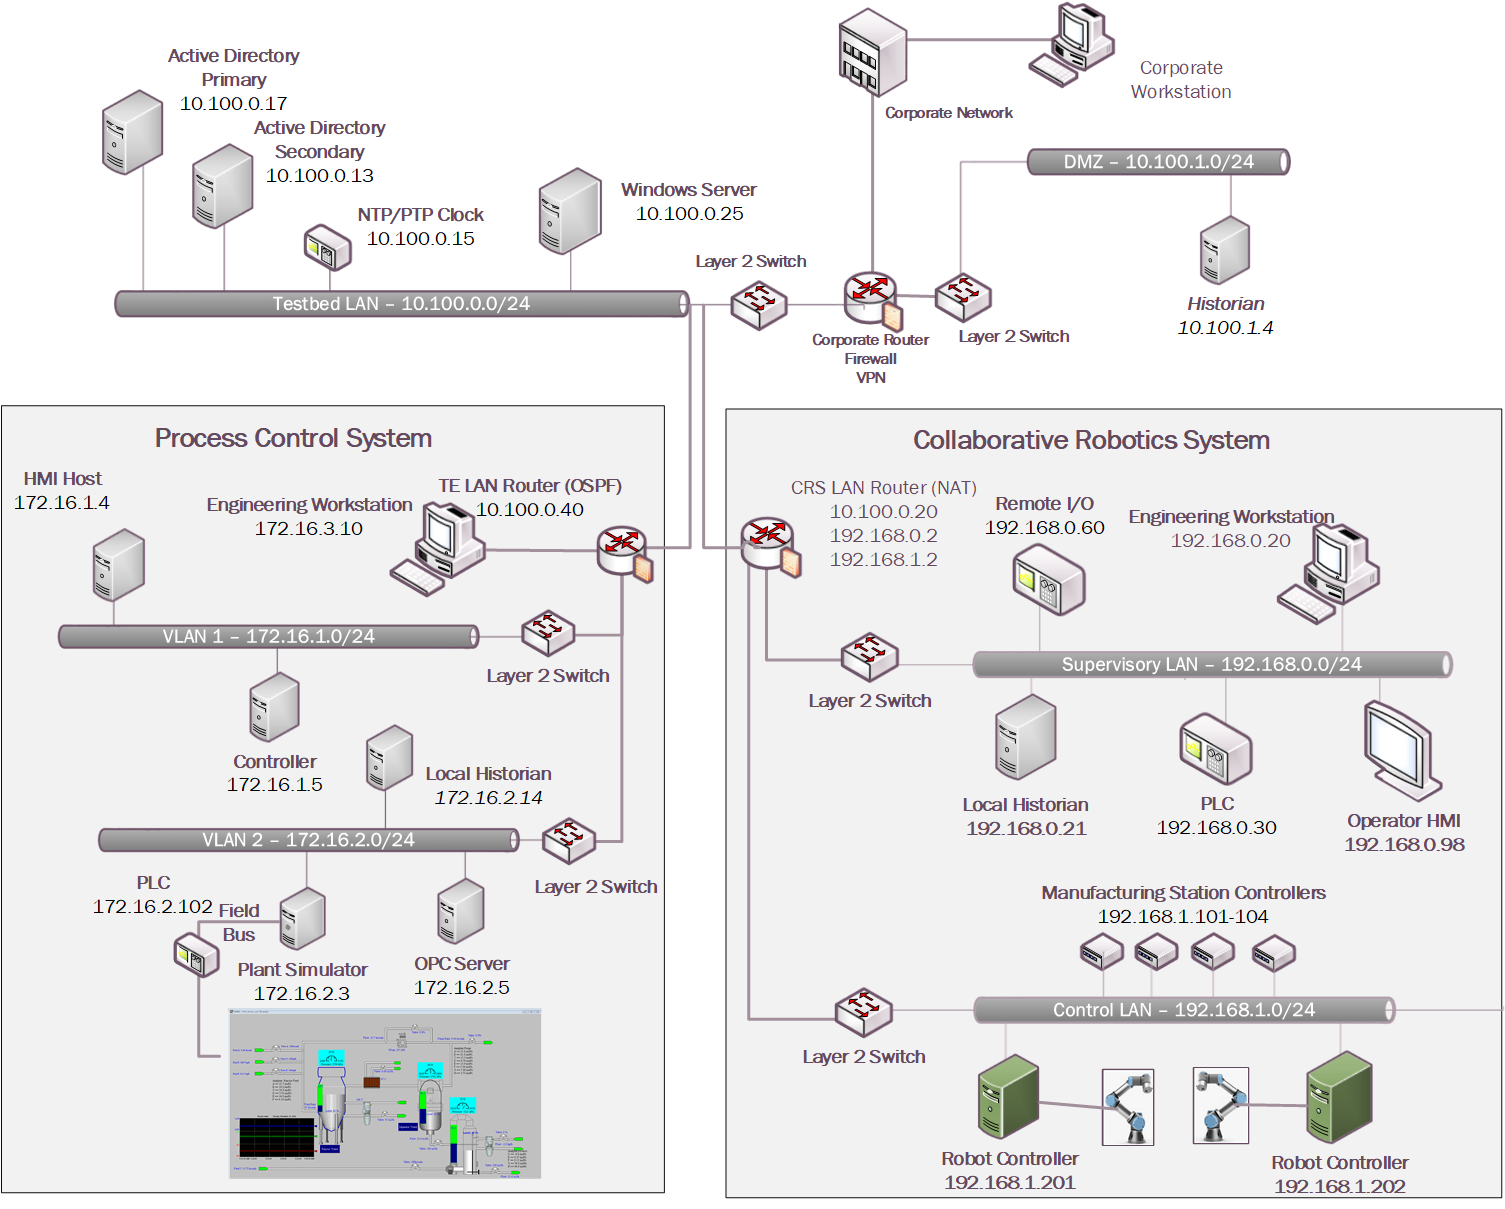
In summary, there are six networks within the CSMS architecture:
Testbed LAN: This network is where the majority of the collaborators’ products are installed. This LAN has access to the PCS and CRS environments. Other systems, such as AD, an NTP server, and a Windows server, are also located on this LAN. The Testbed LAN has three gateways to other network segments, including 10.100.0.1 to reach the DMZ and the corporate network, 10.100.0.20 as a network address translation (NAT) interface to the CRS environment, and 10.100.0.40 as the gateway to the PCS environment.
DMZ: A demilitarized zone that separates the corporate network from the operational technology (OT) network. Many of the collaborators’ products are also installed in the DMZ. The DMZ is used across the PCS and CRS environments.
PCS Virtual Local Area Network (VLAN) 1: This is the operations LAN within the PCS environment. This LAN simulates a central control room environment. The gateway interface for this network segment is 172.16.1.1
PCS VLAN 2: This is the supervisory LAN within the PCS environment. This LAN simulates the process operation/manufacturing environment, which consists of the operating plant, programmable logic controller (PLC)s, object linking and embedding for process control (OPC) server, and data historian. The gateway interface for this network segment is 172.16.2.1
CRS Supervisory LAN: This LAN is within the CRS environment. The historian, PLCs, operating human machine interface (HMI), Engineering workstation, and remote input/output devices are connected to this network. The gateway interface for this network segment is 192.168.0.2
CRS Control LAN: This LAN is within the CRS environment. The robot controllers and manufacturing station controllers are connected to this network. The gateway interface for this network segment is 192.168.1.2
The test bed networks used static IPv4 addresses exclusively, and the subnet masks were set to 255.255.255.0. No IPv6 addresses were used. This setup is consistent with industry practice. Specific Internet Protocol (IP) addresses are listed for each component in the following sections.
For an in-depth view of the architectures PCS and CRS builds, specific build architecture diagrams can be found in Volume B of this practice guide, Section 4.3, Process Control System, and Section 4.4, Collaborative Robotics System.
2 Product Installation Guides
This section of the practice guide contains detailed instructions for installing and configuring all the products used to build the example solutions.
2.1 Dispel Remote Access
Dispel is a remote access tool for OT environments that provides secure remote access to the industrial networks. Dispel, implemented in Build 2 and Build 4, uses cloud-based virtual desktop interfaces (VDIs) that traverse a cloud-based Enclave to reach a Wicket ESI device that is deployed within the local OT network. Dispel supports both user authentication and authorization, and remote access for Builds 2 and 4.
Virtual Desktop Interfaces (VDIs)
VDIs are Virtual Machines (VMs) that reside in the cloud and allow users to connect using Remote Desktop Protocol (RDP). The VDIs establish a secure connection to the Wicket ESI located in the OT network to provide network access to the OT devices.
Enclave
Enclaves are single-tenanted, colorless core, moving target defense (MTD) networks. Enclaves are composed of VMs that act as traffic nodes. To create a shifting target profile, these VMs are steadily replaced by new VMs launched on different hypervisors, in different geographic regions, and/or on altogether different public or private clouds. In the case of Builds 2 and 4, the Enclaves were launched exclusively on public clouds. To provide a static set of IP addresses throughout the builds, the MTD characteristic was disabled.
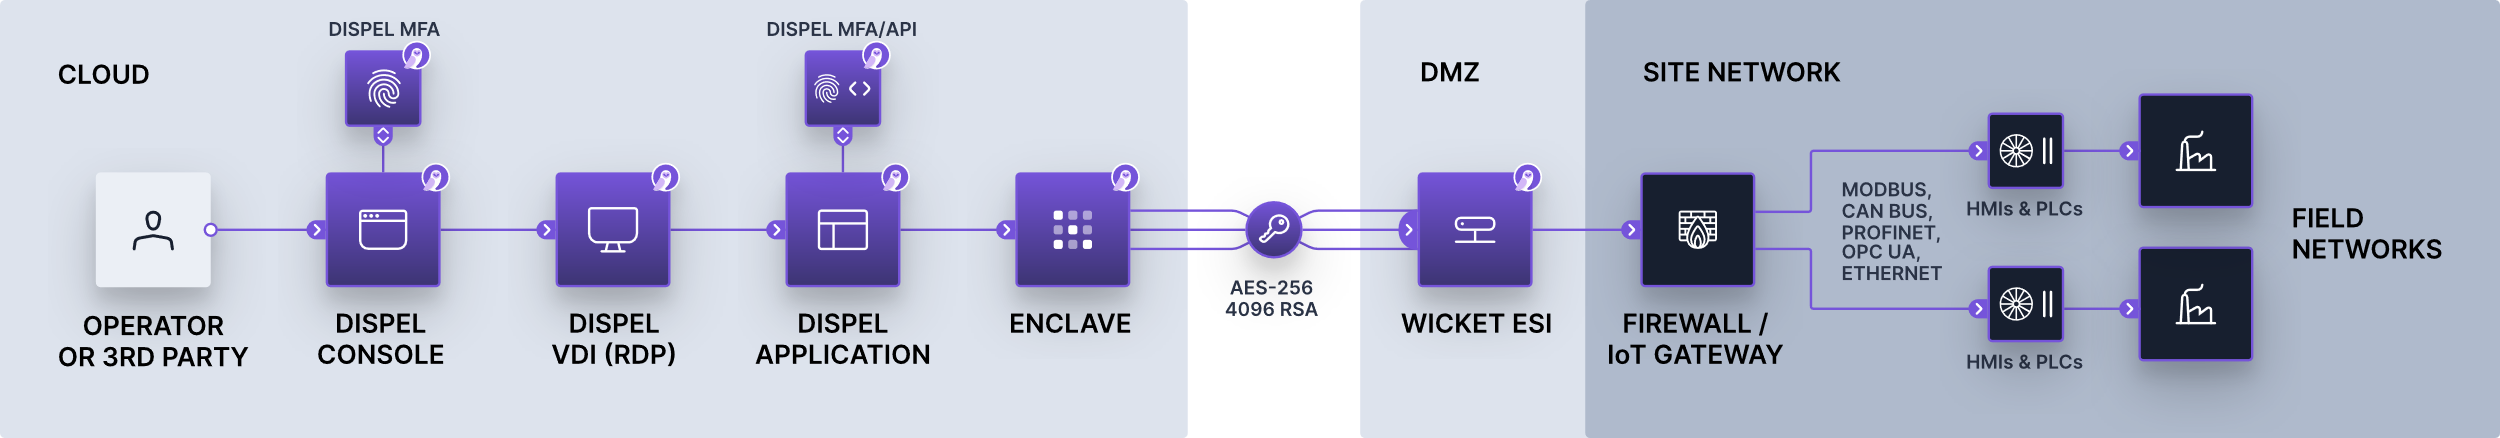
Wicket ESI
Wicket ESIs are on-premise components, shown in Figure 2‑1, that allow users to connect to the OT network remotely. These devices establish encrypted connections from the local OT network up to an Enclave which, in turn, is connected to the VDI, allowing a remote user to access the OT devices.
Additional information is available in Remote Access for Industrial Control Systems from Dispel.io at: https://s3.amazonaws.com/downloads.dispel.io/resources/One+Pager/dispel-ics-brochure_20190529.pdf
Figure 2‑1 Dispel High-level Implementation, from Remote Access for ICS
2.1.1 Host and Network Configuration
The Wicket ESI is connected to two ports within the DMZ, one for supporting outbound communications to the Dispel Enclave (labeled “WAN”) and one for supporting communication through the local firewall to the ICS environment (labeled “LAN”). The items listed in Table 2‑1 are the Wicket ESI specific device and network settings for the hardware provided to support Build 2 Figure B-2 and 4 Figure B-4.
Table 2‑1 Dispel Deployment
Name |
System |
OS |
CPU |
Memory |
Storage |
Network |
|---|---|---|---|---|---|---|
Dispel Wicket ESI |
ONLOGIC, ML340G-51 |
Ubuntu 16.04 |
Intel i5-6300U |
16GB |
120GB |
Wicket
WAN
Interface
10.100.1.60
Wicket
LAN
Interface
10.100.1.61
DMZ
|
Dispel Enclave |
Cloud Virtual Machines |
Ubuntu 16.04 |
Variable |
Variable |
Variable |
N/A |
Dispel VDI |
Cloud Virtual Machine |
Windows Server 2016 |
Intel Xeon Platinum 8171M |
8GB |
120GB |
N/A |
2.1.2 Installation
Installation involves establishing an account on the Dispel cloud-infrastructure and deploying the preconfigured Wicket ESI device within the OT environment. Detailed installation information, customized to the end user’s deployment, is provided by Dispel.
After connecting the WAN and LAN network cables, configuring the Wicket ESI required connecting a monitor, keyboard, and mouse to the unit using the available VGA and USB ports. Logging into the unit locally using the credentials provided by Dispel enabled configuration of the network connections using the following procedure (note: these procedures were executed using root privileges and can also be performed using Sudo).
Update the network interfaces with the IP configuration information:
#> vi /etc/network/interfaces
source-directory /etc/network/interfaces.d
# LAN
auto enp4s0
allow-hotplug enp4s0
iface enp4s0 inet static
      address 10.100.1.61
      netmask 255.255.255.0
      #gateway
      up route add -net 10.100.0.0 netmask 255.255.255.0 gw 10.100.1.1 dev enp4s0
      up route add -net 172.16.0.0 netmask 255.255.252.0 gw 10.100.1.1 dev enp4s0

# WAN
auto enp0s31f6
allow-hotplug enp0s31f6
iface enp0s31f6 inet static
      address 10.100.1.60
      netmask 255.255.255.0
      gateway 10.100.1.1
      dns-nameservers <ip address>
Update the Wicket ESI netcutter.cfg file to include the local subnet information (toward the bottom of the file):
#> vi /home/ubuntu/wicket/netcutter.cfg
...
subnets = (
   {
      name = "Default";
      value = "10.100.0.0/24";
      advertise = "false";
   },
   {
      name = "PCS";
      value = "172.16.0.0/22";
      advertise = "false";
   },
   {
      name = "DMZ";
      value = "10.100.1.0/24";
      advertise = "false";
   } );
Restart the Wicket services with the following command:
#> service wicket restart
Check the log for errors and test connectivity to the Dispel environment (note: IP address will be account specific):
#> tail -f /home/ubuntu/wicket/wicket.log
2.1.3 Configuration
With the Wicket ESI connected to the lab environment, the solution may be configured by establishing an account and configuring the cloud infrastructure, configuring the corporate router/firewall to allow authorized connections to and from the Wicket ESI, and configuring the VDI environment to support the remote access to the ICS environments.
For full documentation and configuration instructions, see the Dispel documentation at https://intercom.help/dispel/en/.
Dispel created an organization named “NCCOE” with an Enclave name “NCCoE-Manufacturing” in their pre-production staging environment. A single “user” account was created for accessing the cloud infrastructure environment named nccoe-m-user@dispel.io. Organizations will need to plan for implementing multiple accounts for supporting the “owner” and “admin” roles in addition to the “user” roles. The “owner” and “admin” roles are for monitoring and managing the cloud infrastructure and are separate from the user accounts used to login to the VDI environment.
The staging environment was configured without the Dispel multifactor authentication (MFA) settings because personal identity verification (PIV) cards were not available as a supported mechanism, and the lab environment did not support authenticator application or security keys. However, MFA is very important for implementation and is strongly encouraged when planning the implementation. For this effort, to reduce the risk of not having the MFA implementation, NCCoE worked with Dispel to limit access to the cloud infrastructure and the VDI instances to only approved source IP addresses. The additional protection of restricting access to the cloud infrastructure and VDI instances is also encouraged to reduce the risks associated with the internet-accessible web and RDP services.
Configure Firewall Settings:
The Wicket ESI needs access to the internet and to the internal OT environment. Table 2‑2 below describes the firewall rules implemented on the corporate router/firewall for communications on the internet-facing firewall and internal network zone firewall.
Table 2‑2 Firewall Rules for Dispel
Rule Type |
Source |
Destination |
Protocol:Port(s) |
Purpose |
|---|---|---|---|---|
Allow |
10.100.1.60 |
IdAM:
159.65.111.193
Entry Node:
52.162.177.202
|
TCP/UDP:1194,
HTTPS
|
Outbound Secure Web to Dispel Environment on the Internet |
Allow |
10.100.1.61 |
10.100.1.0/24 |
ICMP
TCP/UDP:RDP,
SSH,
HTTP/HTTPS,
SMB, NTP
|
PLC Controller Scans |
Allow |
10.100.1.61 |
Security Onion 10.100.0.26 |
TCP:1515
UDP:1514
|
Build 2: Communication between Wazuh Agent and the server |
Allow |
10.100.1.61 |
172.16.0.0/22 |
TCP:RDP,
HTTP/HTTPS
|
Build 2: Authorized Inbound Communications to PCS Environment |
Allow |
10.100.1.61 |
Carbon Black 10.100.0.52 |
TCP:41002 |
Build 4: Communication port used between Carbon Black Agent and the server |
Allow |
10.100.1.61 |
CRS NAT 10.100.0.20 |
TCP:48898
UDP:48899
|
Build 4: Inbound Automation Device Specification (ADS) Protocol for Communication with PLC Device |
Notes:
Dispel’s recommended rule for allowing secure shell (SSH)for installation and remote support from the Dispel environment was not enabled for this effort.
The rules implemented include restricting these outbound ports to Enclave specific IP addresses.
The Enclave’s MTD characteristics were disabled to keep the Enclave’s IP addresses static for the duration of the project.
Configure Virtual Desktop Infrastructure (VDI):
The VDI instance is a fully functional workstation/server within the cloud environment. From the VDI instance, authorized users establish a VPN tunnel to the Wicket ESI within the OT environment and then have the access to the environment configured by the device and firewall configurations. In this effort, NCCoE implanted the VDI configuration to support Build 2 and Build 4. The configuration supports the OT environment’s jump server configuration (allowing RDP and SSH access to systems within the PCS and CRS environment) and remote engineering workstation (configuring the VDI with the tools needed to support the ICS environment). The configuration for each build is detailed in the following sections:
Build 2: PCS Configuration
For the PCS setup, the Dispel VDI was used in a jump server configuration. No additional software was installed. The firewall and Wicket ESI configuration allowed RDP and SSH connections to the PCS ICS environment. Additionally, RDP, SSH, and HTTP/HTTPS access to the Cybersecurity LAN environment was authorized for the remote sessions as defined in the previously described firewall settings, Table 2‑2.
Build 4: CRS Configuration
For the CRS setup, the Dispel VDI was configured as a remote engineering workstation. To support the Beckhoff PLC, the TwinCAT 3 XAE software was installed on a VDI, and the network drive provided by the GreenTec-USA solution and hosted in the DMZ environment that contained the PLC code was mapped to the VDI. Additionally, RDP, SSH, and HTTP/HTTPS access to the Cybersecurity LAN environment was authorized for the remote sessions as defined in the previously described firewall settings, Table 2‑2.
For the interaction with the Beckhoff PLC, the TwinCAT 3 XAE software (TC31-FULL-Setup.3.1.4024.10.exe) was installed on the VDI.
The Dispel VPN connection does not allow split-tunneling so, once the VPN connection is established from the VDI to the Wicket ESI, the VDI is disconnected from the internet. Therefore, download and installation of software occurred prior to connecting to the Wicket ESI.
Due to the NAT configuration of the RUGGEDCOM RX1510 router between the Cybersecurity LAN and the CRS environment, port forwarding rules were configured to allow external traffic to reach the Beckhoff CX9020 PLC.
The following rules (Table 2‑3) were created in the RX1510 firewall to enable destination network address translation (DNAT) from the firewall WAN interface (10.100.0.20) to the CRS PLC (192.168.0.30)
Table 2‑3 Firewall Rules
Rule Type |
Source |
Destination |
Destination Port(s) |
Purpose |
|---|---|---|---|---|
DNAT |
10.100.1.61 |
192.168.0.30 |
UDP:48899 |
DNAT (10.100.0.20) - Beckhoff ADS discovery protocol used by the TwinCAT 3 software to discover ADS devices. |
DNAT |
10.100.1.61 |
192.168.0.30 |
TCP:48898 |
DNAT (10.100.0.20) - Beckhoff ADS protocol used by the TwinCAT 3 software to communicate with the PLC. |
As described in 2.a above, the GreenTec WORMdisk (\10.100.1.7crs) was mapped to the VDI to access the PLC code. The configuration to map Windows is shown in Figure 2‑2 below:
Figure 2‑2 Mapping a Network Drive
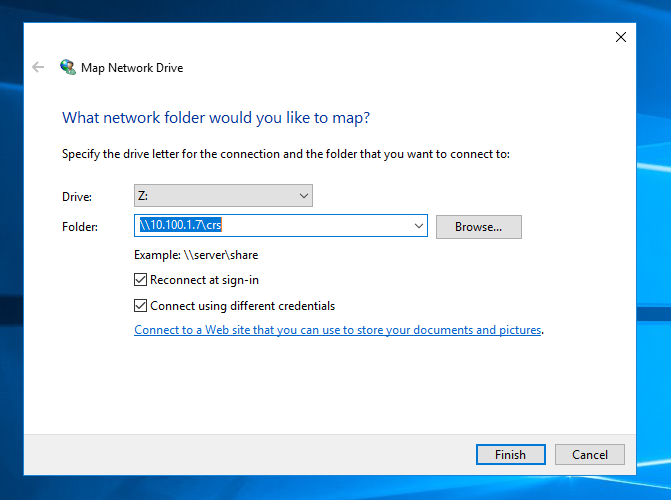
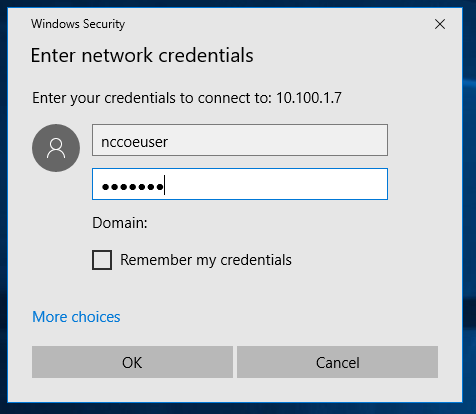
After clicking Finish, the user is prompted for credentials, as shown in Figure 2‑3. An account authorized to access the network drive must be used. This is separate from the Dispel VDI credentials.
Figure 2‑3 Authentication to File Server
2.2 Dragos
The Dragos platform implementation in Build 3 consists of two physical servers hosting the Dragos SiteStore and the Dragos sensor to meet the behavioral anomaly detection (BAD), hardware modification, firmware modification, and software modification capabilities. Dragos utilizes a combination of a passive sensor and integration with the OSIsoft PI Server to monitor critical networks for anomalies. OSIsoft PI performs active querying to retrieve information about endpoints in the CRS environment, which is shared with Dragos.
2.2.1 Host and Network Configuration
Dragos is installed and configured to support the CRS Environment in Build 3. The overall build architecture is shown in Figure B-3, and the Dragos specific components are listed in Table 2‑4.
Table 2‑4 Dragos Deployment
Name |
System |
OS |
CPU |
Memory |
Storage |
Network |
|---|---|---|---|---|---|---|
VMware Server |
Dell OEMR R740 |
VMware 6.7.0 Update 3 |
2x Intel 6130 CPU |
384 GB |
2x 1.5TB Mirror 6x 8TB RAID 10 |
Testbed LAN 10.100.0.62/24 |
Dragos Server |
VMware |
CentOS 7 |
48x vCPU |
192 GB |
215 GB 10 GB 1.5 TB 1.5 TB |
Testbed LAN 10.100.0.63/24 |
Dragos Sensor |
Dell OEM |
CentOS 7 |
64x vCPU |
128 GB |
240 GB 1 TB |
Testbed LAN 10.100.0.64/24 |
2.2.2 Installation
The Dragos platform, which includes the SiteStore server and the Dragos sensor, was delivered as pre-configured hardware appliance by Dragos with the required IP addresses already assigned. The only installation step was correctly connecting the server and the sensor management ports to the Testbed LAN and adding the switch port analyzer (SPAN) port connection to the sensor.
The Dragos Platform Administrator Guide and Dragos Platform User Guide for Release 1.7 were used to guide the installation. Customers can obtain these guides from Dragos.
2.2.3 Configuration
In addition to the standard configuration preset by Dragos, the Dragos Platform was configured to work with OSIsoft PI for alerting on certain conditions.
Configure the Dragos SiteStore Server:
Configure the data connection between Dragos SiteStore and OSIsoft PI Server:
Once installation is successful, open a browser to access the configuration screen by using the URL https://<SiteStore ip address>/osisoft/#/apps. (Figure 2‑4)
Figure 2‑4 Dragos OSIsoft PI Server Integration
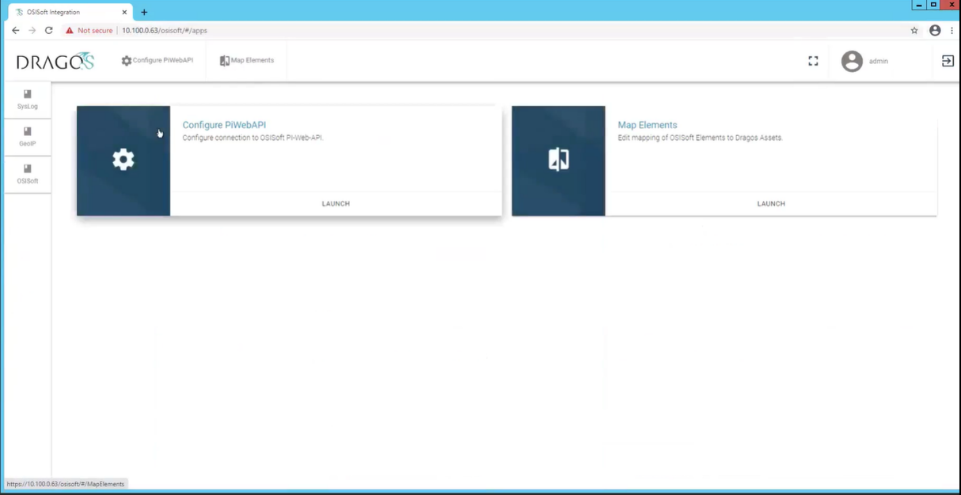
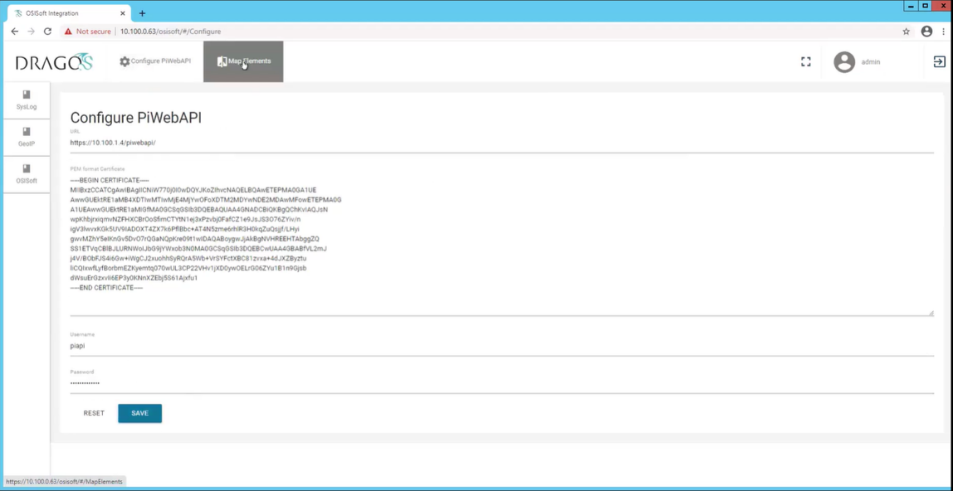
Click Configuration Pi Web API to open a screen for filling out the required information, including privacy enhanced mail (PEM) format certificate and password for secure authentication (Figure 2‑5).
Upload the server public key for the HTTPS certificate.
Specify the user credentials for the OSIsoft PI Web API interface.
Click Save.
Figure 2‑5 Dragos PI Web API Configuration
Click Map Elements to access the interface to pair elements between OSIsoft PI Server and the Dragos Platform assets. Here, the PLC in OSIsoft Elements panel is paired with Beckhoff asset in the Dragos Platform asset (Figure 2‑6).
Select the OSIsoft Database CRS-backup on the left side to access the devices list from the Historian Database.
Select the Default NetworkID RFC 1918 and use the Filer options to find specific assets.
For each asset in the OSIsoft Database, select the corresponding asset in the Dragos asset repository and click Pair Selected.
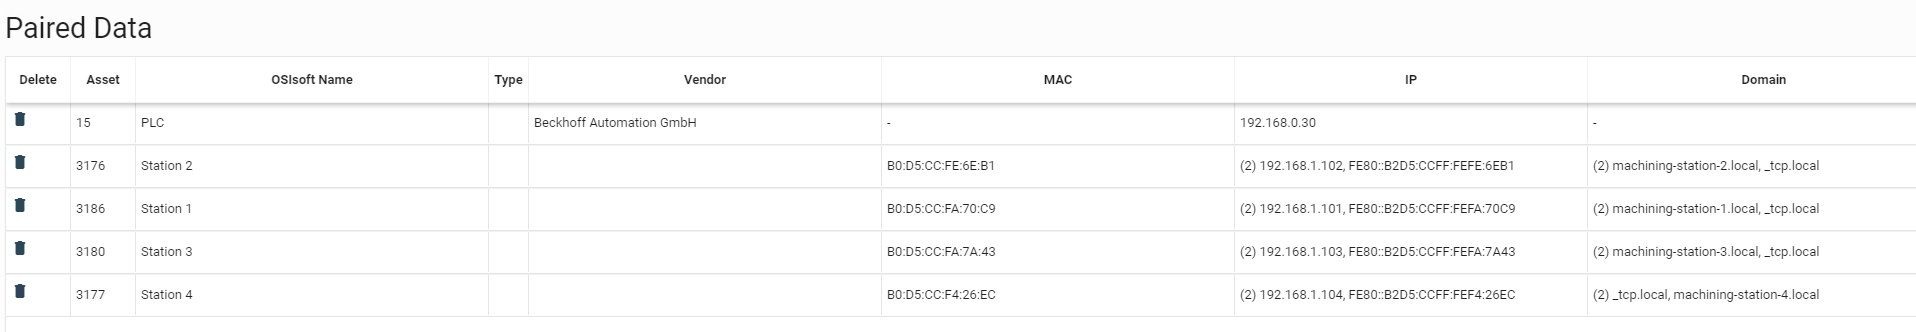
Repeat this process for each asset until all paired assets are listed in the Paired Data table (Figure 2‑7).
1) PLC paired to 192.168.0.302) Station 1 paired to 192.168.1.1013) Station 2 paired to 192.168.1.1024) Station 3 paired to 192.168.1.1035) Station 4 paired to 192.168.1.104
Figure 2‑6 OSIsoft PI Server to Dragos Asset and Data Pairing
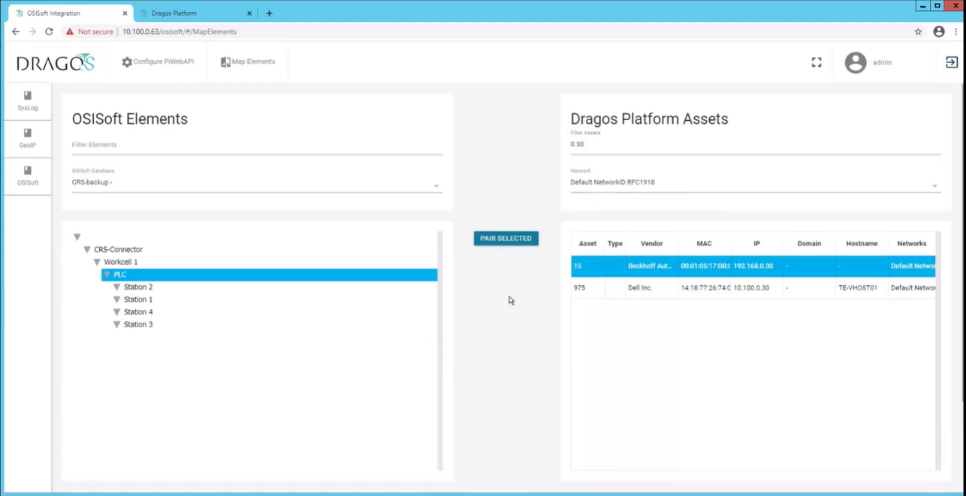
Figure 2‑7 OSIsoft PI Server and Dragos Paired Data Elements
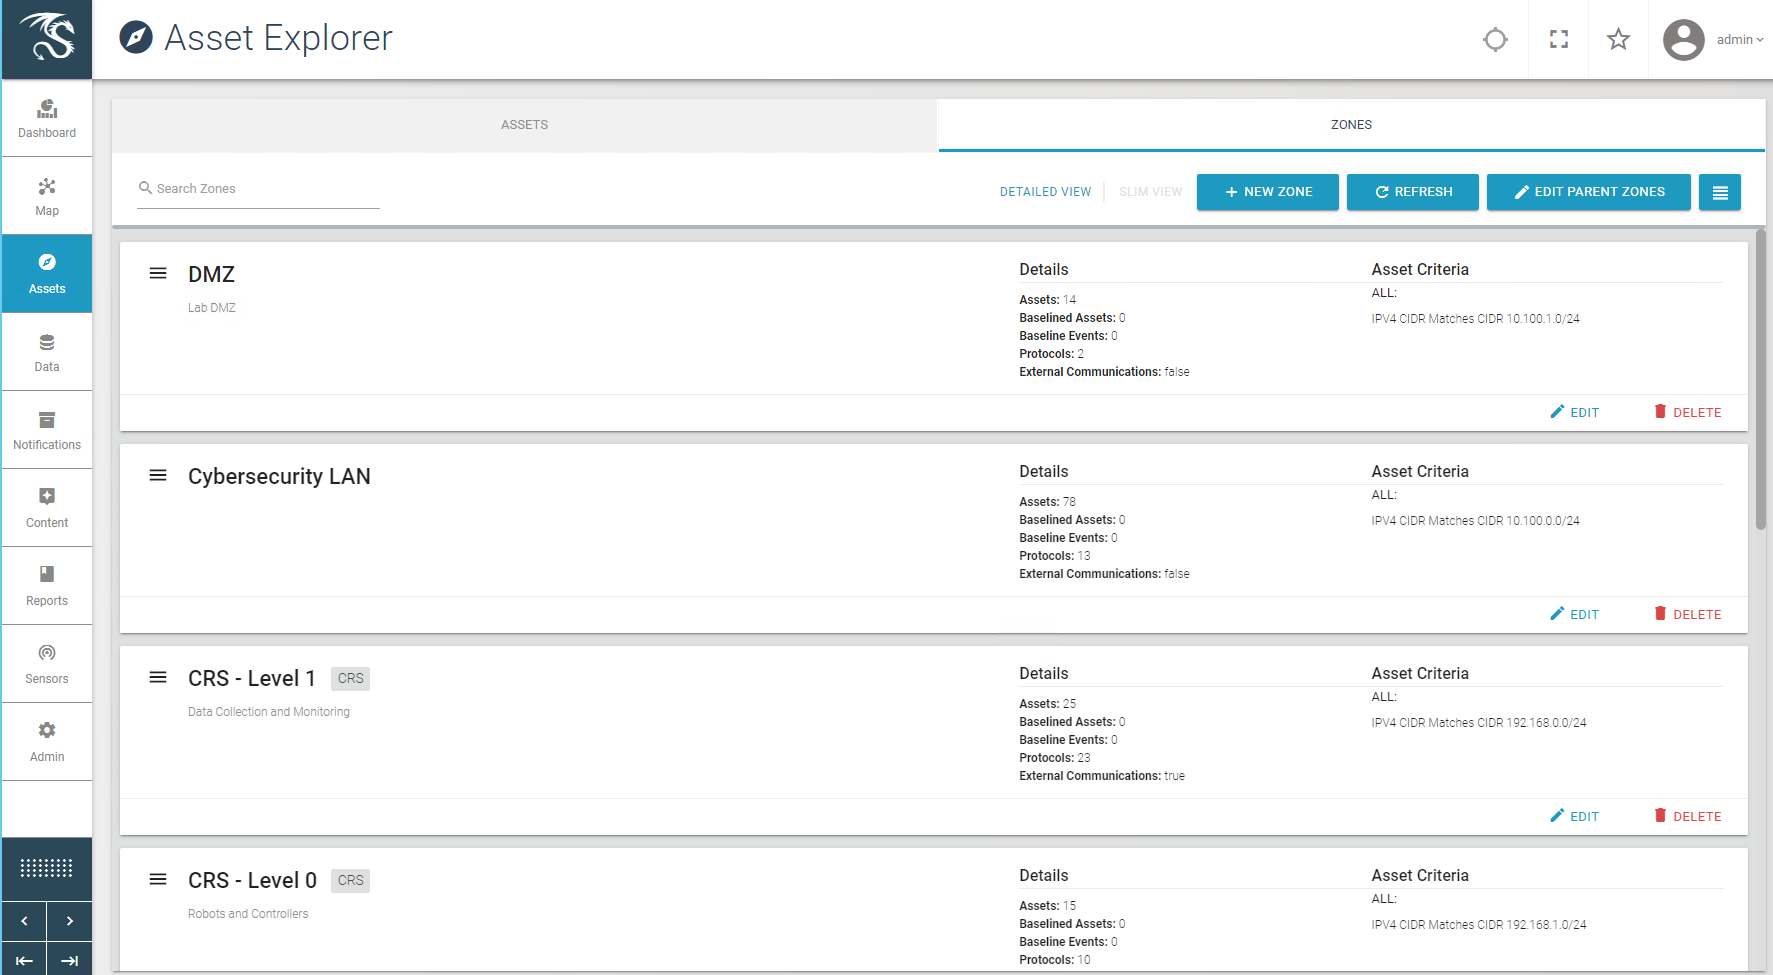
Configure Zones
NOTE: Zones are ordered in a similar manner to firewall rules. In other words, higher rules have priority over lower rules.
Click Assets and select the Zones tab (Figure 2‑8).
Figure 2‑8 Dragos Zone Administration Page
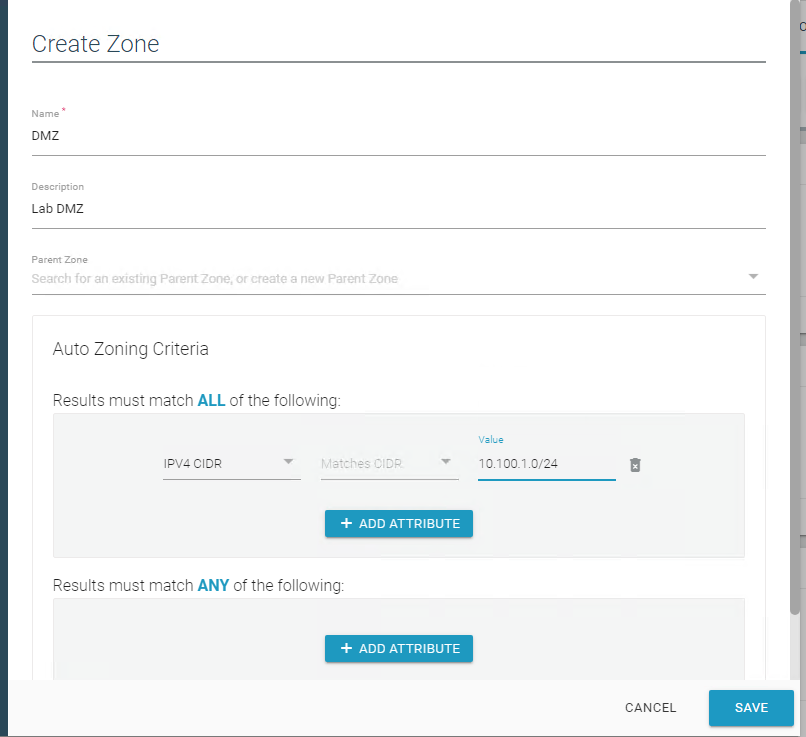
Click + New Zone (Figure 2‑9) and define the following zones:
Name: DMZ:
1) Description: Lab DMZ2) Zone Criteria (Match ALL):a) IPV4 CIDR Matches CIDR 10.100.1.0/24Name: Testbed LAN:
1) Description: Lab Testbed LAN2) Auto Zone Criteria (Match ALL):a) IPV4 CIDR Matches CIDR 10.100.0.0/24Name: CRS:
1) Description: Parent CRS2) No CriteriaName: CRS – Level 0:
1) Description: Robots and Controllers2) Parent Zone: CRS3) Auto Zone Criteria (Match ALL):a) IPV4 CIDR Matches CIDR 192.168.1.0/24Name: CRS – Level 1:
1) Description: Lab DMZ2) Parent Zone: CRS3) Auto Zone Criteria (Match ALL):a) IPV4 CIDR Matches CIDR 192.168.0.0/24
Figure 2‑9 Dragos Create Zone Pop-up
2.3 Forescout Platform
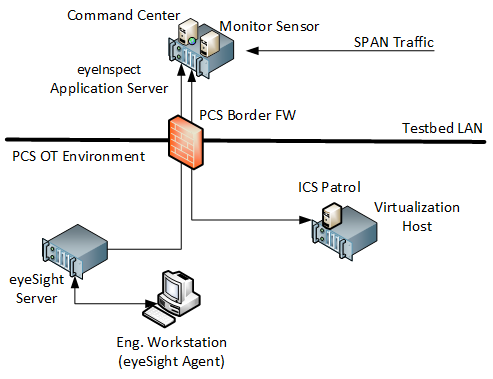
The Forescout products included in the practice guide are eyeInspect (formally SilentDefense), eyeSight, ICS Patrol, and Forescout Console. These products are utilized in Build 2 to meet the BAD, hardware modification, firmware modification, and software modification capabilities. The Forescout implementation utilizes different components and modules installed on different devices to monitor critical networks for anomalies and active query capabilities to retrieve information about endpoints in the PCS environment. A high-level of the key server and agent components is presented in Figure 2‑10.
Figure 2‑10 Forescout High-Level Components and Dataflows
eyeInspect (formally SilentDefense)
The eyeInspect (Version 4.1.2) control server and monitoring sensor are installed on a single appliance with a management interface on the Testbed VLAN and network monitoring capabilities through a dedicated SPAN port. The SPAN port provides passive monitoring for network-based anomalies and retrieves information about endpoints within the network. The eyeInspect appliance also serves as the command center for supporting the ICS Patrol and eyeSight components.
eyeSight
Forescout eyeSight (Version 8.2.1) provides enhanced network monitoring and response using an agent installed on endpoints. In this build, eyeSight instances are configured through the Forescout Console to provide additional monitoring and reporting information to eyeInspect.
ICS Patrol
Forescout ICS Patrol (Version 1.1.2-4.a826b94) is a sensor that supports active queries for ICS devices to obtain status and other information such as hardware configuration and firmware version. ICS Patrol queries and reporting results are managed through eyeInspect.
Forescout Console
The Forescout Console (Version 8.2.1) is a Java-based application for configuring and managing eyeSight and eyeSight agents. The Forescout Console is installed on a computer with network access to the eyeSight server.
2.3.1 Host and Network Configuration
Forescout was installed and configured to support the PCS Environment as part of Build 2. The overall build architecture is provided in Figure B-2 with the Forescout specific components in Table 2‑5 and the eyeSight agents in Table 2‑6.
Table 2‑5 Forescout Deployment
Name |
System |
OS |
CPU |
Memory |
Storage |
Network |
|---|---|---|---|---|---|---|
eyeInspect control server |
Dell Embedded Box PC 5000 |
Ubuntu 16.04 |
Intel i7-6820EQ |
32 GB |
250 GB |
Testbed LAN 10.100.0.65 |
Forescout Console |
Hyper-V VM |
Windows 2012R2 |
2x vCPU |
6 GB |
65 GB |
Testbed LAN 10.100.0.25 |
eyeSight Server |
Dell R640 |
Ubuntu 16.04.06 |
Intel Xeon Silver 4110 |
32 |
600 GB |
PCS VLAN 2 172.16.2.61 |
ICS Patrol |
VirtualBox VM |
Ubuntu 16.04.06 |
2x vCPU |
2 GB |
40 GB |
PCS VLAN 2 172.16.2.62 |
For the lab environment, network connectivity between the components in the Testbed LAN and the components in the PCS environment required the following persistent route configured on Testbed LAN systems:
route -p ADD 172.16.0.0 MASK 255.255.252.0 10.100.0.40
The following systems were configured to utilize the eyeSight Agents.
Table 2‑6 eyeSight Agent Deployment
Name |
System |
OS |
CPU |
Memory |
Storage |
Network |
|---|---|---|---|---|---|---|
Engineering Workstation |
Dell T5610 |
Windows 7 |
Intel i5-4570 |
16 GB |
465 GB |
PCS VLAN 3 172.16.3.10 |
HMI Host |
Generic |
Windows 7 |
Intel i5-4590 |
8 GB |
233 GB |
PCS VLAN 1172.16.1.4 |
Additional details for Build 2 are available in Section 4.5 of Volume B.
2.3.2 Installation
The Forescout products included in the practice guide are eyeInspect, Forescout Console, ICS Patrol, and eyeSight. These products are installed as indicated in the appropriate subsection below. To support these components, the PCS Gateway/Firewall rules were updated as follows (Table 2‑7).
Table 2‑7 Firewall Rules for Forescout
Rule Type |
Source |
Destination |
Port(s) |
Purpose |
|---|---|---|---|---|
Allow |
10.100.0.65 |
172.16.2.61 |
22 (ssh)
9999
9092
|
System Management
eyeInspect Data
eyeInspect Data
|
Allow |
10.100.0.65 |
172.16.2.62 |
22 (ssh)
9001
|
System Management
eyeInspect Data
|
2.3.2.1 eyeInspect
eyeInspect is an appliance hosted on a Dell Embedded Box PC 5000. The unit was placed within a standard datacenter rack unit with the eyeSight appliance and connected to the network as described in Section 2.3.1. SPAN ports from the DMZ, Testbed LAN, and PCS VLAN 1, 2, and 3 switches were routed to the appliance for passive network monitoring. Installation also required uploading the license file after successfully logging onto the appliance.
2.3.2.2 Forescout Console
Forescout Console was installed following the standard installation procedures. Instructions can be found in the Forescout Installation Guide Version 8.2.1 available at https://docs.forescout.com. The software is available from https://forescout.force.com/support/s/downloads, where current and past versions are available. Login credentials were provided by Forescout.
2.3.2.3 eyeSight
Forescout eyeSight is an appliance hosted on a 1U Dell R640 that is installed within a standard datacenter rack and connected to the network as described in the previous section.
2.3.2.4 eyeSight SecureConnector Agent
In a browser on a system with web connectivity to the eyeSight server, navigate to https://172.16.2.61/sc.jsp to access the SecureConnector download page (Figure 2‑11) and follow these steps:
Select Create SecureConnector for: Windows.
Enable Show the SecureConnector icon on the endpoint systray.
Select Install Permanent As Service.
Click Submit.
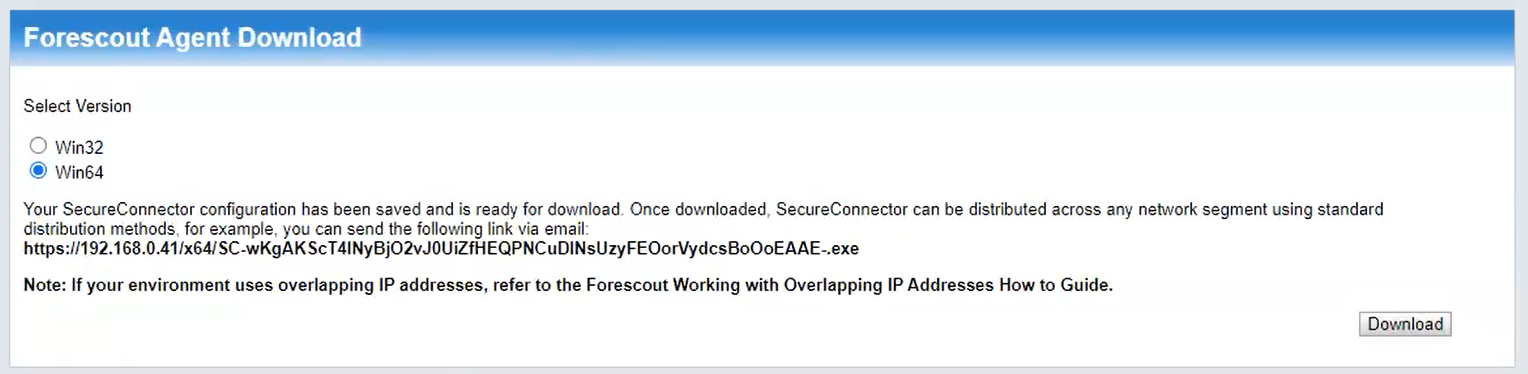
Download the Forescout Agent (Figure 2‑12):
Select Version Win64.
Click Download.
Install the downloaded agent on the target systems using an administrator account.
Figure 2‑11 Forescout SecureConnector Distribution Tool
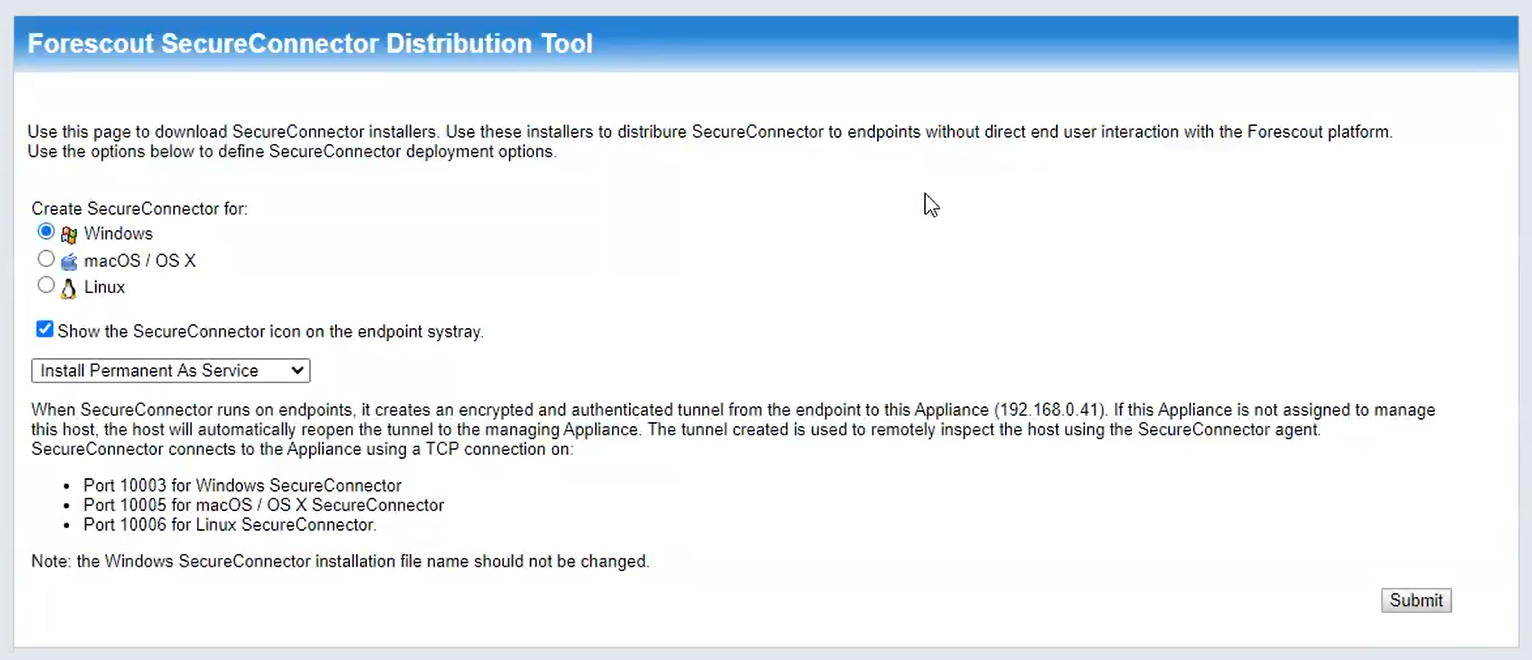
Figure 2‑12 Forescout Agent Download
2.3.2.5 ICS Patrol
Forescout ICS Patrol (Version 1.1.2-4.a826b94) is a sensor that is deployed on an existing VirtualBox host in the PCS environment. Ubuntu 16.04.06 is required for proper installation and can be downloaded from http://old-releases.ubuntu.com/releases/xenial/ubuntu-16.04.6-server-amd64.iso. Install the operating system on a VM connected to PCS VLAN 2 following the procedures from the Silent Defense Installation and Configuration Guide 4.1.2 document Section 2.2.2, Installing the Linux Ubuntu OS.
Install the ICS Patrol Component from the Silent Defense Installation and Configuration Guide 4.1.2 document Sections 2.2.4 and 2.2.5 following these steps:
Establish an SSH session to the eyeInspect appliance.
Copy the components to the ICS Patrol VM:
$ scp os_provisioning_4.1.1_install.run \
main_configuration_4.1.1_install.run \
[email protected]:/home/silentdefense
SSH to the ICS Patrol VM and execute the installation components:
$ chmod a+x *.run
$ sudo ./os provisioning 4.1.1 install.run
$ sudo ./main_configuration_4.1.1_install.run
$ sudo reboot
2.3.3 Configuration
The eyeSight agents and ICS Patrol do not require specific configurations.
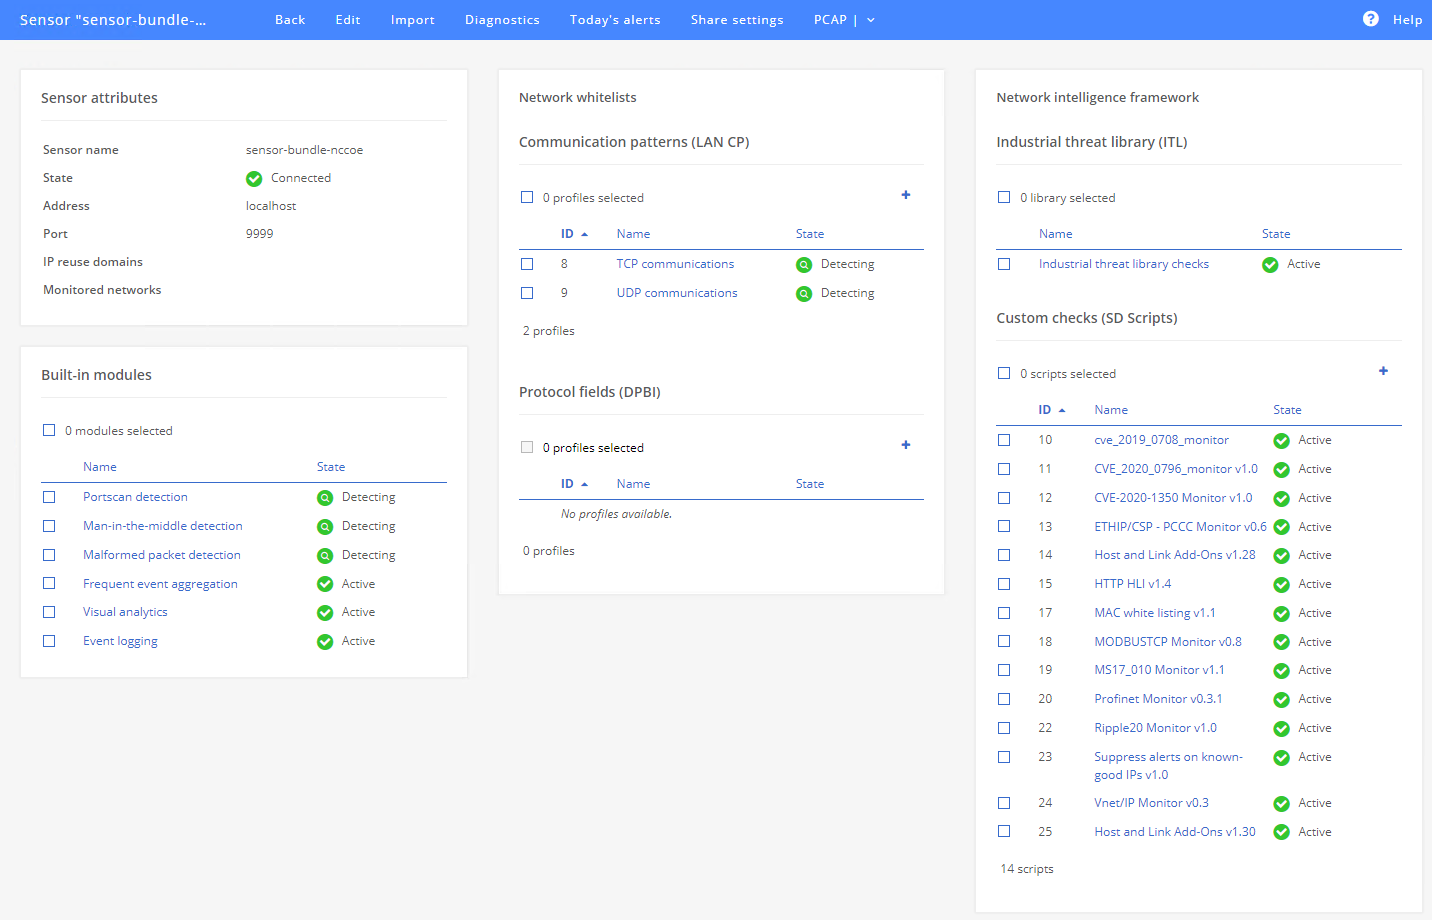
2.3.3.1 eyeInspect
Access the eyeInspect web interface and log in with an administrator account.
Register the local sensor for SPAN traffic monitoring:
Click the Sensors tab to access the Sensor Admin/Overview Page (Figure 2‑13).
Click Add > SilentDefense sensor.
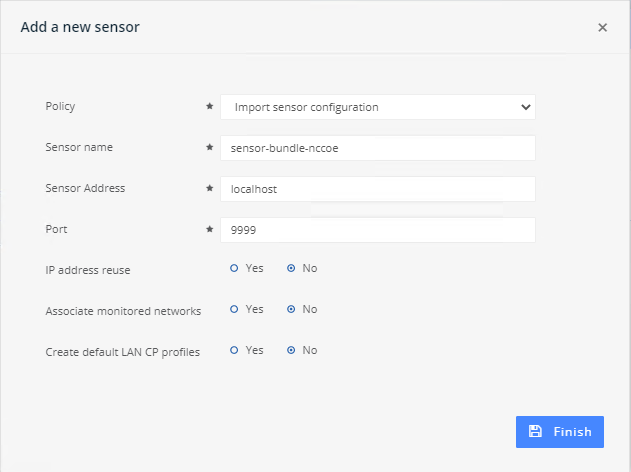
Specify the sensor parameters in the dialog box (Figure 2‑14).
Figure 2‑13 eyeInspect Sensor Admin/Overview Page – Add Sensor
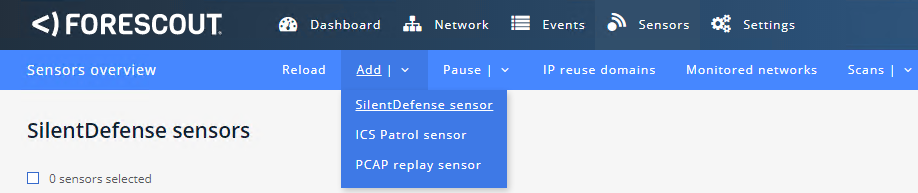
Figure 2‑14 Adding a New SilentDefense Sensor Dialog
Adjust Passive Monitoring settings:
From the Dashboard, click Sensors.
Select the SilentDefense Sensor from the list of available sensors.
Click the Industrial Threat Library Overview option in the upper right corner.
Click the Security menu option on the left under Checks by Category.
Enter “ICMP” in the Search field to reduce the list of available options.
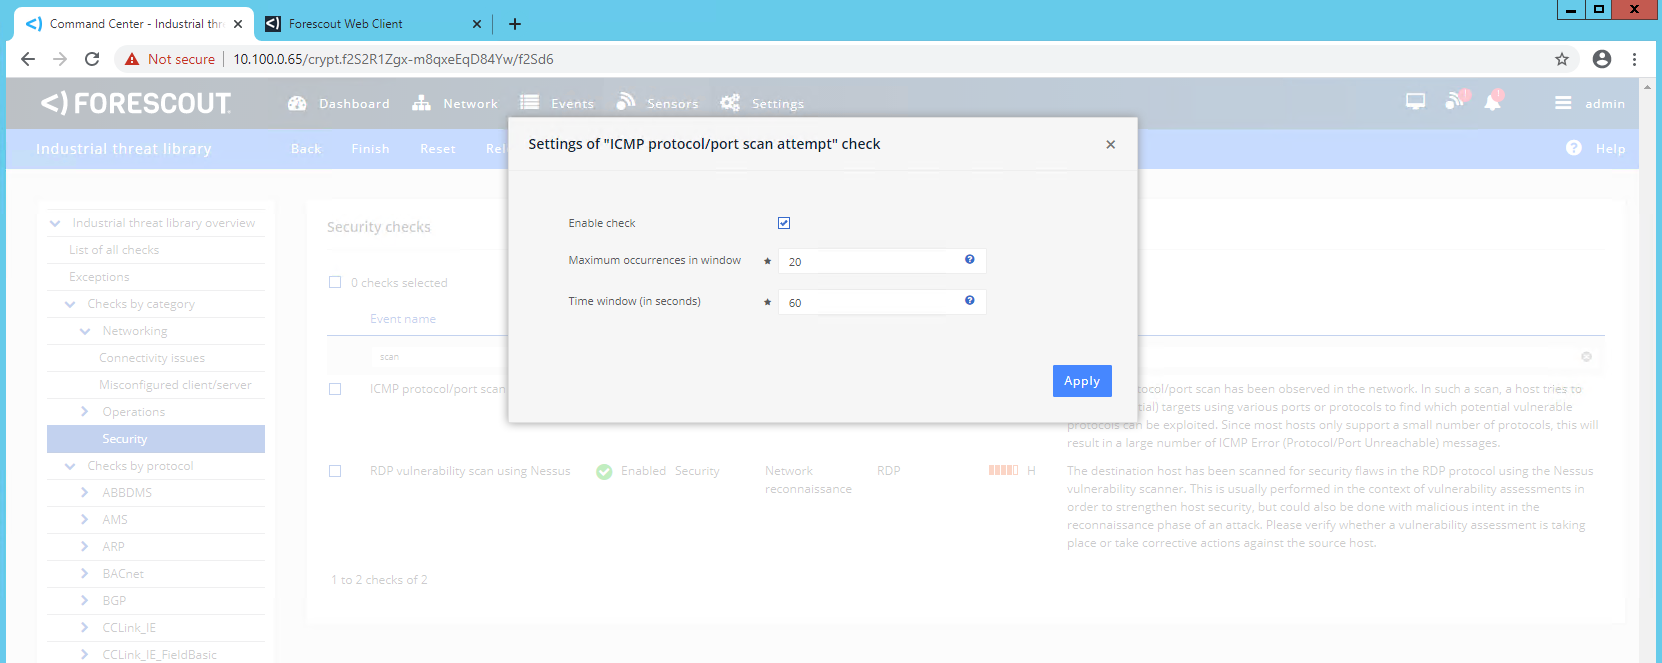
Click the ICMP protocol/port scan attempt to open the settings dialog box ( Figure 2‑15) and verify the following settings:
Verify Enable Check is selected.
Verify Maximum occurrences in window is set to 20.
Verify Time Window (in seconds) is set to 60.
Figure 2‑15 eyeInspect ICMP Protocol/Port Scan Attempt Settings
Select Portscan Detection under Built-in Modules (Figure 2‑16).
Figure 2‑16 eyeInspect Sensor Configuration Options
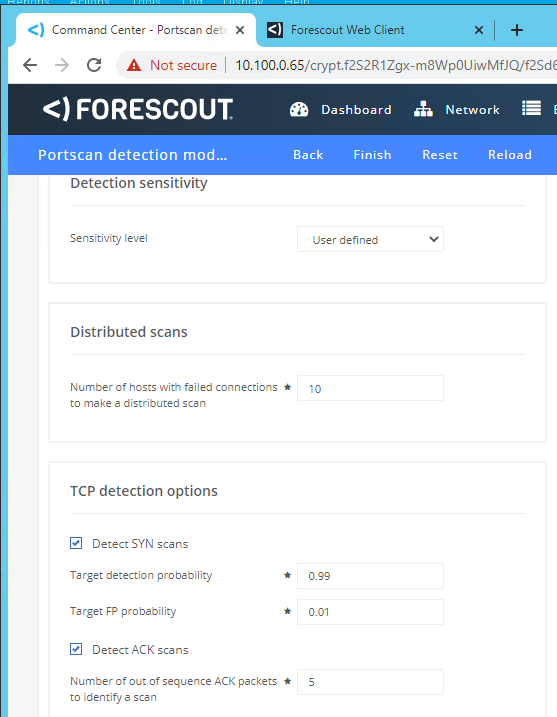
Click the Settings tab and set the following parameters (Figure 2‑17):
Sensitivity level: User defined
Number of Hosts with failed connections to make a distributed scan: 10
Detect SYN scans: Checked
Target detection probability: 0.99
Target FP probability: 0.01
Detect ACK scans: Checked
Number of out of sequence ACK packets: 5
Figure 2‑17 eyeInspect Portscan Detection Settings
Register the ICS Patrol Sensor:
From the Sensor admin page, click Add > ICS Patrol sensor.
Specify the sensor parameters in the dialog box (Figure 2‑18).
Figure 2‑18 Add ICS Patrol Sensor Dialog
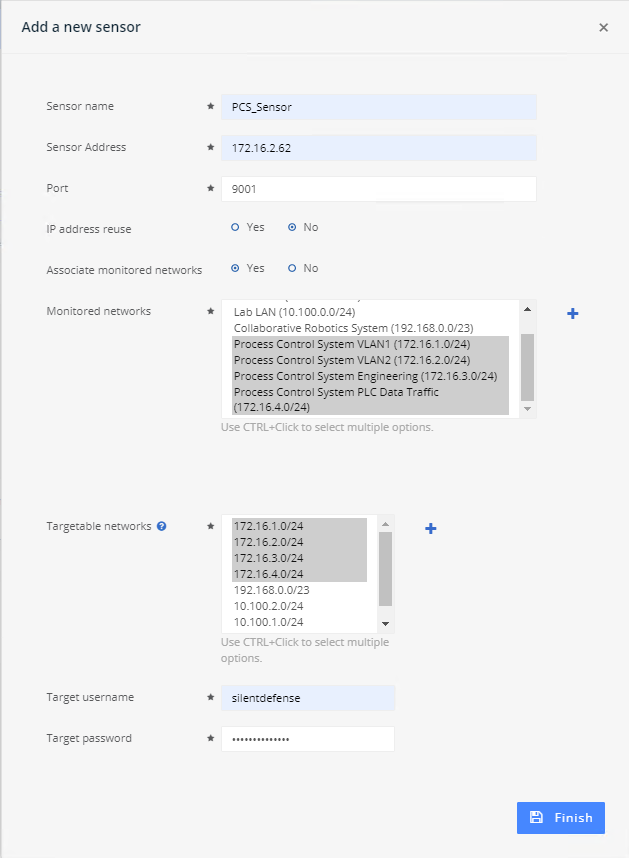
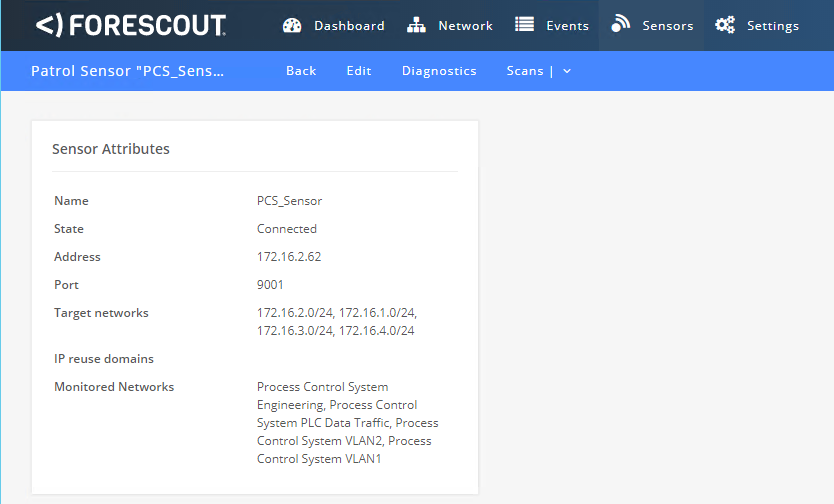
Define a scan policy to periodically check the PCS PLC to monitor for changes.
Click the PCS Sensor created in the previous step to open the sensor admin page (Figure 2‑19).
Figure 2‑19 ICS Patrol Sensor Admin Page
Click Scans > Scan Policies.
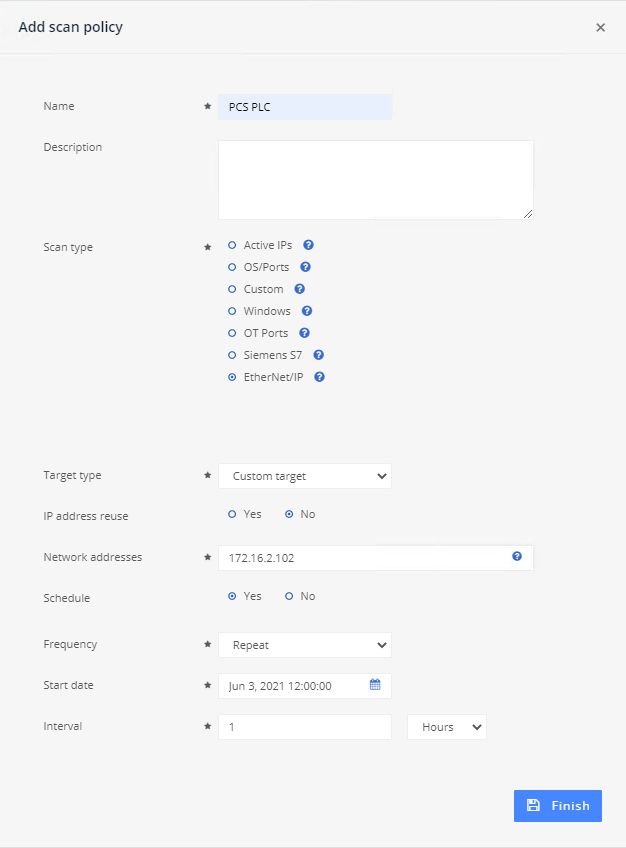
In the dialog option (Figure 2‑20) enter the scanning parameters:
1) Name: PCS PLC2) Scan Type: EtherNet/IP3) Target Type: Custom target4) IP address reuse: No5) Network Address: 172.16.2.1026) Schedule: Yes7) Frequency: Repeat8) Interval: 1 . Select “Hours” from the drop-down menu.9) Click Finish.
Figure 2‑20 Add an ICS Patrol Scan Policy
2.3.3.2 eyeSight
Using the Forescout Console application, users may configure, monitor, and manage the eyeSight appliance and agents. The Forescout Console is also used to test and verify connectivity to the eyeInspect server.
Login to the Forescout Console.
Select the Gear Icon in the upper right corner or the Tools > Option menu item to bring up the Options display.
Enter “Operational” in the search bar.
Select the Operational Technology tab on the left side of the screen to display the current settings.
Select the IP entry for the Command Center and select Add to start the workflow process.
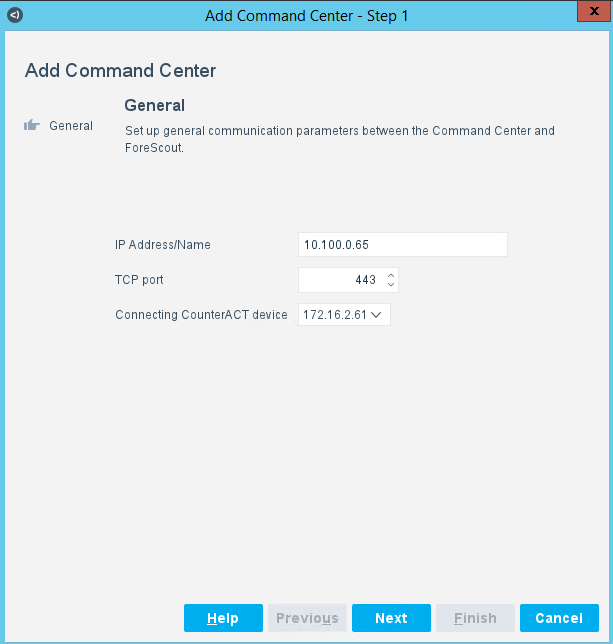
Specify General Information (Figure 2‑21):
Enter the Command Center IP Address “10.100.0.65” for IP Address/Name.
Select “172.16.2.61” from the Connecting CounterAct device drop-down menu.
Select “443” from the TCP Port drop-down menu.
Figure 2‑21 eyeSight Add Dialog – General Information
Click Next.
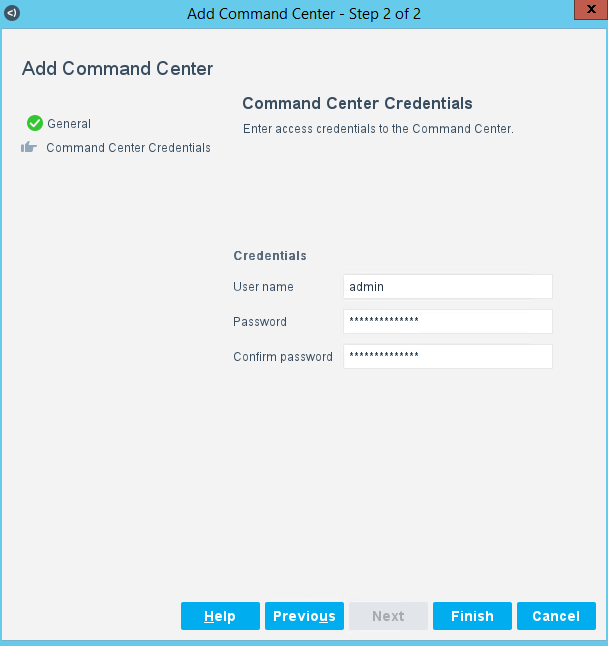
Enter the command center credentials (Figure 2‑22).
Click Finish.
Figure 2‑22 eyeSight Add – Command Center Credentials
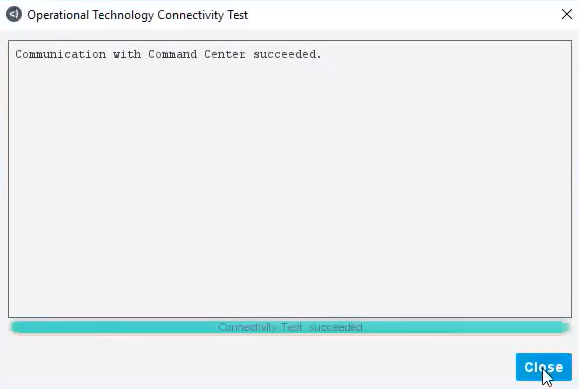
Select the IP address for the Command Center and Click Test (Figure 2‑23). If the connection is successful, a message like the one shown in Figure 2‑24 displays.
Click Apply to save the changes.
Click Close to close the message.
Figure 2‑23 eyeSight OT Settings
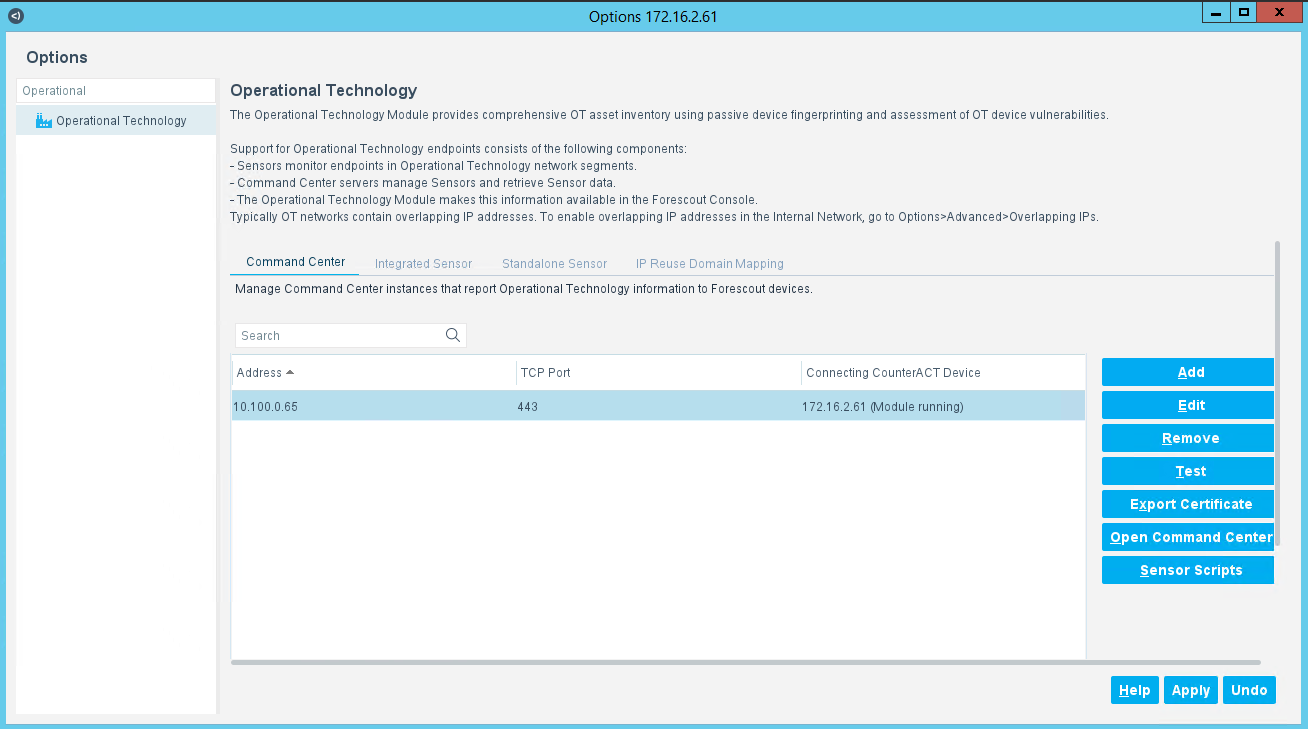
Figure 2‑24 eyeSight Test Connection Successful Message
2.4 GreenTec-USA
The GreenTec-USA products included in this practice guide are the ForceField and WORMdisk zero trust storage devices. These products were utilized in Builds 1, 2, 3, and 4 to meet the File Integrity Checking capability by storing and protecting critical PCS and CRS data from modification and deletion.
ForceField
A ForceField hard disk drive (HDD) provides a protected write-once-read-many data storage location for historian data backups and database backups. Data is immediately protected as it is written to the HDD in real time, permanently preventing the data from modification and deletion.
WORMdisk
A WORMdisk HDD provides a protected data storage location for PLC logic, device firmware, and approved software applications for use in the manufacturing environment. Data is protected by “locking” individual partitions of the HDD using a software utility, permanently preventing the data from modification and deletion.
2.4.1 Host and Network Configuration
The WORMdisk and ForceField HDDs were installed in a rack-mount server appliance provided by GreenTec-USA and described in Table 2‑8. The overall build architectures utilizing this appliance and devices are described in Section 4.5 in Volume B.
Table 2‑8 GreenTec-USA WORMdrive and ForceField Deployment
Name |
System |
OS |
CPU |
Memory |
Storage |
Network |
|---|---|---|---|---|---|---|
GreenTec-USA Server |
Supermicro x8 Series Server |
Ubuntu 18.04 |
2x Intel Xeon E5620 |
16 GB |
750 GB OS
1.0 TB
WORMdisk
1.0 TB
ForceField
|
DMZ
10.100.1.7
|
2.4.2 Installation
The ForceField and WORMdisk HDDs were hosted on a hardware appliance provided by GreenTec-USA. The unit was placed within a standard datacenter rack unit and connected to the network as shown in Figure B-1, Figure B-2, Figure B-3, and Figure B-4.
Full documentation and installation guides are provided to customers by GreenTec-USA.
NIST chose to utilize Samba as the network file sharing protocol due to the prevalence of Windows and Linux workstations within the testbed. The GreenTec-USA appliance did not come with Samba pre-installed, so installation was performed via the Ubuntu Advanced Packaging Tool and the Ubuntu package repository.
NOTE: GreenTec-USA typically provides turnkey server storage solutions. Installation and configuration of file sharing packages and other software will likely not be required.
NOTE: Many of the commands used to manage the ForceField and WORMdisk HDDs must be executed by a user with superuser privileges or as the root user.
Add the default gateway so the appliance can communicate to other devices on the network using the following command:
$ sudo route add default gw 10.100.1.1In a terminal window on the GreenTec-USA appliance, execute these commands:
$ sudo apt update
$ sudo apt -y install samba
$ sudo ufw allow samba
2.4.3 Configuration
The appliance provided by GreenTec-USA for this project was
preconfigured with the ForceField HDD as device /dev/sdc and the
WORMdisk HDD as device /dev/sdb.
2.4.3.1 ForceField HDD
The ForceField HDD is configured as a mounted volume, allowing the drive to be used as a typical HDD by using native operating system commands.
Create a mount point (empty directory) for the ForceField HDD using the following command:
$ sudo mkdir /mnt/forcefieldStart the ForceField WFS volume manager to mount the drive using the following command:
$ sudo /opt/greentec/forcefield/bin/wfs /dev/sdc /mnt/forcefield/
2.4.3.2 WORMdisk HDD
The WORMdisk is divided into 120 partitions to enable periodic updates and revisions to the protected data (i.e., data in the “golden” directory). Once a partition is locked it cannot be modified, so the next sequential partition on the drive is used as the new “golden” directory.
Format the WORMdisk with 120 partitions (NOTE: this operation must be performed from the command line as administrator on a computer with the Microsoft Windows OS) using the following command:
> gt_format.exe 1 /parts:120In the Ubuntu OS, create the mountpoint for the WORMdisk HDD partition using the following command:
$ sudo mkdir /mnt/goldenAdd a persistent mount to the /etc/fstab file:
$ sudo echo “/dev/sdb2 /mnt/golden fuseblk
rw,nosuid,nodev,relatime,user_id=0,group_id=0,allow_other,blksize=4096
0 0” >> /etc/fstab
Create a directory structure within the “golden” directory and copy approved files into those directories (e.g., PLC logic, device firmware, approved software).
Once all files have been copied and verified, lock the partition to protect the data:
$ sudo /greentec/Ubuntu/wvenf /dev/sdb2
When it is time to create a new “golden” partition, the partition names
in the /etc/fstab file must be updated to point to the correct
partition. The following instructions provide an example process to
update the files and increment the golden partition from /dev/sdb2 to
/dev/sdb3.
On the GreenTec-USA appliance, create a temporary directory, mount the folder to the next unlocked WORMdisk partition, and copy existing “golden” files to the temporary directory:
$ sudo mkdir /mnt/tmp
$ sudo mount /dev/sdb3 /mnt/tmp
$ sudo cp -R /mnt/golden /mnt/tmp
Update the files and folders in the temporary directory, /mnt/tmp, as desired.
Unmount the temporary directory and lock the partition:
$ sudo umount /mnt/tmp
$ sudo /greentec/Ubuntu/wvenf /dev/sdb3
Stop the Samba service:
$ sudo systemctl stop smb.serviceUnmount the golden partition:
$ sudo umount /mnt/goldenModify the /etc/fstab file with the new partition name and save the file:
/dev/sdb3 /mnt/golden fuseblk
rw,nosuid,nodev,relatime,user_id=0,group_id=0,allow_other,blksize=4096
0 0”
Re-mount all partitions, start the Samba service, and remove the temporary directory:
$ sudo mount -a
$ sudo systemctl stop smb.service
$ sudo rmdir -r /mnt/tmp
2.4.3.3 Samba
Add local user accounts to the appliance for accessing the network file shares and create a password:
$ sudo adduser nccoeuser
$ sudo smbpasswd -a nccoeuser
Open the file /etc/samba/smb.conf and add the following content to the end of the file to create the individual shares:
# GreenTec-USA ForceField Share
strict sync=no

# OSIsoft PI historian and database backups
  [ForceField]
  browsable = yes
  guest ok = no
  path = /mnt/forcefield
  read only = no
  writeable = yes
  case sensitive = yes

# GreenTec-USA Golden WORMDisk Share
[golden]
  browsable = yes
  guest ok = no
  path = /mnt/golden
  read only = no
  writeable = yes
  case sensitive = yes
Restart Samba:
$ sudo systemctl restart smbd.service
2.4.3.4 OSIsoft PI Server and Database Backups
Create the scheduled backup task to backup PI Data Archive files. The script automatically inserts the current datetime stamp into the filename of each file copied to the ForceField drive. Follow these steps:
On the server containing the PI Data Archive, open a command prompt with Administrator privileges.
Change to the PIadm directory:
> cd /d “%piserver%adm”Create the backup directory, and start the Windows scheduled task to perform the backup:
> pibackup h:\PIBackup -install
Create a scheduled task to copy the backup files to the ForceField HDD. Follow these steps:
Open the Task Scheduler and create a new scheduled task to rename, timestamp, and copy the backup files to the ForceField HDD:
Trigger: At 3:30 AM every day
Action: Start a Program
Program/script:
C:\Windows\System32\WindowsPowerShell\v1.0\powershell.exeAdd arguments (optional):
-Command { Get-ChildItem -Path
"h:\PIBackup\arc\" \| foreach { copy-item -path $($_.FullName)
-destination "\\10.100.1.7\ForceField\$(Get-Date -f
yyyy-MM-dd_HHMMss)_$($_.name)" } }
2.5 Microsoft Azure Defender for IoT
Microsoft Azure Defender for IoT, based on technology acquired via CyberX, consists of a single appliance containing the sensor and application interface integrated into Build 4 to meet BAD, hardware modification, firmware modification, and software modification capabilities. The Microsoft Azure Defender for IoT implementation utilizes passive monitoring and protocol analysis to support cybersecurity monitoring and threat detection.
2.5.1 Host and Network Configuration
Microsoft Azure Defender for IoT was installed and configured to support the CRS environment as part of Build 4. The overall build architecture is provided in Figure B-4. The Microsoft Azure Defender for IoT specific components are in Table 2‑9.
Table 2‑9 Microsoft Azure Defender IoT Deployment
Name |
System |
OS |
CPU |
Memory |
Storage |
Network |
|---|---|---|---|---|---|---|
Azure Defender for IoT |
Dell OEMR XL R340 |
Ubuntu 18.04 |
Intel Xeon E-2144G |
32 GB |
3x 2 TB Drives RA ID-5 |
Testbed LAN 10.100.0.61 |
2.5.2 Installation
The Microsoft Azure Defender for IoT (Version 10.0.3) appliance was preinstalled with the operating system and application. The appliance is mounted in a rack with power and network interfaces connected to the Testbed LAN on the Eth0 port along with the SPAN connection on the expansion network interface board.
2.5.3 Configuration
To configure the Microsoft Azure Defender for IoT platform, follow these steps:
Set the Network Configuration:
Using either SSH, iDRAC, or the KVM Console connections on the appliance, establish shell access to the appliance.
From the console, enter the following command:
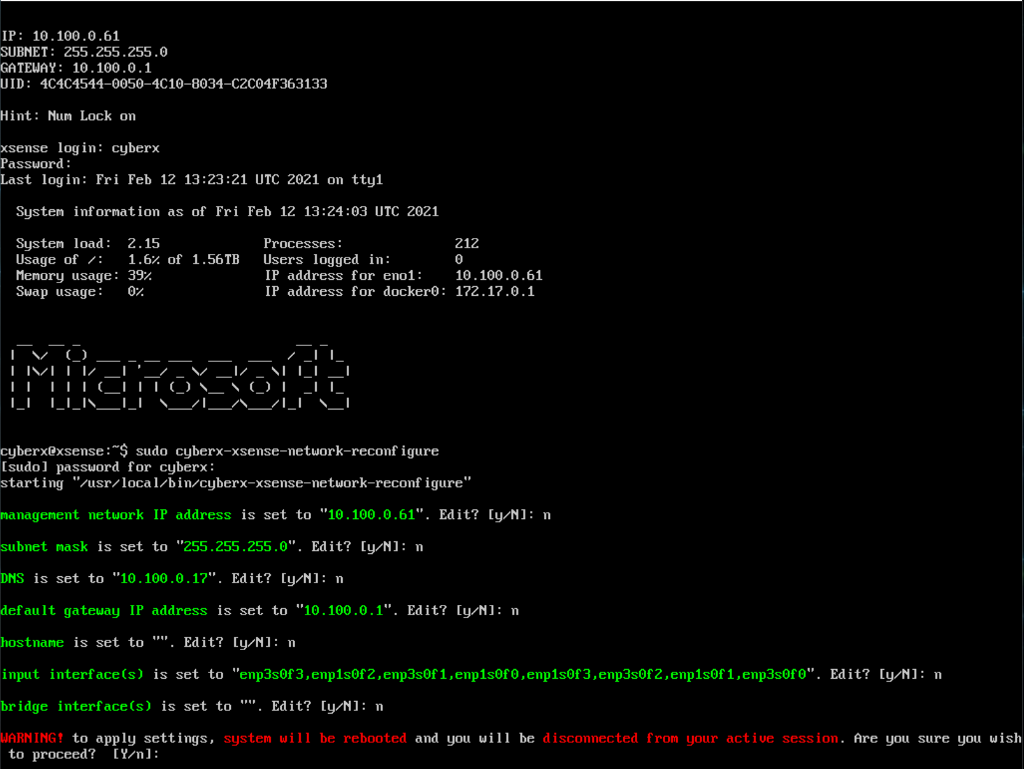
$sudo cyberx-xsense-network-reconfigure
The system will walk through a series of network options (Figure 2‑25) that are set as follows:
IP Address: “10.100.0.61”
Subnet Mask: “255.255.255.0”
DNS: “10.100.0.17”
Default Gateway: “10.100.0.1”
Hostname: Not set
Input Interface(s): “enp3s0f3, enp1s0f2, enp3s0f1, enp1s0f0, enp1s0f3, enp3s0f2, enp1s0f1, enp3s0f0”
Bridge Interface(s): Not Set
Figure 2‑25 Azure Defender for IoT SSH Session for Network Configuration
Create AMS Protocol report as a data mining tool:
Login to the application web interface and click Data Mining in the left menu navigation.
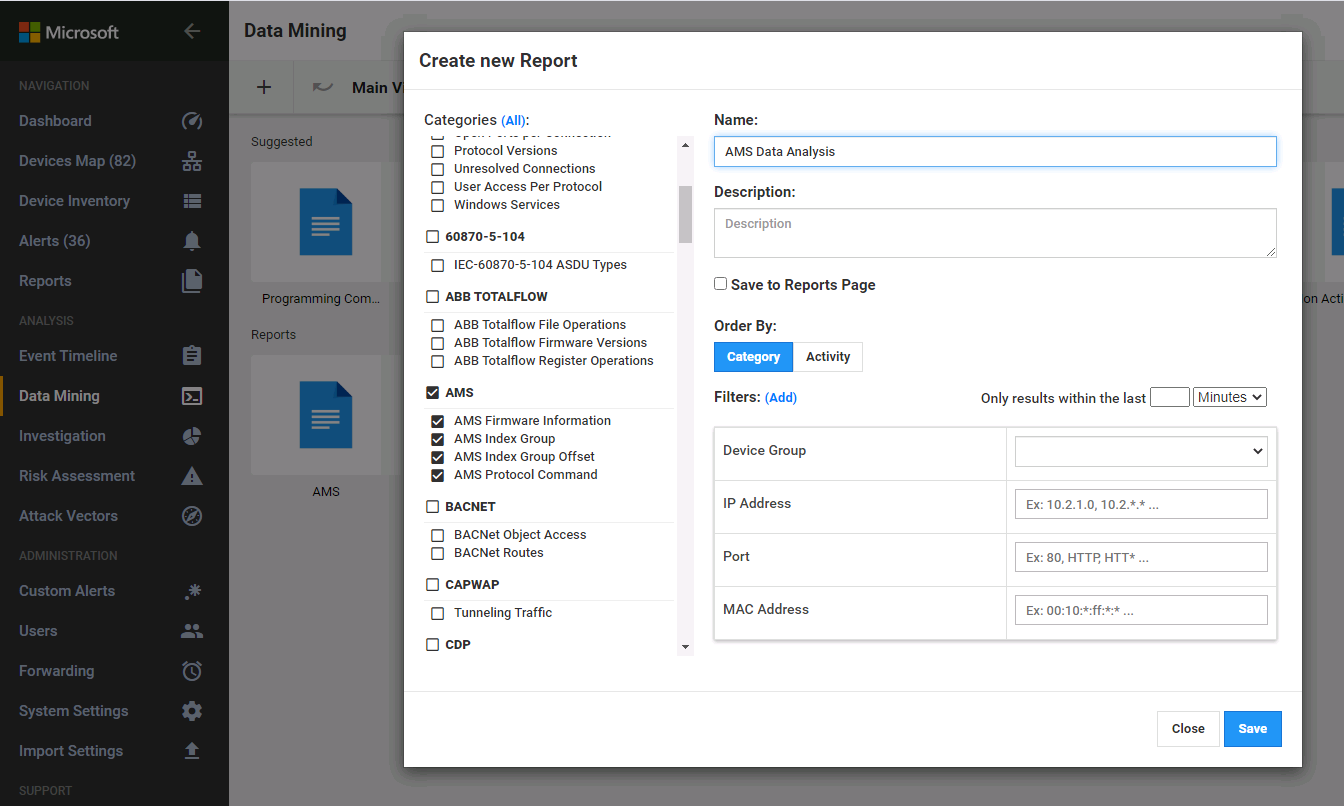
Click the + sign and click New Report. In the Create New Report panel set the following settings (Figure 2‑26):
Under Categories select AMS to automatically select the sub-elements, including:
1) AMS Firmware Information2) AMS Index Group3) AMS Index Group Offset4) AMS Protocol CommandEnter “AMS Data Analysis” as the name for the report.
Click Save.
Figure 2‑26 Azure Defender for IoT Create New Data Mining Report for AMS Protocol Information
Create AMS – Custom Alert Rules
For this effort, the CRS PLC is configured to run using firmware version 3.1.4022 as the approved production firmware version. To detect changes to the approved version, custom alert rules are created to monitor for deviations from the approved version numbers through the AMS protocol messages over the network.
Click Horizon on the left menu navigation.
Select AMS > Horizon Customer Alert under the Plugin Options on the left menu.
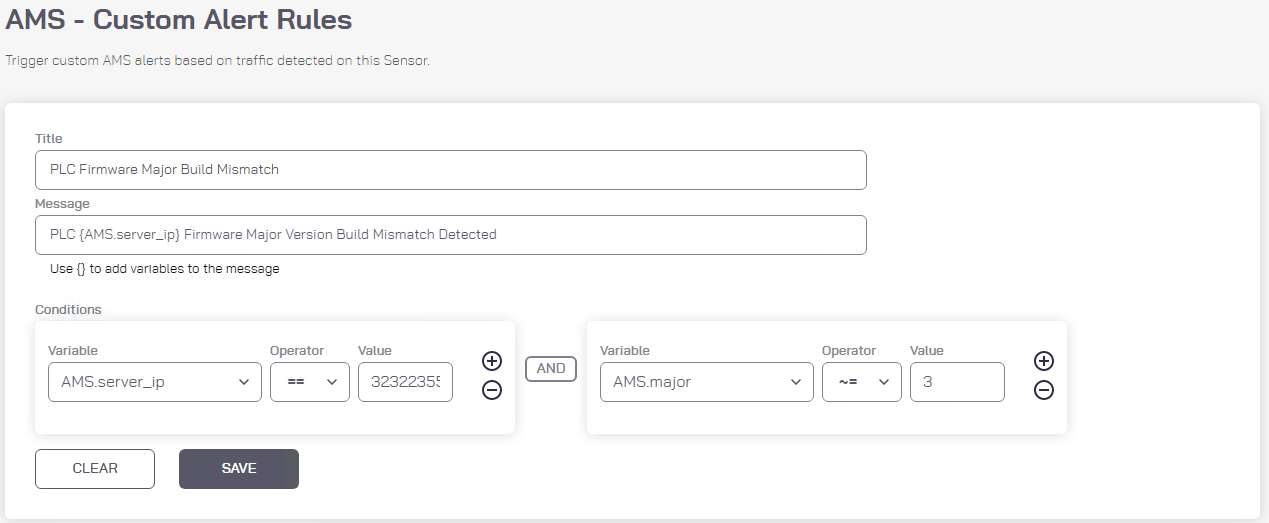
Create Custom Alert to Detect Change in PLC Firmware Major Build Number (Figure 2‑27):
Enter “PLC Firmware Major Build Mismatch” as the title for the custom alert.
Enter “PLC {AMS_server_ip} Firmware Major Version Build Mismatch Detected” as the message to display with the alert.
Set the following conditions:
1) AMS_server_ip == 3232235550 (Note: this isthe PLC IP address 192.168.0.30 in Integer format).2) AND AMS_major ~= 3
Figure 2‑27 Azure Defender for IoT Custom Alert for Firmware Major Version Number Change
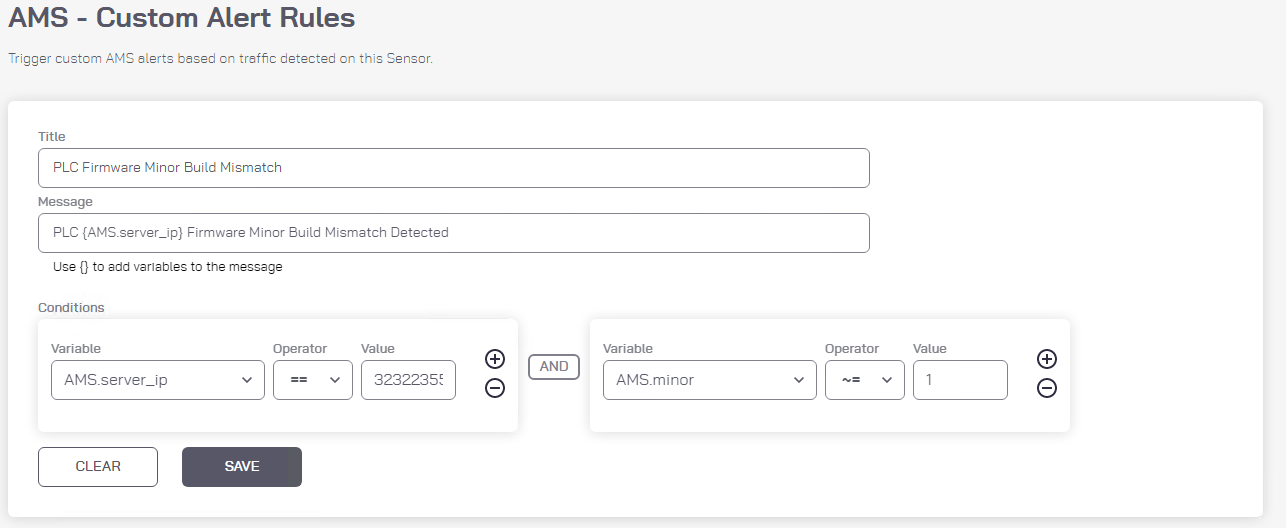
Create the custom alert to detect change in PLC firmware minor build number (Figure 2‑28):
Enter “PLC Firmware Minor Build Mismatch” as the title for the custom alert. PLC Firmware Minor Build Mismatch
Enter “PLC {AMS_server_ip} Firmware Minor Version Build Mismatch Detected” as the message to display with the alert.
Set the following conditions:
1) AMS_server_ip == 3232235550 (Note: this is thePLC IP address 192.168.0.30 in Integer format).2) AND AMS_minor ~= 1
Figure 2‑28 Azure Defender for IoT Custom Alert for Firmware Minor Version Number Change
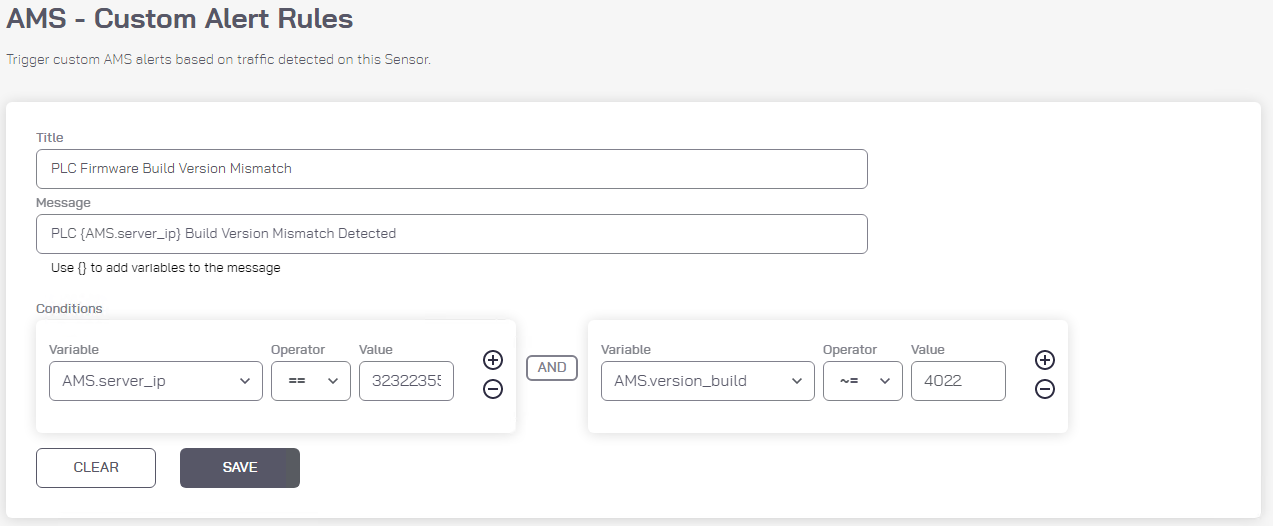
Create the custom alert to detect change in the PLC Firmware Build Version (Figure 2‑29):
Enter “PLC Firmware Build Version Mismatch” as the Title for the custom alert.
Enter “PLC {AMS_server_ip} Build Version Mismatch Detected” as the message to display with the alert:
Set the following conditions:
1) AMS_server_ip == 3232235550 (Note: this isthe PLC IP address 192.168.0.30 in Integer format).2) AND AMS_version_build ~= 4022
Figure 2‑29 Azure Defender for IoT Custom Alert for Firmware Build ersion Number Change
2.6 OSIsoft PI Data Archive
The OSIsoft product included in this practice guide is Process Information (PI), which is used to collect, store, analyze, and visualize testbed data. The product was utilized in Builds 1, 2, 3, and 4 to meet the historian capability by collecting and storing testbed data and the BAD capability by alerting when activity deviates from a baseline.
OSIsoft PI is a suite of software applications for capturing, analyzing, and storing real-time data for industrial processes. Although the PI System is typically utilized as a process historian, the PI System is also utilized to collect, store, and manage data in real time. Interface nodes retrieve data from disparate sources to the PI Server, where the PI Data Archive resides. Data is stored in the data archive and is accessible in the assets defined in the Asset Framework (AF). Data is accessed either directly from the data archive or from the AF Server by using tools in the PI visualization suite.
2.6.1 Host and Network Configuration
PI was installed on virtual machines hosted on hypervisors located in the DMZ and CRS networks. The virtual machine details and resources are provided in Table 2‑10, Table 2‑11 and, Table 2‑12. The overall build architectures utilizing PI are described in Section 4.5 in Volume B.
Table 2‑10 OSIsoft PI Domain Hosts Deployment
Name |
System |
OS |
CPU |
Memory |
Storage |
Network |
|---|---|---|---|---|---|---|
DMZ Historian |
Virtual Machine |
Microsoft Windows Server 2016 |
4x Intel Xeon E3-1240 |
8 GB |
Boot: 80 GB PI Data: 170 GB |
DMZ 10.100.1.4 |
Table 2‑11 OSIsoft PI CRS Hosts Deployment
Name |
System |
OS |
CPU |
Memory |
Storage |
Network |
|---|---|---|---|---|---|---|
CRS Local Historian |
Virtual Machine |
Microsoft Windows Server 2016 |
4x Intel Xeon E5-2407 |
16 GB |
Boot: 80 GB PI Data: 170 GB |
CRS Supervisory LAN 192.168.0.21 |
Table 2‑12 OSIsoft PI PCS Hosts Deployment
Name |
System |
OS |
CPU |
Memory |
Storage |
Network |
|---|---|---|---|---|---|---|
PCS Local Historian |
Virtual Machine |
Microsoft Windows Server 2008 R2 |
1x Intel i5-4590 |
2 GB |
50 GB |
PCS VLAN 2 172.16.2.14 |
2.6.2 Installation
PI was previously installed in the testbed as part of the NISTIR 8219: Securing Manufacturing Industrial Control Systems: Behavioral Anomaly Detection, https://www.nccoe.nist.gov/sites/default/files/library/mf-ics-nistir-8219.pdf. The installation for this project involved upgrading the existing CRS Local Historian and DMZ Historian VMs to Microsoft Windows Server 2016, and subsequently upgrading all the PI software components. Step-by-step instructions for each PI component installation are not included for brevity. Detailed instructions provided by the vendor can be found on the OSIsoft Live Library: https://livelibrary.osisoft.com/.
DMZ Historian Server
The following software is installed on the DMZ Historian server:
Microsoft SQL Server 2019 Express 15.0.2080.9
PI Server 2018 (Data Archive Server, Asset Framework Server)
PI Server 2018 SP3 Patch 1
PI Interface Configuration Utility version 1.5.1.10
PI to PI Interface version 3.10.1.10
PI Interface for Ramp Soak Simulator Data 3.5.1.12
PI Interface for Random Simulator Data 3.5.1.10
PI Connector Relay version 2.6.0.0
PI Data Collection Manager version 2.6.0.0
PI Web API 2019 SP1 version 1.13.0.6518
CRS Local Historian Server (Collaborative Robotics System)
The following software is installed on the CRS Local Historian server:
Microsoft SQL Server 2019 Express 15.0.2080.9
PI Asset Framework Service 2017 R2 Update 1
PI Data Archive 2017 R2A
PI Server 2018 SP3 Patch 1
PI Interface Configuration Utility version 1.5.1.10
PI to PI Interface version 3.10.1.10
PI Interface for Ramp Soak Simulator Data 3.5.1.12
PI Interface for Random Simulator Data version 3.5.1.10
PI Interface for Performance Monitor version 2.2.0.38
PI Ping Interface version 2.1.2.49
PI Interface for Modbus ReadWrite version 4.3.1.24
PI Interface for SNMP ReadOnly version 1.7.0.37
PI TCP Response Interface version 1.3.0.47
PI Processbook 2015 R3 Patch 1 version 3.7.1.249
PI Vision 2019 Patch 1 version 3.4.1.10
PI System Connector version 2.2.0.1
PCS Local Historian (Process Control System Historian)
Rockwell FactoryTalk Historian SE version 1.00
2.6.3 Configuration
The following sections describe how to configure select PI components to enable the capabilities described in this guide. Configurations for the other PI components are not included for brevity.
2.6.3.1 PI to PI Interface (PCS)
The PCS uses the Rockwell FactoryTalk Historian to collect, store, and analyze historical process data. The PI to PI Interface is used to duplicate the process data to the DMZ Historian server. The following steps describe how to configure the PI-to-PI Interface to collect data from the Rockwell FactoryTalk Historian.
On the DMZ Historian server, launch the PI Interface Configuration Utility as shown in Figure 2‑30 from the Start menu and sign in with the local administrator account.
Figure 2‑30 Screenshot of the PI Interface Configuration Utility before the Interface is configured.
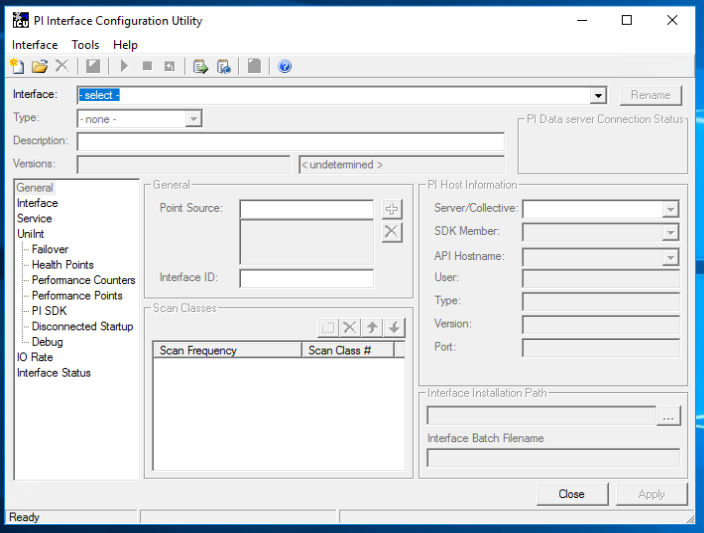
On the top menu, click Interface > New Windows Interface Instance from BAT File…
Navigate to E:\Program Files (x86)PIPCInterfacesPItoPI and select the file PItoPI.bat_new.
In the “Select Host PI Data server/collective” dialog box, select PI-DMZ from the drop-down menu and click OK.
In the left navigation panel select PItoPI. In the Source host textbox, enter “172.16.2.4”.
In the left navigation panel, select Service. In the “Create / Remove” section click the Create button. Click Yes in the dialog box.
Enter the commands
net startPItoPI andnet stop PItoPIin the files pisrvsitestart.bat and pisrvsitestop.bat files, respectively. Save and close the files.At the bottom of the PI Interface Configuration Utility click the Apply button. On top menu bar click the green play button
 to start the service.
Close the PI Interface Configuration Utility. The interface is now configured to pull tags from the Rockwell Historian.
2.6.3.2 PI System Connector (CRS)
The PI System Connector is used to duplicate process data on the DMZ Historian from the CRS Local Historian server. The following steps describe how to configure the PI-to-PI Interface to collect data from the OSIsoft PI Server.
Figure 2‑31 Screenshot of the PI Data Collection Manager Displaying Green Checkmarks After the PI System Connector is Properly Configured
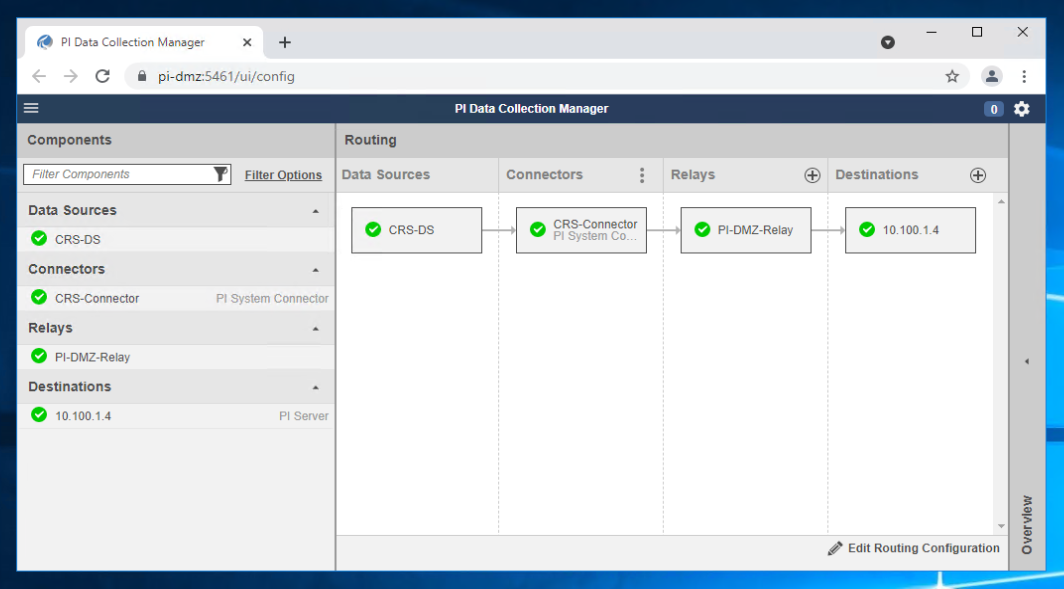
On the DMZ Historian server, launch the PI Data Collection Manager as shown in Figure 2‑31 from the Start menu and sign in with the local administrator account.
Click + on the Relays column to add a new connector relay. Use the following settings:
Name:
PI-DMZ-RelayAddress:
10.100.1.4Port:
5460
Username:
.\piconnrelay_svcClick Save Settings to add the connector relay.
Click + Add Destination to add the target PI Data Archive and PI AF Server. Use the following settings:
Name:
10.100.1.4PI Data Archive Address:
10.100.1.4AF Server:
10.100.1.4
Click Save Settings to add the destination.
On the CRS Local Historian server, open the PI System Connector Administration from the Start menu and sign in with the local administrator account.
Click Set up Connector to create a new connector.
Use the following information to request registration:
Registration Server Address: https:
//PI-DMZ:5460Registration Server Username:
piconnrelay_svcRegistration Server Password:
Description:
Registration to PI-DMZ
Click Request Registration to send the request to the DMZ Historian server.
On the DMZ Historian server, open the PI Data Collection Manager from the Start menu and sign in with the local administrator account.
Click Untitled Connector 1 and click Approve This Registration and Configure to approve the PI System Connector registration.
In the Untitled Connector 1 details panel, click Edit.
Use the following information to create the CRS-Connector connector:
Name:
CRS-ConnectorDescription:
Registration to PI-DMZ
Click Save Settings to create the CRS-Connector.
Click CRS-Connector in the Connectors column. On the Overview panel click CRS-Connector: No Data Sources option to create the data source.
On the CRS-Connector Connector Details in the Overview panel, click + Add Data Source.
In the Data Source Settings window, use the following settings:
Name:
CRS-DSSource AF Server:
PI-RoboticsSource AD Database:
TestbedDatabaseSelect Collect All Data from this Entire Database.
Click Save to save the data source.
Click 10.100.1.4 in the Destination column of the Routing panel and then click Data in the 10.100.1.4 Destination Details panel to configure the destination database for the CRS-Connector.
In the 10.100.1.4 Destination Details panel, change from Change Default Settings for new connectors to “CRS-Connector” and then click Edit Destination Data Settings.
In the 10.100.1.4 Destination Details of the Overview panel, use the following settings:
Change the connector to CRS-Connector.
Database:
CRS-backupClick on Elements and it will change <select a path using the tree below> to $Elements\
Use default settings in Root AF Elements and Point Names.
Create root Element CRS-Connector checkbox: Checked
Prefix Point CRS-Connector checkbox: Checked
Click Save Destination Data Settings to save the configuration.
Click the white space in the Routing panel.
Click CRS-Connector: No Relays in the Overview panel.
Select the PI-DMZ-Relay checkbox in the Routing panel.
Click the white space in the Routing panel again, then Click PI-DMZ-Relay: No Destination to add the routing between relays and destinations.
Select the 10.100.1.4 checkbox to add the routing between the relay and the destination.
Click Save Configuration.
In the Save Routing and Data Configuration window, select Save and Start All Components to continue.
Each box should now contain a green checkmark (i.e., Data Sources, Connectors, Relays, and Destinations). The elements in the AF database “testbeddatabase” on CRS Local Historian server is now replicated to AF database “CRS-backup” on the DMZ Historian server.
Finally, create a Windows firewall rule to open the inbound ports 5460, 5461, 5471, and 5472.
2.6.3.3 PI Asset Template Analysis Functions and Event Frames
Analysis functions and event frame templates were created to generate alerts in the PLC asset template when their respective anomalous events are detected. When an analysis function result is TRUE, an event frame is generated from the event frame template and ends when the analysis function result is FALSE or per a user-defined function. The following steps describe how the “Station Mode Error” analysis function and event frame template were created and used in Scenario 10.
On the CRS Local Historian server, open the PI System Explorer by navigating to Start Menu > PI System > PI System Explorer.
On the left navigation panel, select Library.
In the navigation tree in the Library panel, select Templates > Event Frame Templates.
Right click in the whitespace of the Element Templates window and select New Template.
Enter the following:
Name:
Station Mode ErrorDescription:
CRS Workcell machining station mode error
Naming Pattern:
ALARM-%ELEMENT%.%TEMPLATE%.%STARTTIME:yyyy-MM-dd
HH:mm:ss.fff%
In the navigation tree in the Library panel, select Templates > Element Templates > Machining_Station.
In the Machining_Station panel select the Analysis Templates tab and click Create a new analysis template.
Enter the name “Station Mode Error” in the Name textbox, enter a description of the analysis in the Description textbox, and select the option “Event Frame Generation” for the Analysis Type.
Select “Station Mode Error” in the Event Frame template drop-down menu.
In the Expression field for “StartTrigger1”, enter the expression:
'RawMode' < 0 OR 'RawMode' > 1;Click the Add… drop-down menu and select End Trigger, and enter the expression:
('RawMode' > 0 AND 'RawMode' < 1)Select the “Event-Triggered” option for the Scheduling type.
Click the Check In button on the top menu to save all changes to the database.
2.6.3.4 PI Web API
The PI Web API is used by Dragos to collect event frames from the DMZ Historian server. After completing installation of the PI Web API, the “Change PI Web API Installation Configuration” dialog displays. The following steps describe how to configure the Web API on the DMZ Historian server.
In the Telemetry section, verify the checkbox option and click Next.
In the Configuration Store section, select “PI-ROBOTICS” in the Asset Server drop-down menu and click Connect. Leave the default instance name.
In the Listen Port section, verify port 443 is entered in the Communication Port Number textbox and check the Yes, please create a firewall Exception for PI Web API checkbox.
In the Certificate section, click Next to continue and use the self-signed certificate or select Change to modify the certificate.
In the API Service section, leave the default service
NT
Service\piwebapi
and click Next.In the Crawler Service section, leave the default service
NT
Service\picrawler
and click Next.In the Submit URL section, enter the URL of the DMZ Historian server Web API service:
https://pi-dmz/piwebapi/.Click Next.In the Review Changes section, verify all the configuration settings, check the checkbox Accept all the configurations, and click Next.
Click Finish to complete the configuration.
2.6.3.5 Firmware Integrity Checking
Software was developed to demonstrate the ability of PI to obtain device and firmware data from a Beckhoff PLC for integrity checking purposes. A new PLC task was programmed to periodically query its operating system for hardware and software telemetry and make it available via Modbus TCP. PI will query these Modbus registers and use analysis functions to generate event frames if any tags do not match their expected values.
It is important to note that this capability was developed to demonstrate a method of maintaining visibility of PLC hardware and firmware version numbers for integrity purposes and is not secure or infallible. If a malicious actor takes control of the PLC, the hardware and firmware versions provided by the PLC can be spoofed.
The following steps describe how to sequentially configure this capability across multiple systems and software. Only one system or software is described in each section.
Beckhoff PLC Modbus TCP Server
The base Modbus TCP server configuration file only allows one PLC task to write to the registers. The following steps describe how to modify the configuration to allow two PLC tasks to write to the Modbus TCP server input registers.
Log in to the Windows CE Desktop of the Beckhoff PLC and open the XML file:
\TwinCAT\Functions\TF6250-Modbus-TCP\Server\TcModbusSrv.xmlModify the
<InputRegisters> ... </InputRegisters>section to the following:<InputRegisters> <MappingInfo> <AdsPort>851</AdsPort> <StartAddress>32768</StartAddress> <EndAddress>32895</EndAddress> <VarName>GVL.mb_Input_Registers</VarName> </MappingInfo> <MappingInfo> <AdsPort>852</AdsPort> <StartAddress>32896</StartAddress> <EndAddress>33023</EndAddress> <VarName>GVL.mb_Input_Registers</VarName> </MappingInfo> </InputRegisters>
Save and close the file.
Restart the PLC.
The Modbus TCP server will now have two register address ranges: 128 addresses for the PLC task at port 851, and 128 addresses for the PLC task at port 852.
Beckhoff PLC Project
A new PLC task must be created to perform the integrity checking and write the data to the Modbus TCP registers. The following steps describe how to create and configure the new task.
On the engineering workstation, open the TwinCAT XAE Shell by navigating to Start Menu > Beckhoff > TwinCAT XAE Shell and open the current PLC project.
In the Solution Explorer, right click PLC and select Add New Item…
In the Add New Item dialog box, select Standard PLC Project, enter the name
FirmwareIntegrityCheckin the Name textbox, and click Add.In the Solution Explorer, double click SYSTEM > Tasks > PLCTask1. Verify the Auto Start checkbox is checked and change the Cycle Ticks textbox to
100ms.In the Solution Explorer, right click PLC > FirmwareIntegrityCheck > References and click Add library… In the dialog box, select the library System > Tc2_System and click OK.
In the Solution Explorer, right click PLC > GVLs and click Add > Global Variable List. In the dialog box enter the name
GVLin the Name textbox and click Open.In the Editor Window, enter the following code:
VAR_GLOBAL
    mb_Input_Registers : ARRAY [0..127] OF WORD;
END_VAR
In the Solution Explorer, right click PLC > FirmwareIntegrityCheck > POU (Program Organizational Unit) and select Add > POU. In the Add POU dialog box, enter the name
GetSystemInfo, select the type Function Block, select the Implementation LanguageStructured Text (ST)and click Open.In the Editor Window, enter the following code in the Variables section:
// Gathers PLC information for system integrity checking
// (e.g., PLC serial number, TwinCAT version).
FUNCTION_BLOCK GetSystemInfo
VAR_INPUT
      NetId : T_AmsNetId; // AMS network ID of the PLC
END_VAR
VAR_OUTPUT
      HardwareSerialNo : WORD; // Serial number of PLC
      TwinCATVersion : WORD; // Version number of TwinCAT
      TwinCATRevision : WORD; // Revision number of TwinCAT
      TwinCATBuild : WORD; // Build number of TwinCAT
END_VAR
VAR
      DeviceData : FB_GetDeviceIdentification; //PLC data struct
      Timer : TON; // Timer to trigger the scan
      Period : TIME := T#5M; // Amount of time between each scan
      State : INT := 0; // Function block state
END_VAR
In the Editor Window, enter the following code in the Code section:
Table 1 Image of code snippet that was added to the Beckhoff PLC file.
Save and close the POU.
In the Solution Explorer, double click PLC > FirmwareIntegrityCheck > POUs > MAIN (PRG).
In the Editor Window, enter the following into the Variables section (your AMS net ID may differ from what is shown below):
PROGRAM MAIN
VAR
      PLCInfo : GetSystemInfo; // Periodically collects PLC data
      SelfNetId : T_AmsNetId := '5.23.219.8.1.1'; // Local address
END_VAR
In the Editor Window, enter the following into the Code section:
// Captures hardware serial numbers and TwinCAT version
// numbers from the PLC and shares them with other
// devices via Modbus TCP.
PLCInfo( NetId:=SelfNetId,
         HardwareSerialNo => GVL.mb_Input_Registers[0],
         TwinCATVersion => GVL.mb_Input_Registers[1],
         TwinCATRevision => GVL.mb_Input_Registers[2],
         TwinCATBuild => GVL.mb_Input_Registers[3]
       );
|
Save and close the POU.
In the top menu, select Build > Build Project. Once the build process completes select PLC > Login. In the TwinCAT PLC Control dialog box, select Login with download, verify the Update boot project checkbox is checked, and click OK. If the PLC code is not running after the download completes, select PLC > Start in the top menu.
The firmware integrity checking code is now running on the Beckhoff PLC. In the top menu select PLC > Logout and close the TwinCAT XAE Shell.
The PLC will now write the hardware serial number and firmware version numbers to the Modbus TCP server registers.
OSIsoft PI Points
The following steps describe how to create the PI points and tags in the CRS Local Historian server and duplicate the tags to the DMZ Historian server.
On the CRS Local Historian server, open the PI Interface Configuration Utility by navigating to Start > All Programs > PI System > PI Interface Configuration Utility.
In the Interface drop-down menu, select Modbus Interface (PIModbusE1).
Select the General menu option. In the Scan Classes section, click New Scan Class.
Set the Scan Frequency to “60” and the Scan Class # to the next sequential class number as shown in Figure 2‑32 below.
Figure 2‑32 Screenshot of the PI Interface Configuration Utility Showing the Added Scan Class # 2 for Polling the PLC Every 60 Seconds
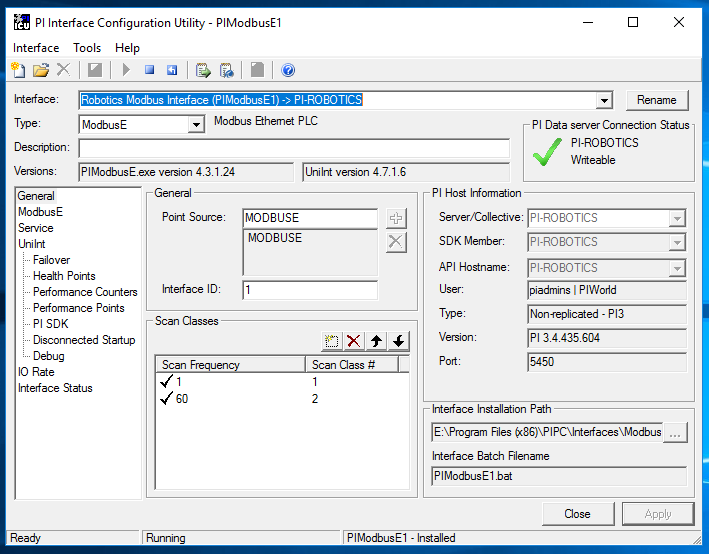
Click Apply and close the program.
On the CRS Local Historian server, open the PI System Management Tools by navigating to Start Menu > PI System > PI System Management Tools.
In the System Management Tool panel, select Points > Point Builder.
Create a new tag for the PLC hardware serial number with the following configuration:
Name:
PLC-HardwareSerialNumberServer:
PI-ROBOTICSDescriptor:
Hardware serial number of the CRS Beckhoff PLCPoint Source:
MODBUSEPoint Type:
Int16Location 1:
1Location 2:
0Location 3:
104Location 4:
2Location 5:
32897Instrument Tag:
192.168.0.30
Create a new tag for the PLC TwinCAT build number with the following configuration:
Name:
PLC-TwinCATBuildNumberServer:
PI-ROBOTICSDescriptor:
Build number of the CRS PLC TwinCAT firmware.Point Source:
MODBUSEPoint Type:
Int16Location 1:
1Location 2:
0Location 3:
104Location 4:
2Location 5:
32900Instrument Tag:
192.168.0.30
Create a new tag for the PLC TwinCAT revision number with the following configuration:
Name:
PLC-TwinCATRevisionNumberServer:
PI-ROBOTICSDescriptor:
Revision number of the CRS PLC TwinCAT firmware.Point Source:
MODBUSEPoint Type:
Int16Location 1:
1Location 2:
0Location 3:
104Location 4:
2Location 5:
32899Instrument Tag:
192.168.0.30
Create a new tag for the PLC TwinCAT version number with the following configuration as shown in Figure 2‑33:
Name:
PLC-TwinCATVersionNumberServer:
PI-ROBOTICSDescriptor:
Version number of the CRS PLC TwinCAT firmware.Point Source:
MODBUSEPoint Type:
Int16Location 1:
1Location 2:
0Location 3:
104Location 4:
2Location 5:
32898Instrument Tag:
192.168.0.30
Close the PI System Management Tools program. The PI points are now available to the DMZ Historian server via the PI System Connector.
Figure 2‑33 Screenshot of the PI System Management Tools Component After Configuring the PI Points for PLC Hardware and Firmware Version Number Integrity Checking
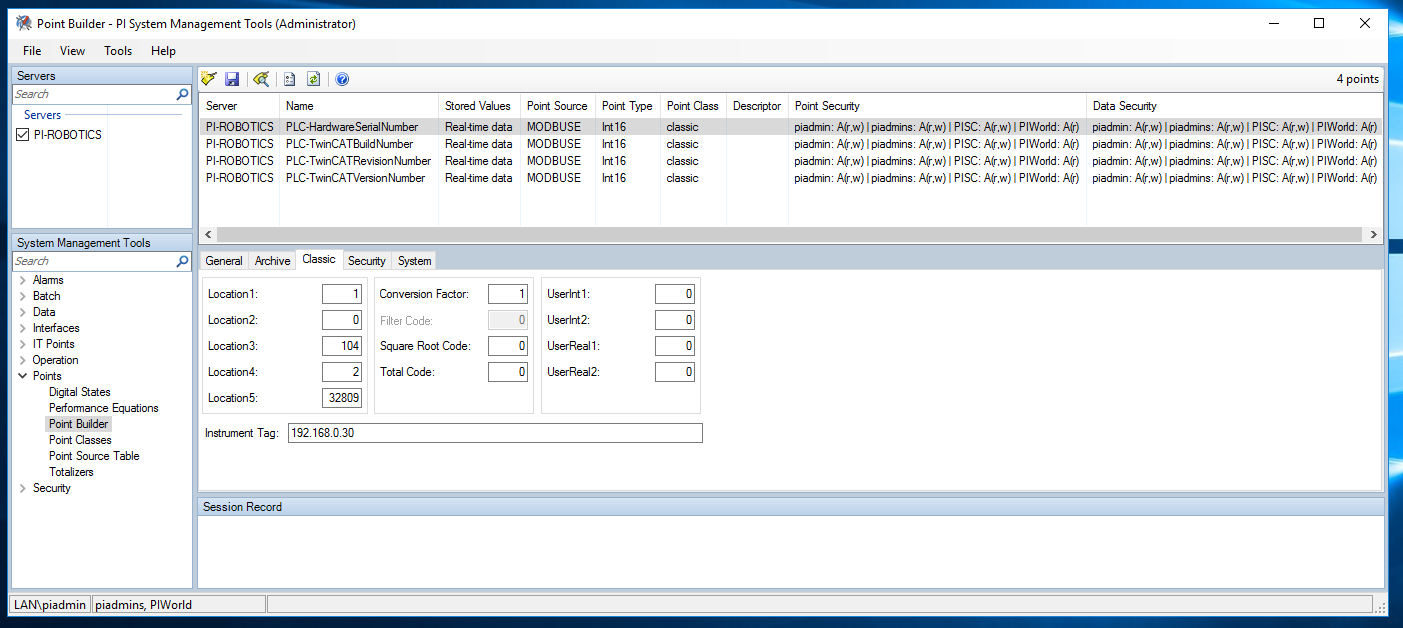
On the DMZ Historian server, open PI System Explorer by navigating to Start Menu > PI System > PI System Explorer.
On the left navigation panel, select Library.
In the navigation tree in the Library panel, select Templates > Element Templates > PLCTemplate.
Open the Attribute Templates tab in the PLCTemplate panel.
On the top menu bar, click New Attribute Template and create a new attribute for the PLC hardware serial number by entering the following configuration:
Name:
HardwareSerialNumberDescription:
Hardware serial number of the CRS Beckhoff PLC.Value Type:
Int16Data Reference:
PI PointTag:
\\PI-ROBOTICS\PLC-HardwareSerialNumber
On the top menu bar click New Attribute Template and create a new attribute for the expected hardware serial number by entering the following configuration:
Name:
HardwareSerialNumber-ExpectedDescription:
Expected hardware serial number of the CRS Beckhoff
PLC.
Value Type:
VData Reference:
None
On the top menu bar, click New Attribute Template and create a new attribute for the PLC TwinCAT build number by entering the following configuration:
Name:
TwinCATBuildNumberDescription:
Build number of the CRS PLC TwinCAT firmware.Value Type:
Int16Data Reference:
PI PointTag:
\\PI-ROBOTICS\PLC-TwinCATBuild
On the top menu bar, click New Attribute Template and create a new attribute for the PLC TwinCAT revision number by entering the following configuration:
Name:
TwinCATRevisionNumberDescription:
Revision number of the CRS PLC TwinCAT firmware.Value Type:
Int16Data Reference:
VTag:
\\PI-ROBOTICS\PLC-TwinCATRevision
On the top menu bar, click New Attribute Template and create a new attribute for the PLC TwinCAT version number by entering the following configuration:
Name:
TwinCATVersionNumberDescription:
Version number of the CRS PLC TwinCAT firmware.Value Type:
Int16Data Reference:
PI PointTag:
\\PI-ROBOTICS\PLC-TwinCATVersion
On the top menu bar, click New Attribute Template and create a new attribute for the string representation of the version, revision, and build numbers by entering the following configuration:
Name:
TwinCATVersionDescription:
Version number of the CRS PLC TwinCAT firmware.Value Type:
StringData Reference:
String BuilderString:
'TwinCATVersionNumber';.;'TwinCATRevisionNumber';.;'TwinCATBuildNumber';
On the top menu bar click, New Attribute Template and create a new attribute for the PLC expected TwinCAT version number by entering the following configuration as shown in Figure 2‑34:
Name:
TwinCATVersion-ExpectedDescription:
Expected version number of the CRS PLC TwinCAT
firmware.
Value Type:
StringData Reference:
None
The PI points are now available as PLC attributes in the Asset Framework on the DMZ Historian server.
Figure 2‑34 Screenshot of PI System Explorer Displaying some Attributes of the PLC Element. Attributes for the TwinCAT version number are visible in the list.
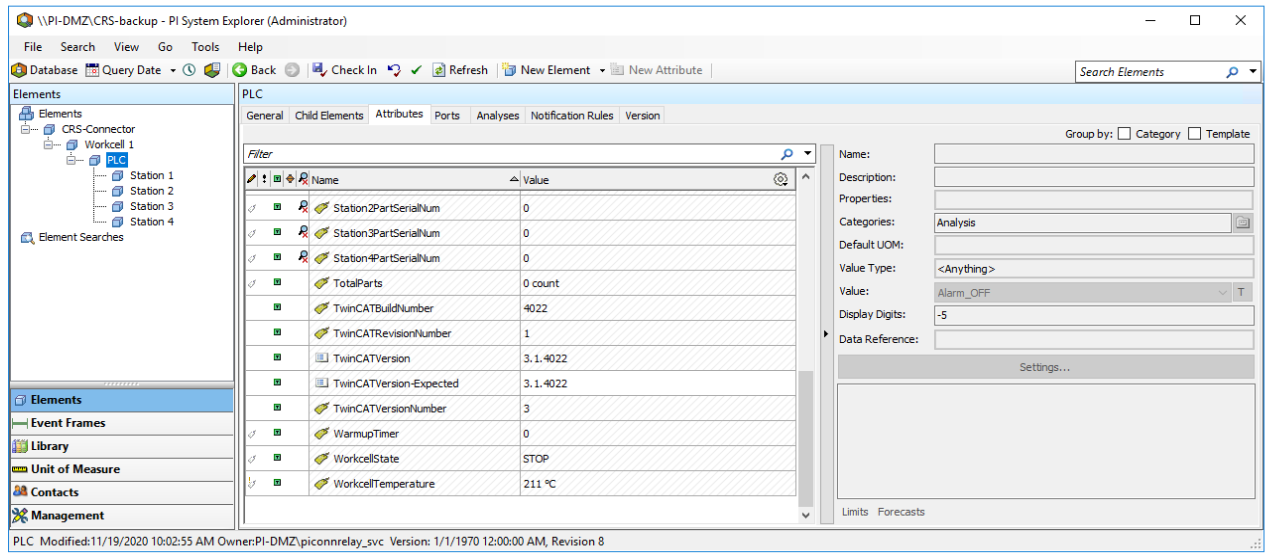
OSIsoft PI Analyses and Event Frames
The following steps describe how to create the PI analyses and event frame templates to generate event frames when the hardware or firmware version numbers do not match the expected values.
In the navigation tree in the Library panel, select Templates > Event Frame Templates.
On the top menu bar click New Template and enter the following configuration as shown in Figure 2‑35:
Name:
Hardware Serial Number MismatchNaming pattern:
%ELEMENT% %ANALYSIS% (Expected:
%@.\Elements[.]|HardwareSerialNumber-Expected%, Detected:
%@.\Elements[.]|HardwareSerialNumber%) %STARTTIME:yyyy-MM-dd
HH:mm:ss.fff%
Figure 2‑35 Screenshot of PI System Explorer Displaying the Hardware Serial Number Mismatch Event Frame Template.
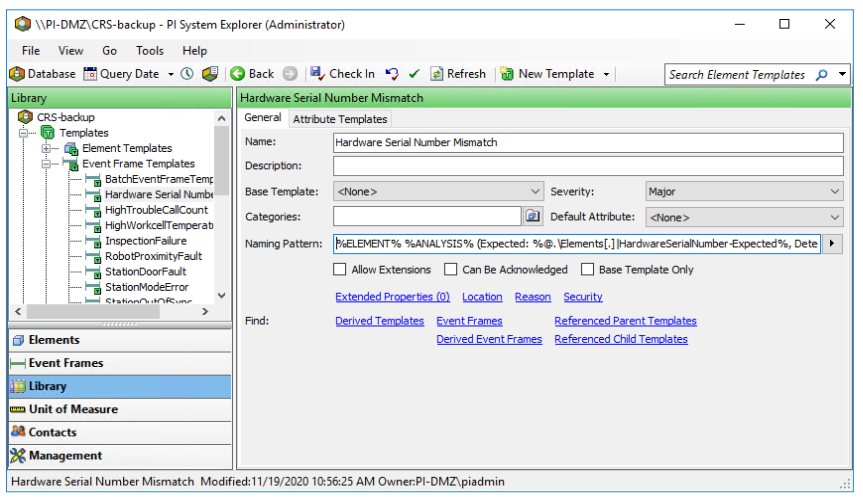
On the top menu bar, click New Template and enter the following configuration as shown in Figure 2‑36:
Name: TwinCAT Version Mismatch
Naming pattern:
%ELEMENT% %ANALYSIS% (Expected:
%@.\Elements[.]|TwinCATVersion-Expected%, Detected:
%@.\Elements[.]|TwinCATVersion%) %STARTTIME:yyyy-MM-dd
HH:mm:ss.fff%
Figure 2‑36 Screenshot of PI System Explorer Displaying the TwinCAT Version Mismatch Event Frame Template
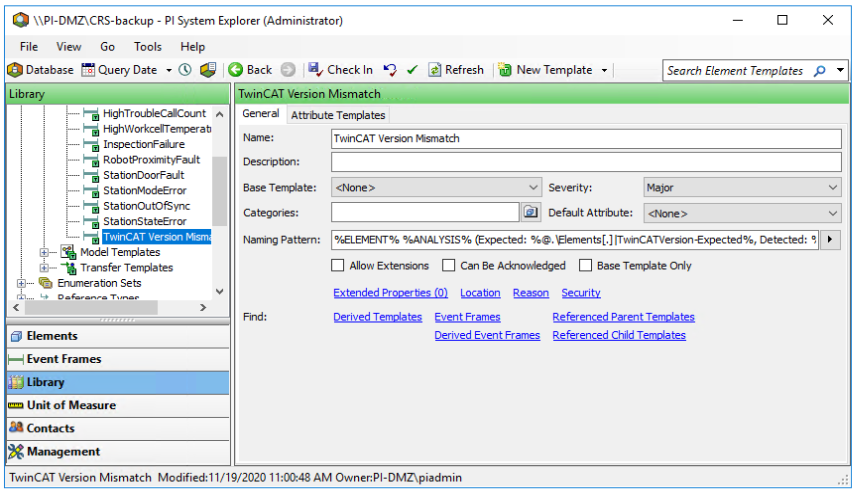
Click Check In on the top menu to save all changes to the database.
In the navigation tree in the Library panel, select Templates > Element Templates > PLCTemplate.
Open the Analysis Templates tab in the PLCTemplate panel and click Create a new analysis template.
Enter the following configuration as shown in Figure 2‑37:
Name:
Hardware Serial Number MismatchDescription:
The PLC hardware serial number does not match the
expected serial number.
Analysis Type:
Event Frame GenerationEnable analyses when created from template:
CheckedGeneration Mode:
Explicit TriggerEvent Frame Template:
Hardware Serial Number Mismatch
In the Expression field for “StartTrigger1”, enter the expression:
'HardwareSerialNumber'<>'HardwareSerialNumber-Expected' and NOT
BadVal('HardwareSerialNumber');
Click Add… drop-down menu and select End Trigger, and enter the expression:
'HardwareSerialNumber'='HardwareSerialNumber-Expected';Select the “Event-Triggered” option for the Scheduling type and “Any Input” for the Trigger On drop-down menu.
Figure 2‑37 Screenshot of PI System Explorer Displaying the Hardware Serial Number Mismatch Analysis Template in the PLC Element Template
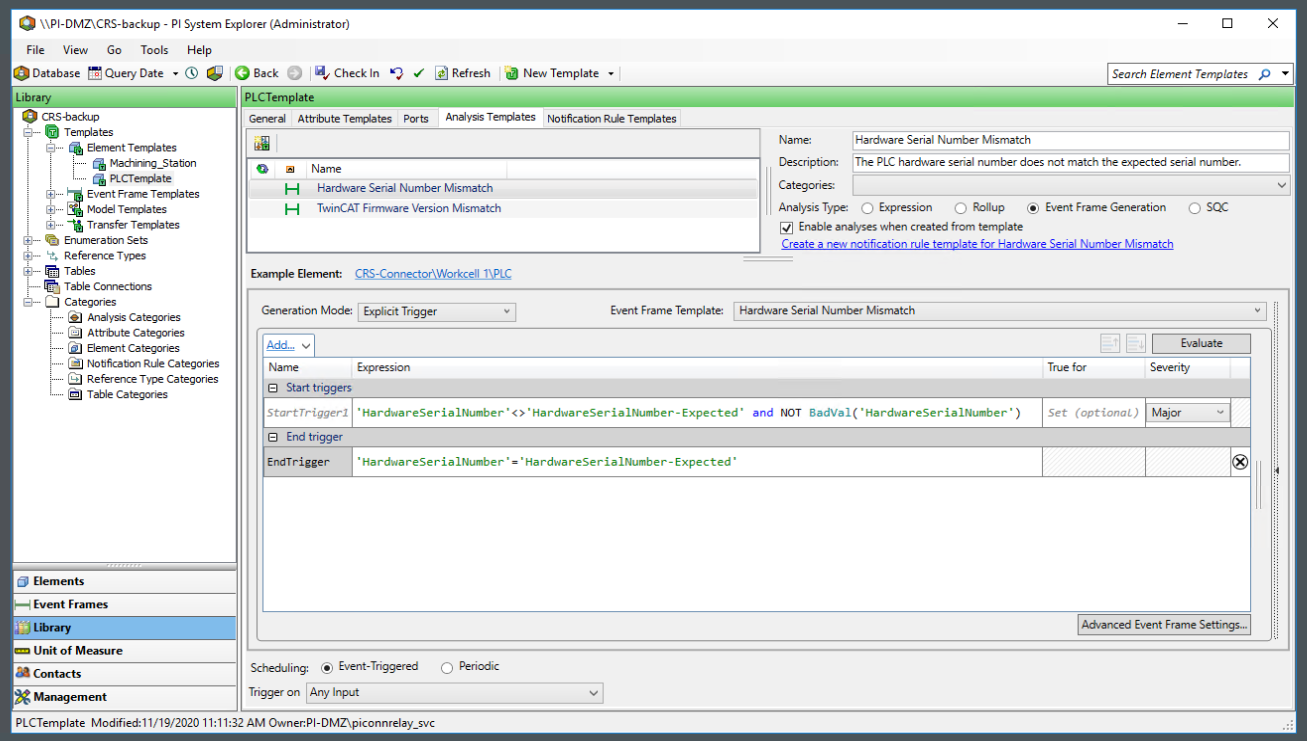
To create a new analysis template for TwinCAT firmware version mismatch, click Create a new analysis template.
Enter the following configuration as shown in Figure 2‑38:
Name:
TwinCAT Firmware Version MismatchDescription:
The TwinCAT version installed in the PLC does not
match the expected version.
Analysis Type:
Event Frame GenerationEnable analyses when created from template:
CheckedGeneration Mode:
Explicit TriggerEvent Frame Template:
Hardware Serial Number Mismatch
In the Expression field for “StartTrigger1”, enter the expression:
not Compare('TwinCATVersion','TwinCATVersion-Expected') and NOT
BadVal('TwinCATVersion');
Click the Add… drop-down menu and select End Trigger, and enter the expression:
Compare('TwinCATVersion','TwinCATVersion-Expected');Select the “Event-Triggered” option for the Scheduling type and “Any Input” from the Trigger On drop-down menu.
Figure 2‑38 Screenshot of PI System Explorer Displaying the TwinCAT Firmware Version Mismatch Analysis Template in the PLC Element Template
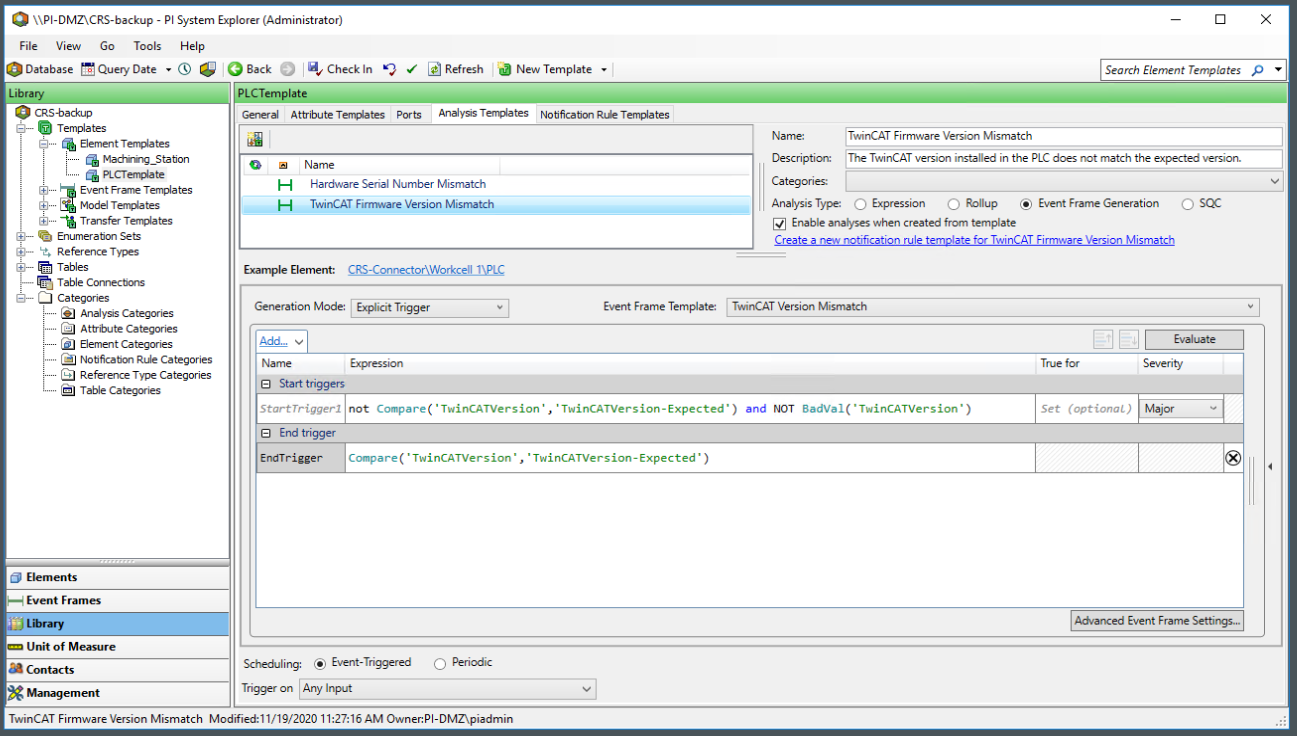
On the top menu bar click Check In , verify the changes in the dialog box and click Check In.
On the left navigation panel, select Elements.
In the navigation tree in the Elements panel, select CRS-Connector > Workcell 1 > PLC.
Open the Attributes tab in the PLC panel.
Select the attribute HardwareSerialNumber-Expected and enter the expected hardware serial number (e.g., 5870) in the Value textbox.
Select the attribute TwinCATVersion-Expected and enter the expected hardware serial number (e.g., 3.1.4022) in the Value textbox.
On the top menu bar and click Check In, verify the changes in the dialog box, and click Check In.
Event frames will now be generated in the DMZ Historian if the PLC reports a hardware serial number that does not match the expected value or if the TwinCAT firmware version number does not match the expected value.
2.7 Security Onion
Security Onion is a Linux-based, open source security playbook. It includes numerous security tools for intrusion detection, log management, incident response, and file integrity monitoring. For this project, the tool Wazuh was used in Builds 2 and 4 for file integrity checking. Wazuh works at the host-level to detect unusual and unauthorized activity and changes to file and software configurations. Security Onion and Wazuh use Elastic Stack components, Elasticsearch, Filebeat, and Kibana to store, search, and display alert data.
Note: Wazuh is a fork of the open source project OSSEC, a host-based intrusion detection system. In some places in Wazuh and this document, the term OSSEC will be used in place of Wazuh.
2.7.1 Host and Network Configuration
Wazuh is an agent-based software. For this project, an existing Security Onion server was used, and the Wazuh agent was installed on multiple endpoints in both the PCS and CRS environments. The tables below list the network configuration for the Security Onion server (Table 2‑13) and the hosts (Table 2‑14 and Table 2‑15) with the installed agent.
Table 2‑13 Security Onion Domain Hosts Deployment
Name |
System |
OS |
CPU |
Memory |
Storage |
Network |
|---|---|---|---|---|---|---|
Security Onion Server |
Hyper-V VM |
Ubuntu 16.04 LTS |
4 |
16GB |
450GB |
Testbed LAN 10.100.0.26 |
Nessus VM |
Hyper-V VM |
Windows 2012R2 |
2 |
6GB |
65GB |
Testbed LAN 10.100.0.25 |
Dispel VDI |
Hyper-V VM |
Windows 2016 |
2 |
8GB |
126GB |
DMZ LAN 10.100.1.61 |
DMZ Historian |
Hyper-V VM |
Windows 2016 |
4 |
8GB |
80GB/171GB |
DMZ LAN 10.100.1.4 |
Table 2‑14 Security Onion PCS Hosts Deployment
Name |
System |
OS |
CPU |
Memory |
Storage |
Network |
|---|---|---|---|---|---|---|
PCS Engineering Workstation |
HP Z230 Tower PC |
Windows 7 |
4 |
16GB |
465GB |
PCS LAN 3 172.16.3.10 |
PCS HMI Host |
Supermicro Z97X-Ud5H |
Windows 7 |
4 |
8GB |
600GB |
PCS LAN 1 172.16.1.4 |
Table 2‑15 Security Onion CRS Hosts Deployment
Name |
System |
OS |
CPU |
Memory |
Storage |
Network |
|---|---|---|---|---|---|---|
CRS Engineering Workstation |
Dell Precision T5610 |
Windows 10 |
8 |
16GB |
465GB |
CRS Supervisory 192.168.0.20 |
2.7.2 Installation
Security Onion Server version 3.9 and Wazuh Agent version 3.9 were used.
Installation of Wazuh involves setting up the central server and installing agents on hosts that needed to be monitored.
Security Onion server contains the Wazuh manager and API components as well as the Elastic Stack. The Wazuh manager is responsible for collecting and analyzing data from deployed agents. The Elastic Stack is used for reading, parsing, indexing, and storing alert data generated by the Wazuh manager.
The Wazuh agent, which runs on the monitored host, is responsible for collecting system log and configuration data and detecting intrusions and anomalies. The collected data is then forwarded to the Wazuh manager for further analysis.
The Security Onion server was already a part of the lab infrastructure prior to this effort. For the server component installation process, please follow the guidance from the Security Onion Installation Guide for version 3.9 available at https://documentation.wazuh.com/3.9/installation-guide/index.html.
For information on adding agents to the server, please follow the guidance from the Security Onion Installation Guide for version 3.9 available at https://documentation.wazuh.com/3.9/user-manual/registering/index.html.
2.7.3 Configuration
Configure Additional Directories or Files for Wazuh Agent File Integrity Monitoring:
Files and directories to be monitored are specified in the ossec.conf file on each host.
To view or edit this file, click the View tab in the Wazuh Configuration Manager on the host machine and select View Config as shown in Figure 2‑39.
Figure 2‑39 Wazuh Agent Manager
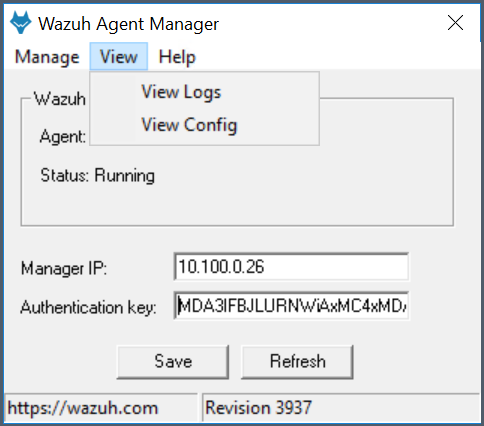
Selecting View>View Config opens the ossec.conf file in Notepad. Alternatively, the file can be opened in Notepad from its location in the “C:Program Files (x86)ossec-agent” directory on the host machine, as shown in Figure 2‑40.
Figure 2‑40 ossec.conf File
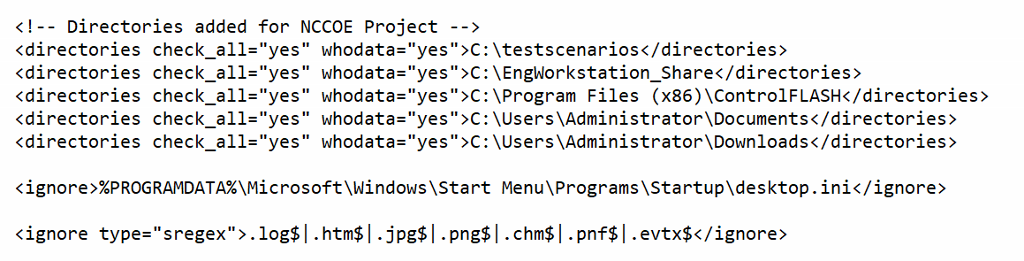
To add files or directories to the default configuration, copy and modify an existing line in the ossec.conf file to ensure the proper XML syntax is used.
Once the changes are made, save the ossec.conf file and restart the Wazuh Agent by opening the Configuration Manager, selecting the Manage tab, and Restart as shown in Figure 2‑41.
Figure 2‑41 Wazuh Agent Manager User Interface
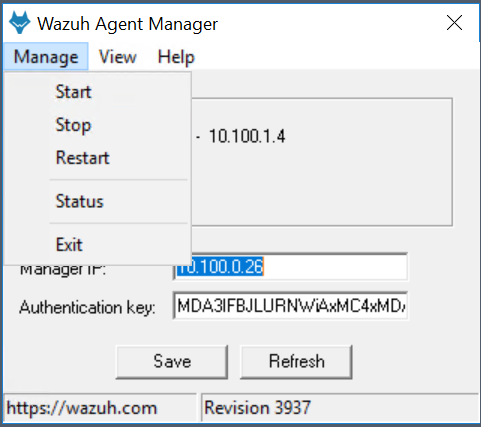
Changes to the files or directories specified in the ossec.conf file will be detected and sent to the Wazuh Manager. Figure 2‑42 shows the log received after a file change was detected.
Figure 2‑42 Log Received After a File Change Was Detected
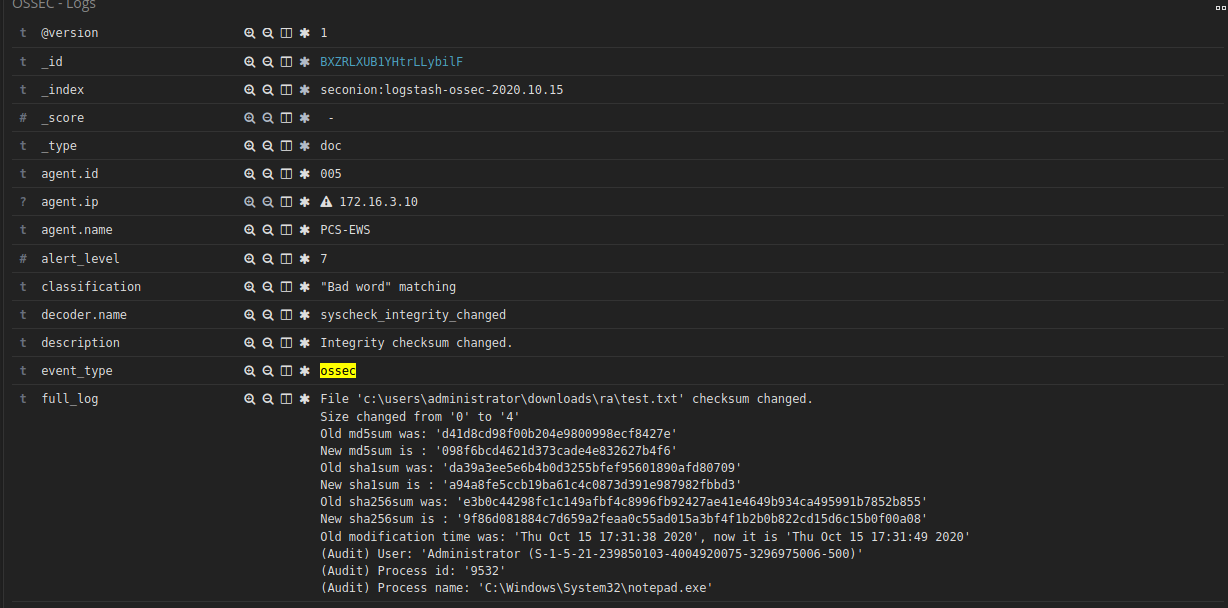
2.8 TDi ConsoleWorks
The TDi ConsoleWorks implementation in Builds 1 and 3 consists of a single VM hosted on VMWare ESXi to meet the user authentication and authorization capabilities. ConsoleWorks provides a secure web interface through which authenticated and authorized users receive access to graphical and shell interfaces on configured ICS components.
2.8.1 Host and Network Configuration
ConsoleWorks resides on a VM that was reconfigured for supporting Builds 1 and 3 as described in Table 2‑16 and Table 2‑17 respectively.
Table 2‑16 ConsoleWorks Build 1 Deployment
Name |
System |
OS |
CPU |
Memory |
Storage |
Network |
|---|---|---|---|---|---|---|
ConsoleWorks |
VMWare VM |
CentOS 7 |
8x vCPU |
8GB |
500 GB 750 GB |
Testbed LAN 10.100.0.53 |
Table 2‑17 ConsoleWorks Build 3 Deployment
Name |
System |
OS |
CPU |
Memory |
Storage |
Network |
|---|---|---|---|---|---|---|
ConsoleWorks |
VMWare VM |
CentOS 7 |
8x vCPU |
8GB |
500 GB 750 GB |
CRS 192.168.0.65 |
2.8.2 Installation
ConsoleWorks version 5.3-1u3 is installed on a CentOS 7 operating system using the following procedures. Product installation guides and documentation are available at https://support.tditechnologies.com/product-documentation. Follow these steps for installation:
Harden and configure the operating system:
Log in to the system with privileged access and set the Static IP Address information by editing /etc/sysconfig/network-scripts/ifcfg-eth0 using the following settings:
For Build 1 use the following network configuration:
1) IP Address: 10.100.0.532) Subnet Mask: 255.255.255.03) Gateway: 10.100.0.14) DNS: 10.100.0.17For Build 3 use the following network configuration:
1) IP Address: 192.168.0.652) Subnet Mask: 255.255.255.03) Gateway: 192.168.0.24) DNS: 10.100.0.17Restart the network service as follows:
# systemctl restart network
Set the NTP Configuration as follows:
In /etc/ntp.conf, add as the first server entry:
server 10.100.0.15
Apply the following Department of Defense (DOD) Security Technology Implementation Guide (STIG) settings:
Ensure ypserv is not installed using the following command:
# yum remove ypservEnsure Trivial File Transfer Protocol (TFTP) is not installed using the following command:
# yum remove tftp-serverEnsure RSH-SERVER is not installed using the following command:
# yum remove rsh-serverEnsure File Transfer Protocol (FTP) is not installed using the following command:
# yum remove vsftpdEnsure TELNET-SERVER is not installed using the following command:
# yum remove telnet-serverConfigure SSH to use SSHv2 only.
1) To disable SSHv1, ensure only Protocol 2 is allowed in the/etc/ssh/sshd_config.Protocol 2 PermitRootLogin no Ciphers aes128-ctr, aes192-ctr, aes256-ctr, aes128-cbc MACs hmac-sha2
Disallow authentication using an empty password as follows:
1) Add PermitEmptyPasswords no to /etc/ssh/sshd_config file.2) Remove any instances of the nullok option in/etc/pam.d/system-auth and /etc/pam.d/password-auth files.Enable FIPS Mode as follows:
1) FIPS mode can be enabled by running the command:# yum install dracut# dracut -f2) When step 1) is complete, add fips=1 to the /etc/default/grubfile and run the command:# grub2-mkconfig -o /boot/efi/EFI/redhat/grub.cfg3) When step 2) completes, reboot the server with this command:# rebootEnable server auditing
1) Ensure events on the server are being recorded for investigationin the event of an outage or attack. This can be enabled byrunning the command:# systemctl start auditd.service.Configure system to only install approved digitally signed packages:
1) Configure yum to verify the Certificate Authority is from anapproved organization. To enable this, ensure that gpgcheck=1is in the /etc/yum.conf file.Enable the firewall:
1) To enable the firewall, run the following commands:# yum install firewalld and# systemctl start firewalld.2) Check Firewall Zone and confirm only SSH and HTTPS is allowed. Note:the default zone is Public and SSH is already permitted. For theimplementation, we checked the configuration using the followingcommand:# firewall-cmd --list-all3) Add the HTTPS configuration to the firewall using the followingcommand:# firewall-cmd --zone=public --permanent --add-service=httpsEnable SELinux and set to “targeted”:
1) Add SELINUX=enforcing and SELINUXTYPE=targeted in the/etc/selinux/config file and then reboot the server with thiscommand:# rebootEnable Antivirus as follows:
1) ClamAV is used for the lab implementation using the followingcommands adapted from information found on# yum install -y epel-release# yum -y install clamav-server clamav-data clamav-update clamav-filesystem clamav clamav-scanner-systemd clamav-devel clamav-lib clamav-server-systemd
2) Update SELinux policy to allow ClamAV to function# setsebool -P antivirus_can_scan_system 13) Make a backup copy of the scan.conf file and update to remove theExample string from the file using these commands:# cp /etc/clamd.d/scan.conf /etc/clamd.d/scan.conf.bk# sed -i '/^Example/d' /etc/clamd.d/scan.conf4) Uncomment the following line from /etc/clamd.d/scan.conf:LocalSocket /var/run/clamd.scan/clamd.sock5) Configure freshclam to automatically download updated virusdefinitions using these commands:# cp /etc/freshclam.conf /etc/freshclam.conf.bak# sed -i -e "s/^Example/#Example/" /etc/freshclam.conf6) Manually run freshclam to confirm the settings as follows:# freshclam7) Start and enable the clamd service with these commands:# systemctl start clamd@scan# systemctl enable clamd@scan8) Ensure log directory is available with this command:# mkdir /var/log/clamav9) Create the daily scan script to scan directories of interest. Note:for the lab implementation only the /home volume was selected forscanning.# vi /etc/cron.daily/clamav_scan.sh File Contents #!/bin/bash SCAN_DIR="/home" LOG_FILE="/var/log/clamav/dailyscan.log" /usr/bin/clamscan -ri $SCAN_DIR >> $LOG_FILE
10) Set the file to have execute privilege with this command:# chmod +x /etc/cron.daily/clamav_scan.sh
Download and Install the ConsoleWorks packages
Login to TDi Technology Support Portal (https://support.tditechnologies.com/get_consoleworks) to download the ConsoleWorks for Linux 5.3-1u3 installation package. Credentials will be provided by TDi.
After downloading the ConsoleWorks installation package, copy it to the ConsoleWorks VM using a Secure Copy (scp) utility.
Follow the procedures from TDi ConsolWorks New Installation and Upgrade Guide for Linux Chapter 3: Automated New Installation of ConsoleWorks
During installation, create a New Invocation named “NCCOE”.
Create a new certificate.
Set the system to automatically start the ConsoleWorks Invocation.
Login to the platform and initiate the offline registration process (Figure 2‑43).
Once the license file is obtained, complete the registration process (Figure 2‑44).
Figure 2‑43 ConsoleWorks Registration Screen
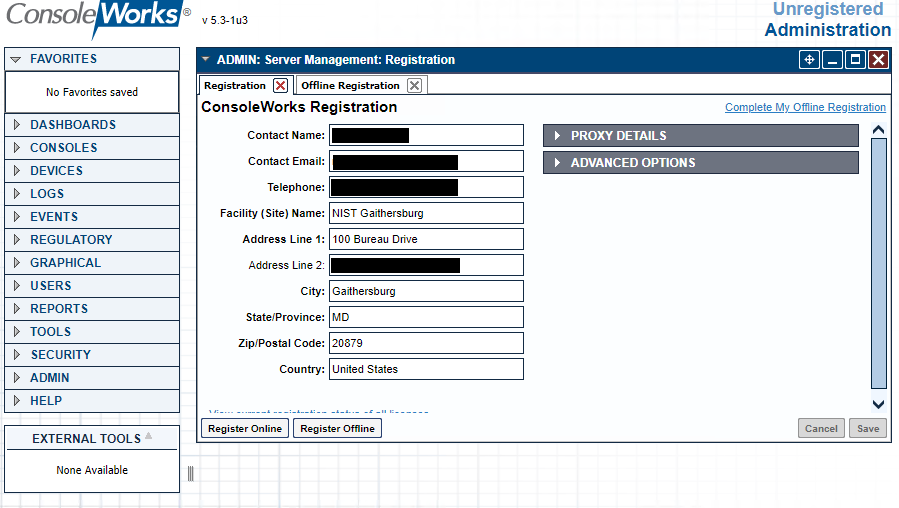
Figure 2‑44 ConsoleWorks Offline Registration Process
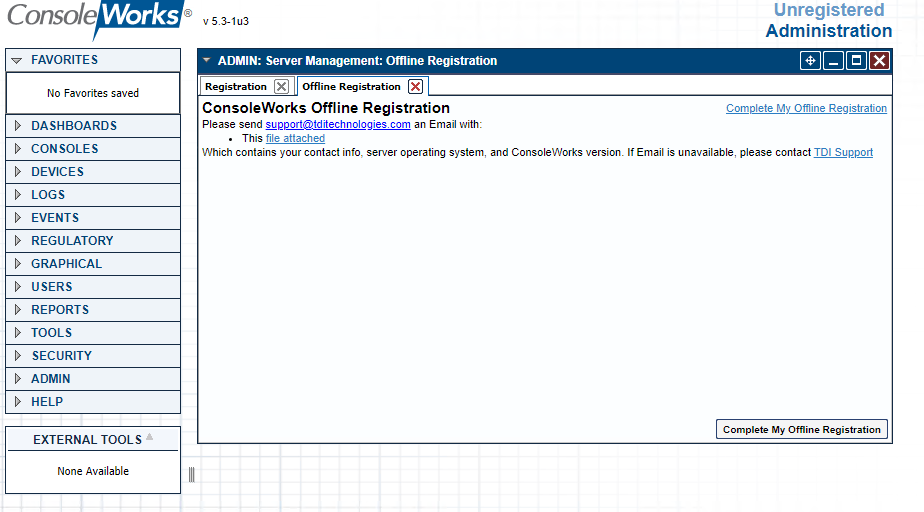
This completes the default installation and establishes a basic ConsoleWorks server configuration. For the lab implementation, ConsoleWorks support provided two additional add-on packages (XML) files to setup the environment: ONBOARDING_1-DASHBOARDS_NCCoE.zip providing preconfigured dashboards for accelerating configurations; and NCCOE_ACRs_20210122_083645.zip providing the access control rules, tags, and automation scripts used for the dashboards. These packages are scheduled for inclusion in future releases or can be requested from ConsoleWorks.
Prior to installing these packages, a backup of the configuration should be made (Figure 2‑45) by accessing Admin > Database Management > Backups and clicking Create Backup.
Figure 2‑45 ConsoleWorks System Backups
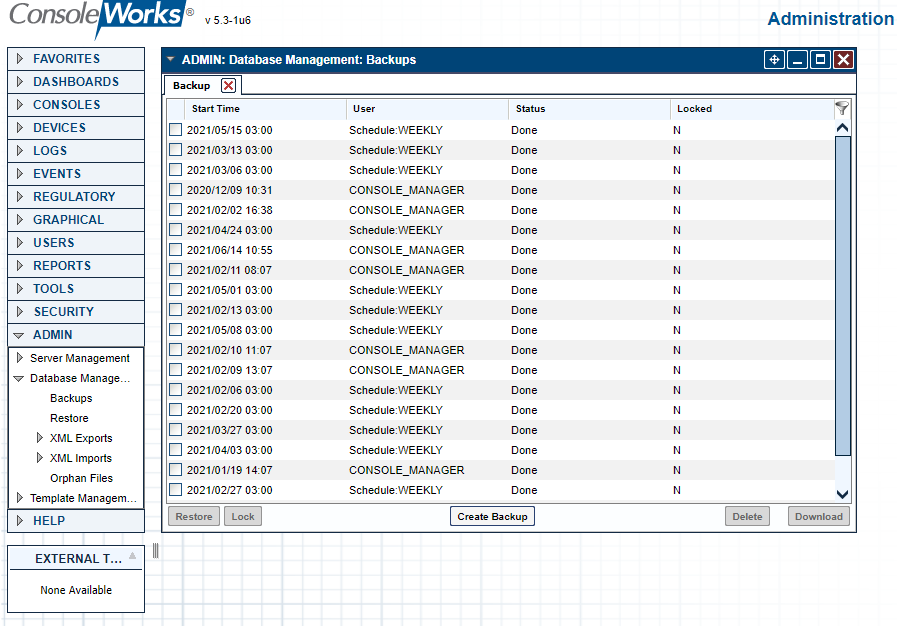
Perform the XML Imports (Figure 2‑46) by accessing Admin > Database Management > XML Imports following these steps:
1) Import the Dashboard Add-On XML file.2) Import the Supporting Configuration Add-On XML file.
Figure 2‑46 ConsoleWorks Importing System Configurations and Components
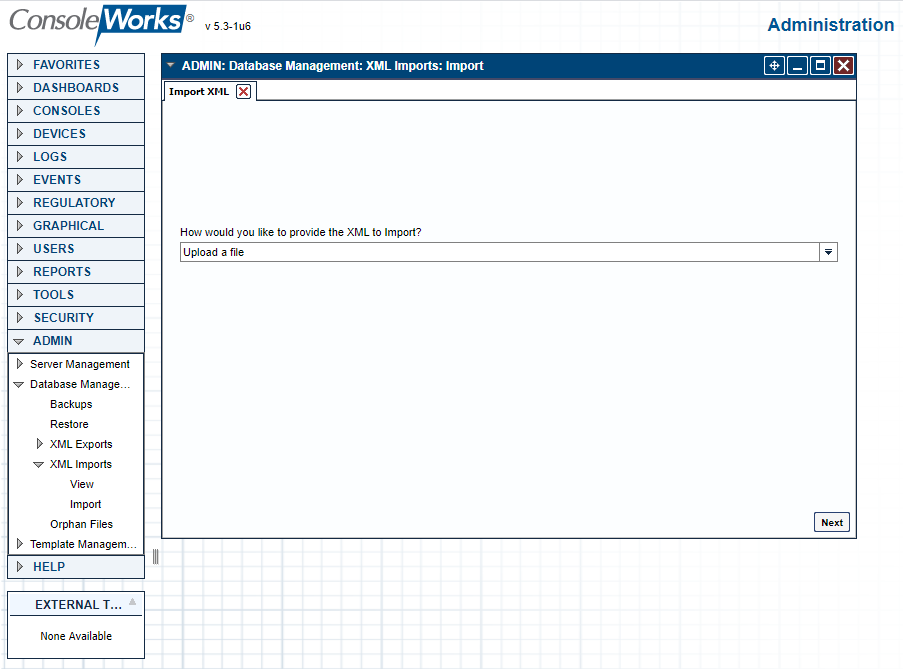
2.8.3 Configuration
The ConsoleWorks implementation required the following changes to the lab Cisco VPN appliance to allow remote users to access the ConsoleWorks system:
Login to the Cisco Firepower Appliance.
Create the Following Destination Network Objects:
For Build 1:
Name: ConsoleWorks
IP Address: 10.100.0.52
For Build 3:
Name: CRS-NAT-IP
IP Address: 10.100.0.20
Create the Following VPN-Rule:
For Build 1:
Action: Allow
Source Networks: VPN-Pool
Destination Networks: ConsoleWorks
Destination Ports: TCP (6): 5176; HTTPS
For Build 3:
Action: Allow
Source Networks: VPN-Pool
Destination Networks: CRS-NAT-IP
Destination Ports: TCP (6): 5176; HTTPS
ConsoleWorks is then configured as follows. For configuration procedures, please see the ConsoleWorks documentation available at https://support.tditechnologies.com/product-documentation.
Configure ConsoleWorks Password Rules (Figure 2‑47):
Figure 2‑47 ConsoleWorks Password Settings
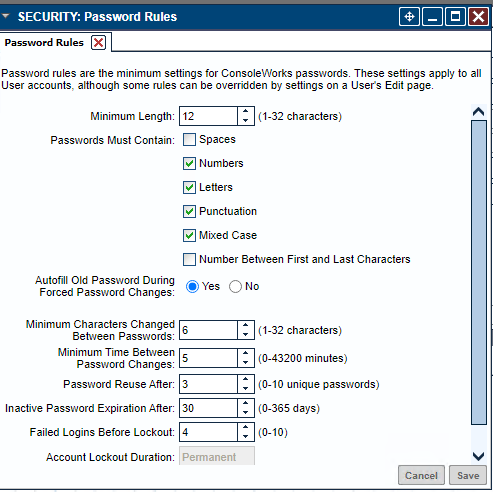
Add user accounts:
NCCOE_ADMIN
NCCOE_USER
Configure the Graphical Gateway to allow users to use RDP within ConsoleWorks following these steps (Figure 2‑48):
Name: LOCAL_GG
Description: Local GUI Gateway
Host: 127.0.0.1
Port: 5172
Enabled: Selected
Encrypt Connection: Selected
Figure 2‑48 ConsoleWorks Add the Local Graphical Gateway for RDP Access
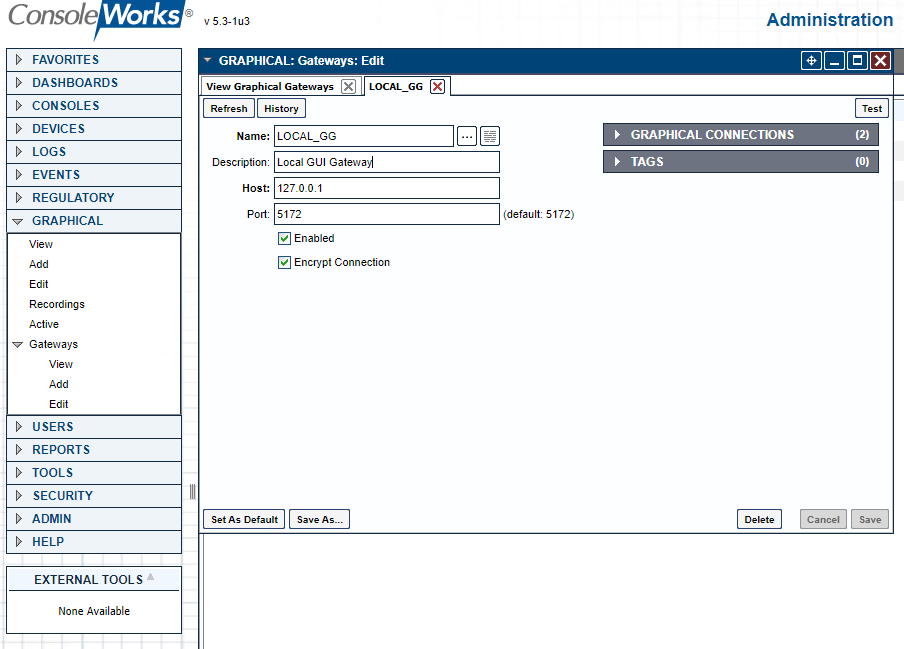
Configure Device Types to organize the registered devices within the system as follows:
Enter the information for the supported device types as shown in the example device type (Figure 2‑49) for each type listed in Table 2‑18 (and shown in Figure 2‑50).
Table 2‑18 ConsoleWorks Device Type List
Name |
Description |
Parent Device Type |
Order |
|---|---|---|---|
NETWORKING |
Devices supporting networked communications |
1 |
|
IT_FWROUTER |
Network Router/Firewall for supporting IT Communications |
NETWORKING |
1 |
IT_SWITCH |
Network switch supporting IT communications |
NETWORKING |
1 |
OT_FWROUTER |
ICS Firewall/Router for ICS Network Separation |
NETWORKING |
1 |
OT_SWITCH |
ICS Switch for supporting OT Subnets |
NETWORKING |
1 |
SERVERS |
Devices for providing one or more IT/OT Services |
1 |
|
IT_SERVERS |
Servers providing IT Services |
SERVERS |
1 |
OT_SERVERS |
Servers providing OT Services |
SERVERS |
1 |
WORKSTATIONS |
Computers used to support IT/OT Operations |
1 |
|
HMI |
Specialized workstation supporting human-machine interfaces |
WORKSTATIONS |
1 |
IT_WORKSTATIONS |
Computers used by users to support IT Operations |
WORKSTATIONS |
1 |
OT_WORKSTATIONS |
Computers used by users to support OT Operations |
WORKSTATIONS |
1 |
Figure 2‑49 ConsoleWorks Example Device Type Definition
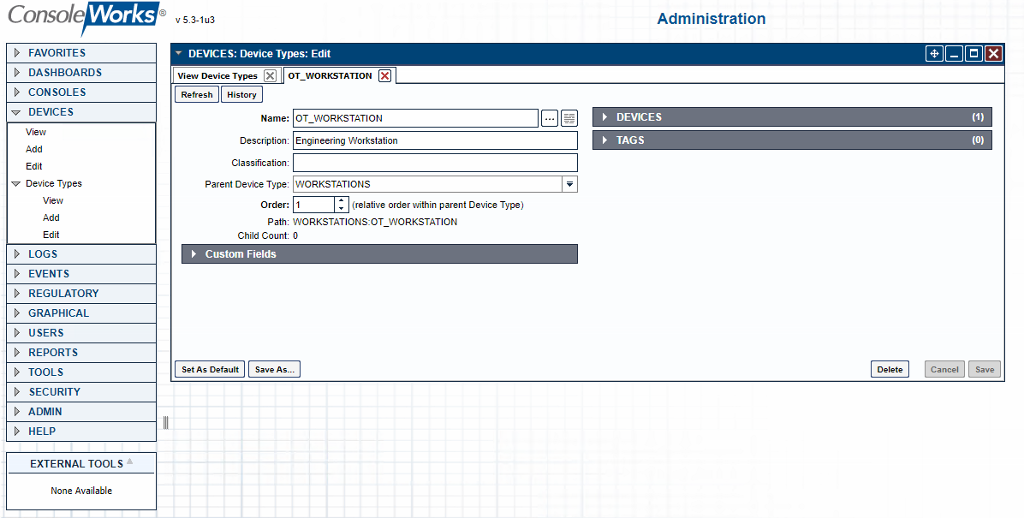
Figure 2‑50 ConsoleWorks List of Device Types
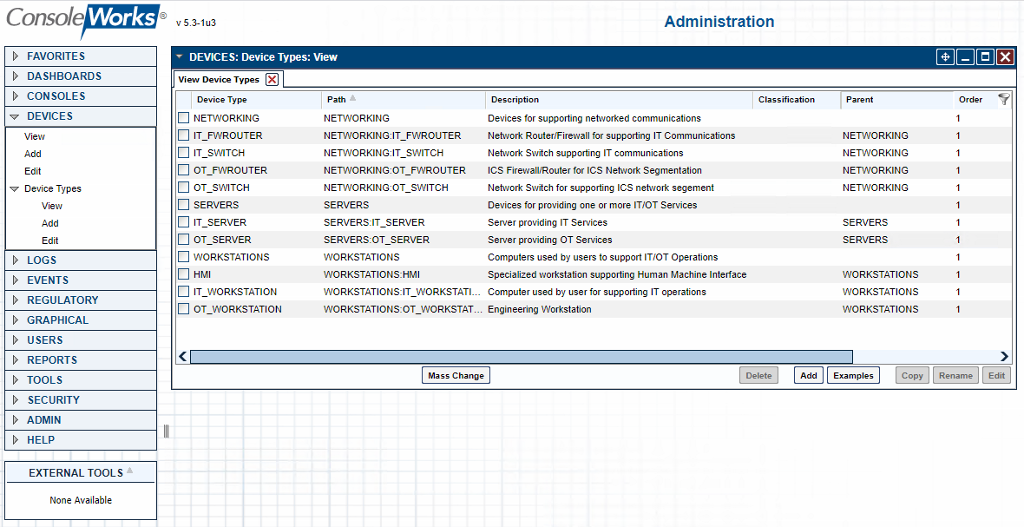
Configure Devices for each system within the testbed that is accessible from ConsoleWorks.
Figure 2‑51 ConsoleWorks Example Device Definition
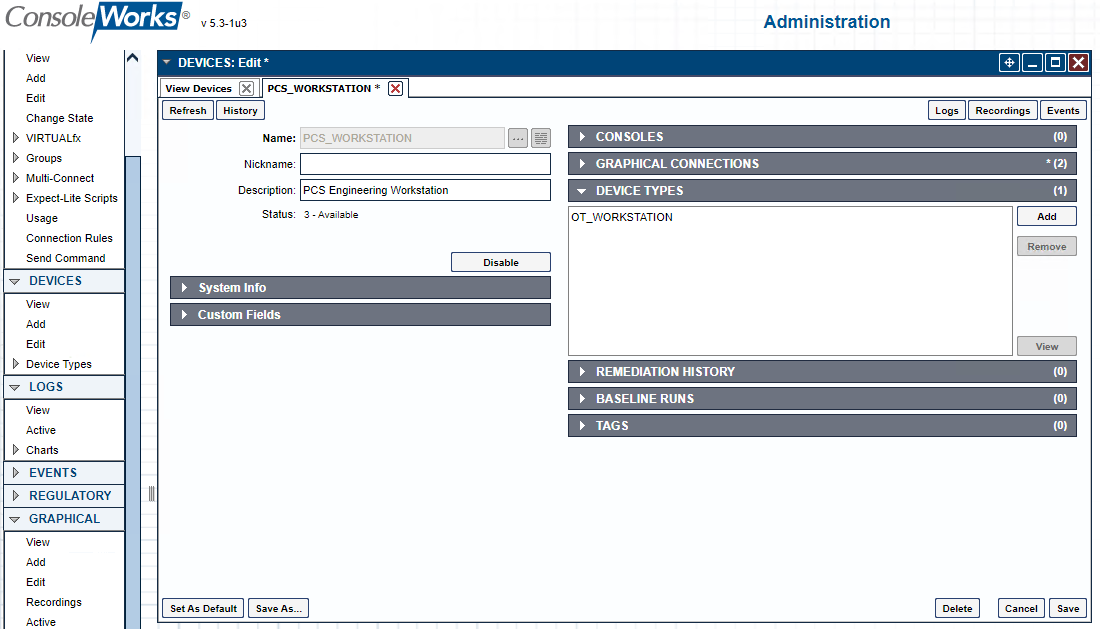
For Build 1 (PCS), enter the information for the devices as shown in the example device (Figure 2-51) for each device listed in Table 2‑19 (Figure 2‑52).
Table 2‑19 ConsoleWorks PCS (Build 1) Devices
Name |
Description |
Device Type |
|---|---|---|
DMZ_HISTORIAN |
Historian in DMZ Subnet |
IT_SERVER |
PCS_HISTORIAN |
Local Historian in PCS Subnet |
OT_SERVER |
PCS_HMI |
PCS HMI Workstation |
HMI |
PCS_ROUTER |
PCS Boundary Firewall/Router |
OT_FWROUTER |
PCS_SWITCH_VLAN1 |
PCS VLAN 1 OT Switch |
OT_SWITCH |
PCS_SWITCH_VLAN2 |
PCS VLAN 2 OT Switch |
OT_SWITCH |
PCS_WORKSTATION |
PCS Engineering Workstation |
OT_WORKSTATIONS |
Figure 2‑52 ConsoleWorks List of PCS (Build 1) Devices
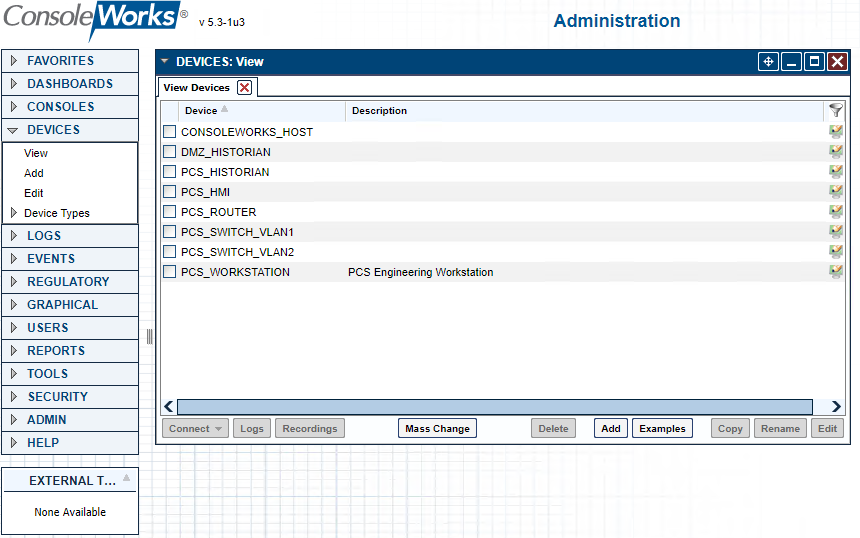
For Build 3 (CRS) , enter the information for the devices as shown in the example device (Figure 2‑51) for each device listed in Table 2‑20 (also shown in Figure 2‑53).
Table 2‑20 ConsoleWorks CRS (Build 3) Devices
Name |
Description |
Device Type |
|---|---|---|
DMZ_HISTORIAN |
Historian in DMZ Subnet |
IT_SERVER |
CRS_HISTORIAN |
Local Historian in CRS Subnet |
OT_SERVER |
CRS_HMI |
CRS HMI Workstation |
HMI |
CRS_ROUTER |
CRS Boundary Firewall/Router |
OT_FWROUTER |
CRS_SWITCH_CONTROL |
OT Switch for Control Network |
OT_SWITCH |
CRS_SWITCH_FIELD |
OT Switch for Field Network |
OT_SWITCH |
CRS_WORKSTATION |
CRS Engineering Workstation |
OT_WORKSTATIONS |
CRS_STATION1 |
Machining Station #1 |
OT_WORKSTATIONS |
CRS_STATION2 |
Machining Station #2 |
OT_WORKSTATIONS |
CRS_STATION3 |
Machining Station #3 |
OT_WORKSTATIONS |
CRS_STATION4 |
Machining Station #4 |
OT_WORKSTATIONS |
Figure 2‑53 ConsoleWorks List of CRS (Build 3) Devices
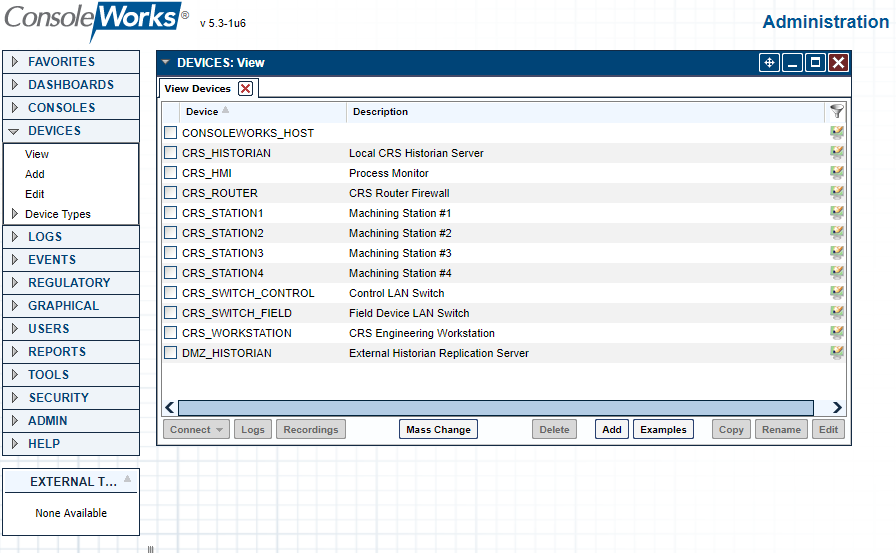
Configure Graphical Connections for the PC (RDP) based devices.
Figure 2‑54 ConsoleWorks Example RDP Configuration
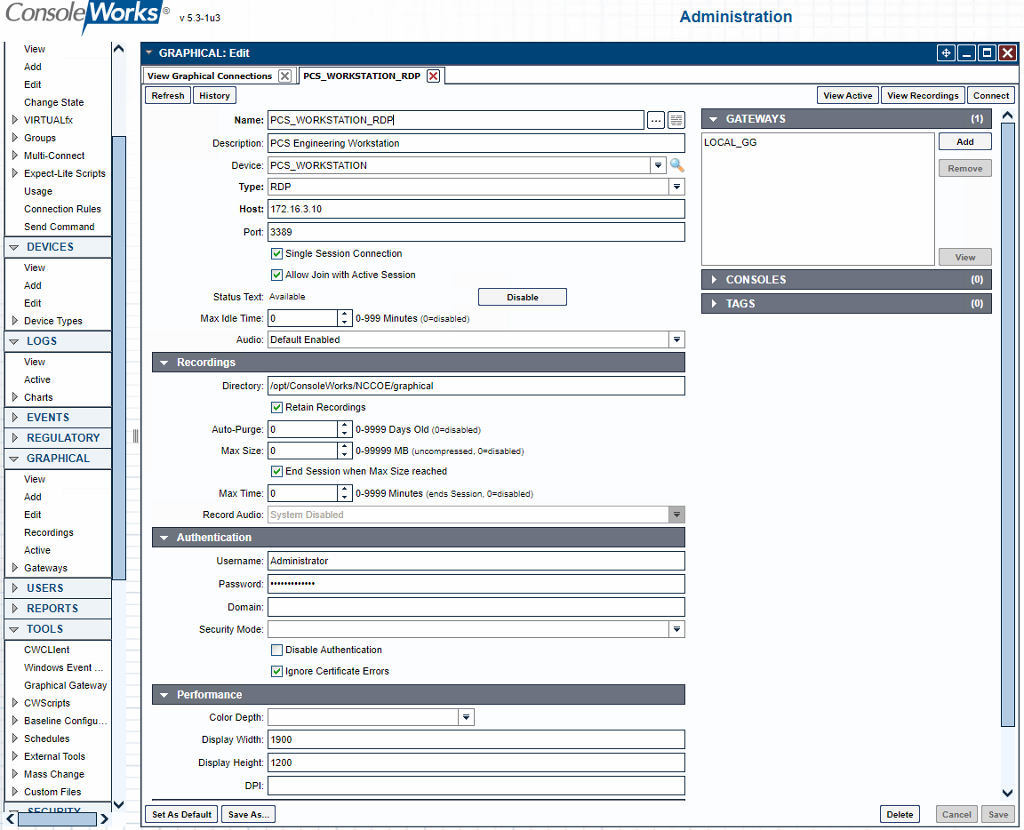
For Build 1 (PCS), enter the information for the Graphical Connections as shown in the example (Figure 2‑54) for each graphical connection listed in Table 2‑21 (also shown in Figure 2‑55). For each entry, the following are common settings for all graphical connections:
Under Gateway, click Add and select LOCAL_GG.
Single Session Connection: Checked
Allow Join with Active Session: Checked
Under Recordings:
1) Directory: /opt/ConsoleWorks/NCCOE/graphical2) Retain Records: Checked3) Auto-Purge: 04) Max Size: 05) End Session when Max Size Reached: Checked6) Max Time: 0Authentication
1) Specify local or domain credentials, which are securely stored byConsoleWorks, to allow complex passwords/credentials withouthaving to share between users.2) Ignore Certificate Errors: Checked only if self-signedcertificates are in use.Performance
1) Display Width: 19002) Display Height: 1200
Table 2‑21 ConsoleWorks PCS (Build 1) Graphical Connections
Name |
Device |
Type |
Host |
Port |
|---|---|---|---|---|
DMZ_HISTORIAN |
DMZ_HISTORIAN |
RDP |
10.100.1.4 |
3389 |
PCS_HISTORIAN |
PCS_HISTORIAN |
RDP |
172.16.2.14 |
3389 |
PCS_HMI_RDP |
PCS_HMI |
RDP |
172.16.2.4 |
3389 |
PCS_WORKSTATION_RDP |
PCS_WORKSTATION |
RDP |
172.16.3.10 |
3389 |
Figure 2‑55 ConsoleWorks List of PCS (Build 1) RDP Connections
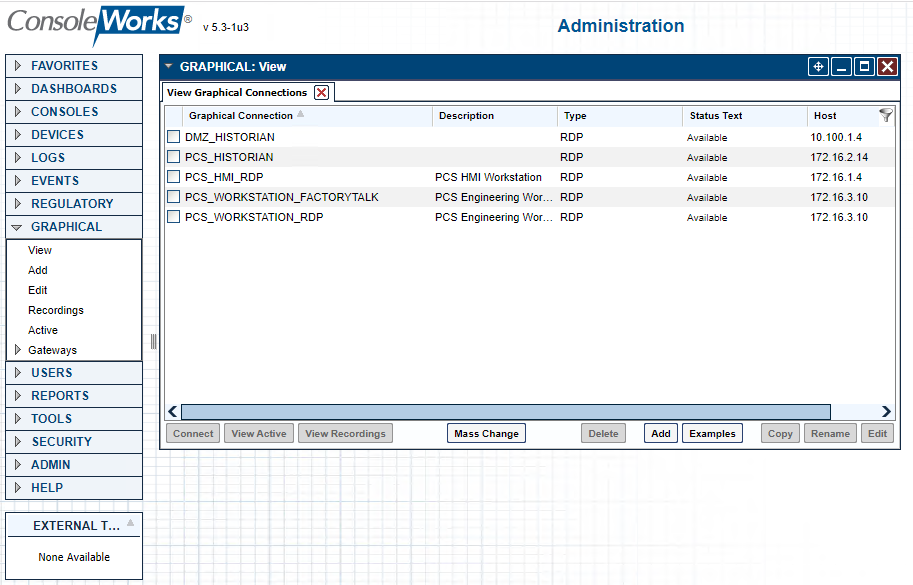
For Build 3 (CRS), enter the information for the graphical connections as shown in the example (Figure 2‑54) for each graphical connection listed in Table 2‑22 (also shown in Figure 2‑56). For each entry, the following are common settings for all graphical connections.
Under Gateway, click Add and select LOCAL_GG.
Under Recordings, use these settings:
1) Directory /opt/ConsoleWorks/NCCOE/graphical2) Retain Records Checked3) Auto-Purge: 04) Max Size: 05) End Session when Max Size Reached: Checked6) Max Time: 0Authentication:
1) Specify local or domain credentials, which are securely storedby ConsoleWorks, to allow complex passwords/credentials withouthaving to share between users.Performance
1) Display Width: 19002) Display Height: 1200
Table 2‑22 ConsoleWorks CRS (Build 3) Graphical Connections
Name |
Device |
Type |
Host |
Port |
|---|---|---|---|---|
DMZ_HISTORIAN |
DMZ_HISTORIAN |
RDP |
10.100.1.4 |
3389 |
CRS_HISTORIAN |
CRS_HISTORIAN |
RDP |
192.168.0.21 |
3389 |
CRS_WORKSTATION |
CRS_WORKSTATION |
RDP |
192.168.0.20 |
3389 |
Figure 2‑56 ConsoleWorks List of CRS (Build 3) RDP Connections
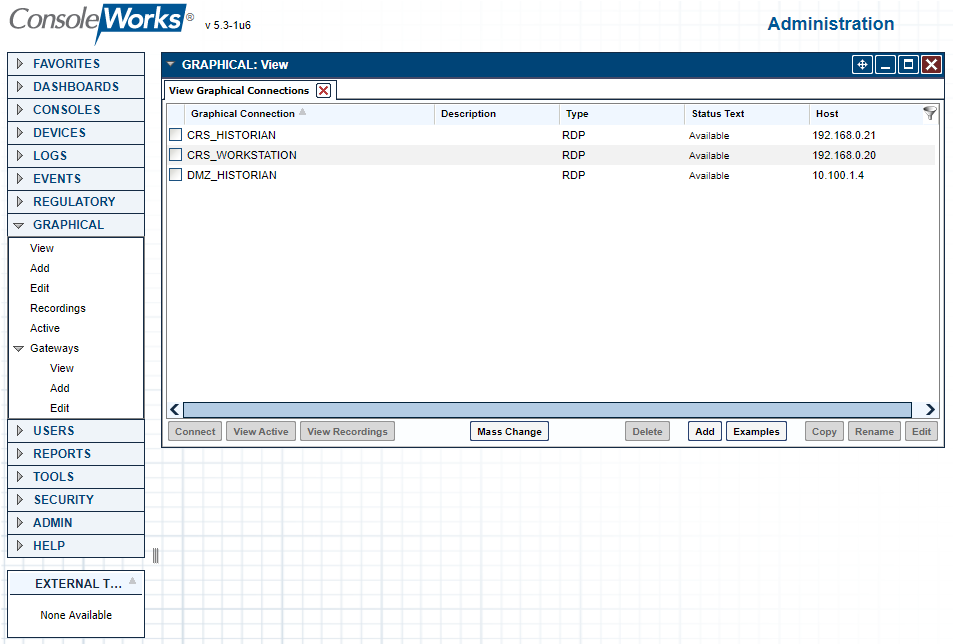
Configure console connections for non-graphical (e.g., SSH) interfaces to devices (Figure 2‑57).
Figure 2‑57 ConsoleWorks Example Console (SSH) Connection
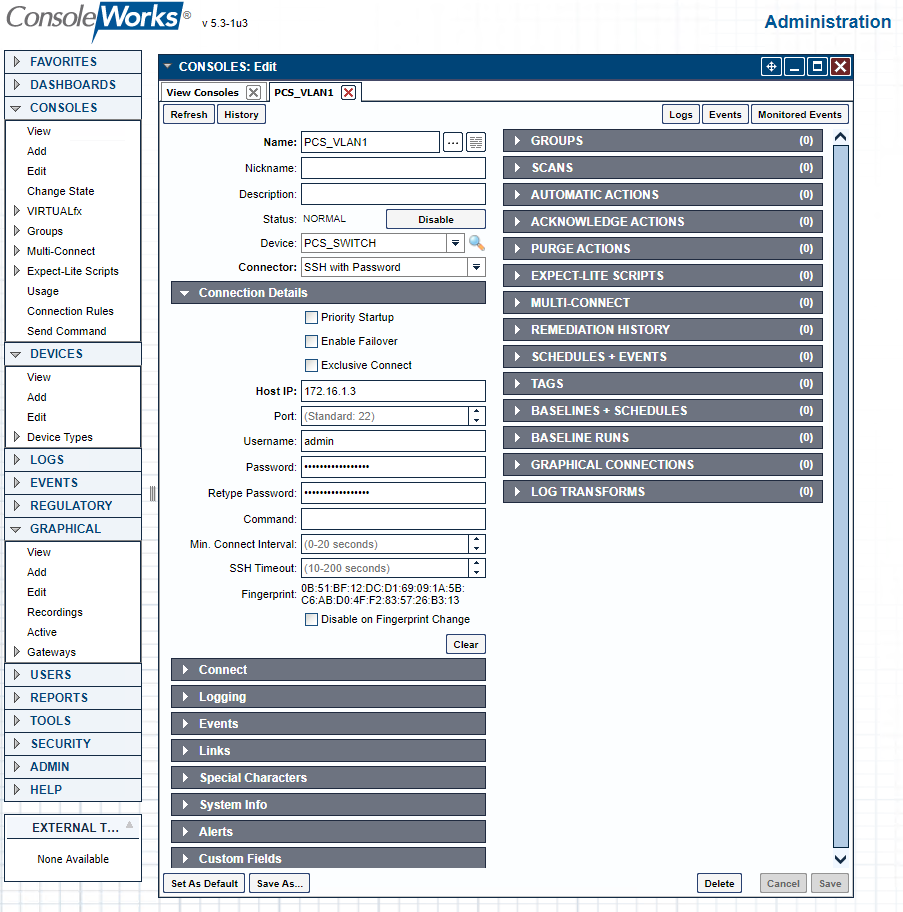
Figure 2‑58 ConsoleWorks Example Console (Web Forward) Connection
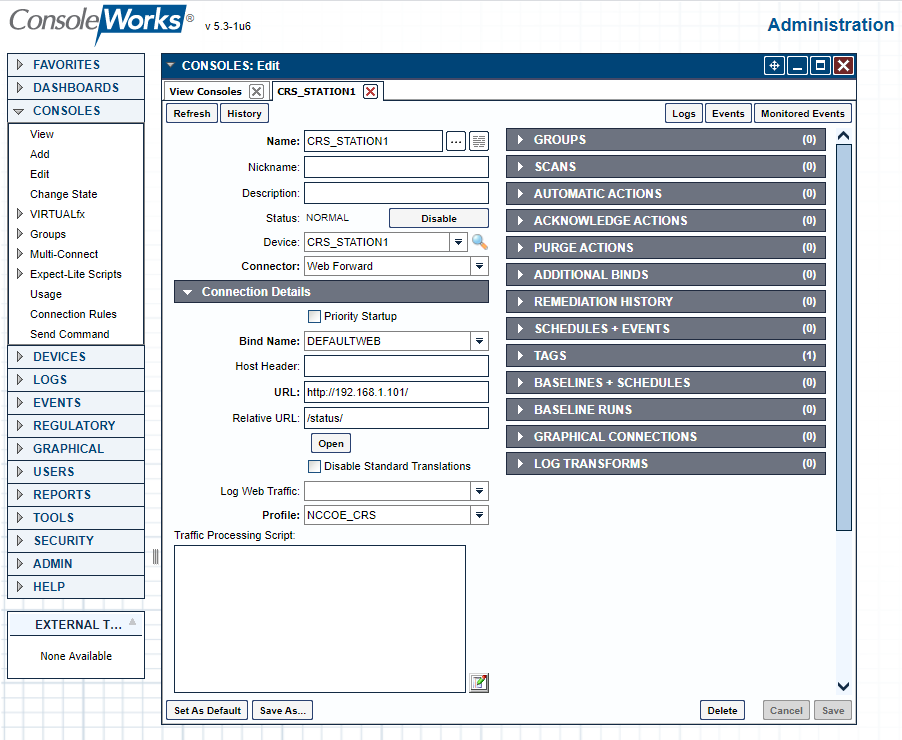
For Build 1 (PCS), enter the information for the Console Connections as shown in the examples (Figure 2‑57 and Figure 2‑58) for each console connection listed in Table 2‑23 (also shown in Figure 2‑59). For each entry, the following are common settings for all console connections.
Under Connection Details:
1) Specify the username and password, which are securely stored byConsoleWorks, to allow complex passwords/credentials withouthaving to share between users.
Table 2‑23 ConsoleWorks PCS (Build 1) Console Connections
Name |
Device |
Connector |
Host |
Po rt |
|---|---|---|---|---|
PCS_ROUTER |
PCS_ROUTER |
SSH with Password |
10 .100.2.8 |
22 |
PCS_VLAN1 |
PCS_SWITCH_VLAN1 |
SSH with Password |
17 2.16.1.3 |
22 |
PCS_VLAN2 |
PCS_SWITCH_VLAN2 |
SSH with Password |
17 2.16.2.2 |
22 |
Figure 2‑59 ConsoleWorks List of PCS (Build 1) Console Connections
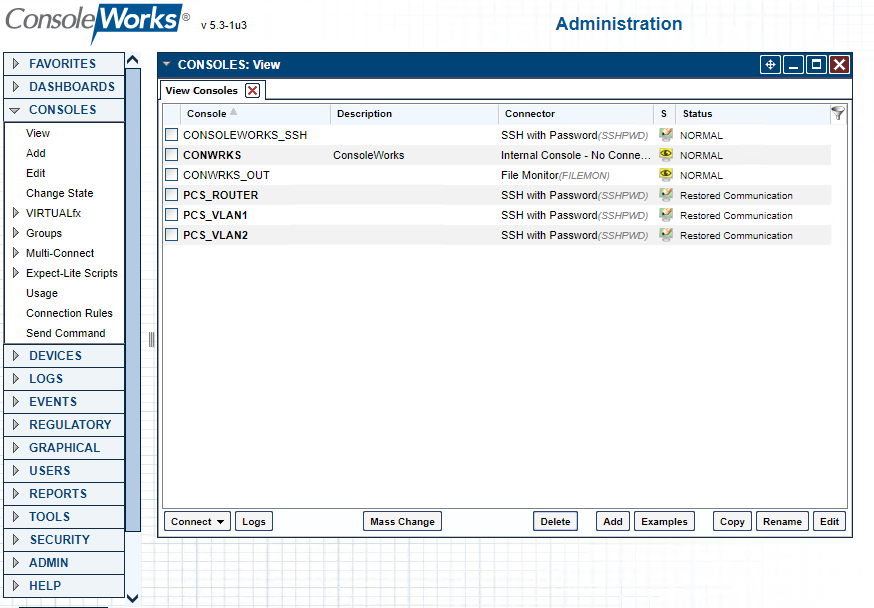
For Build 3 (CRS), enter the information for the console connections as shown in the example (Figure 2‑57 and Figure 2‑58) for each console connection listed in Table 2‑24 (Figure 2‑60). For each entry, the following are common settings for all console connections.
Under Connection Details
1) Specify the username and password, which are securely stored byConsoleWorks, to allow complex passwords/credentials withouthaving to share between users.
Table 2‑24 ConsoleWorks CRS (Build 3) Console Connections
Name |
Device |
Connector |
Host |
Port |
|---|---|---|---|---|
CRS_CONTROL_LAN |
CRS_SWITCH_CONTROL |
Web Forward |
192.168.0.239 |
80 |
CRS_FIELD_LAN |
CRS_SWITCH_FIELD |
SSH with Password |
192.168.1.10 |
22 |
CRS_ROUTER |
CRS_ROUTER |
SSH with Password |
192.168.0.2 |
22 |
CRS_STATION1 |
CRS_STATION1 |
Web Forward |
192.168.1.101 |
80 |
CRS_STATION2 |
CRS_STATION2 |
Web Forward |
192.168.1.102 |
80 |
CRS_STATION3 |
CRS_STATION3 |
Web Forward |
192.168.1.103 |
80 |
CRS_STATION4 |
CRS_STATION4 |
Web Forward |
192.168.1.104 |
80 |
HMI |
CRS_HMI |
Web Forward |
192.168.0.98 |
80 |
Figure 2‑60 ConsoleWorks List of CRS (Build 3) Console Connections
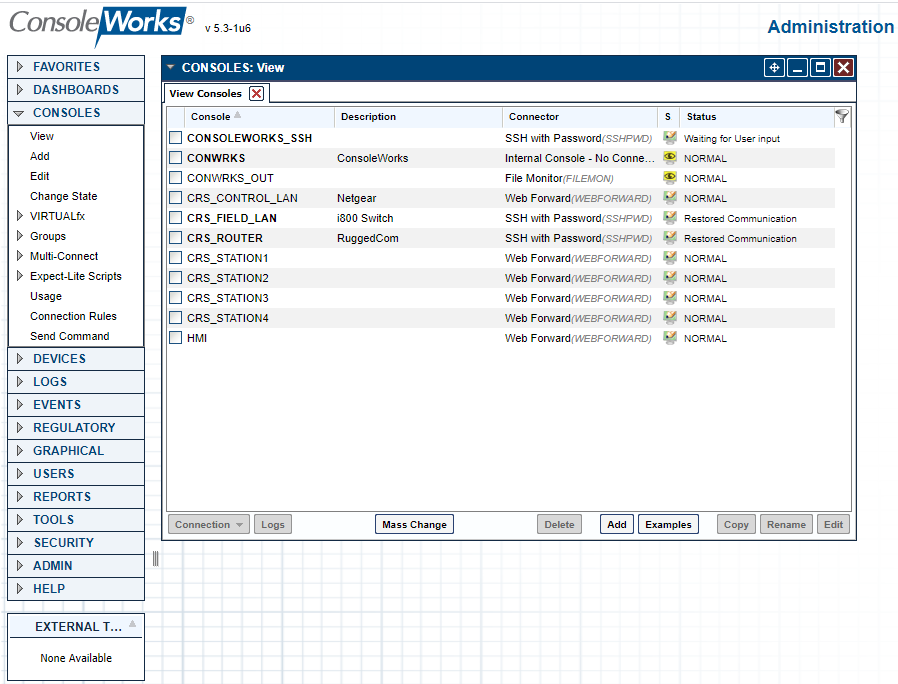
Configure tags to support profiles and access controls.
Figure 2‑61 ConsoleWorks List of Tags for PCS (Build 1)
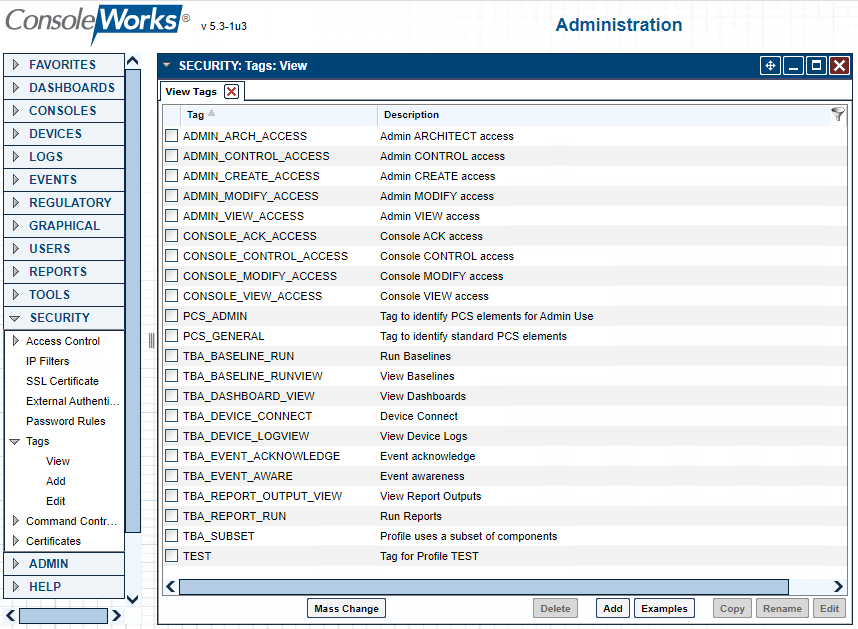
Figure 2‑62 ConsoleWorks Example Tag Definition Screen
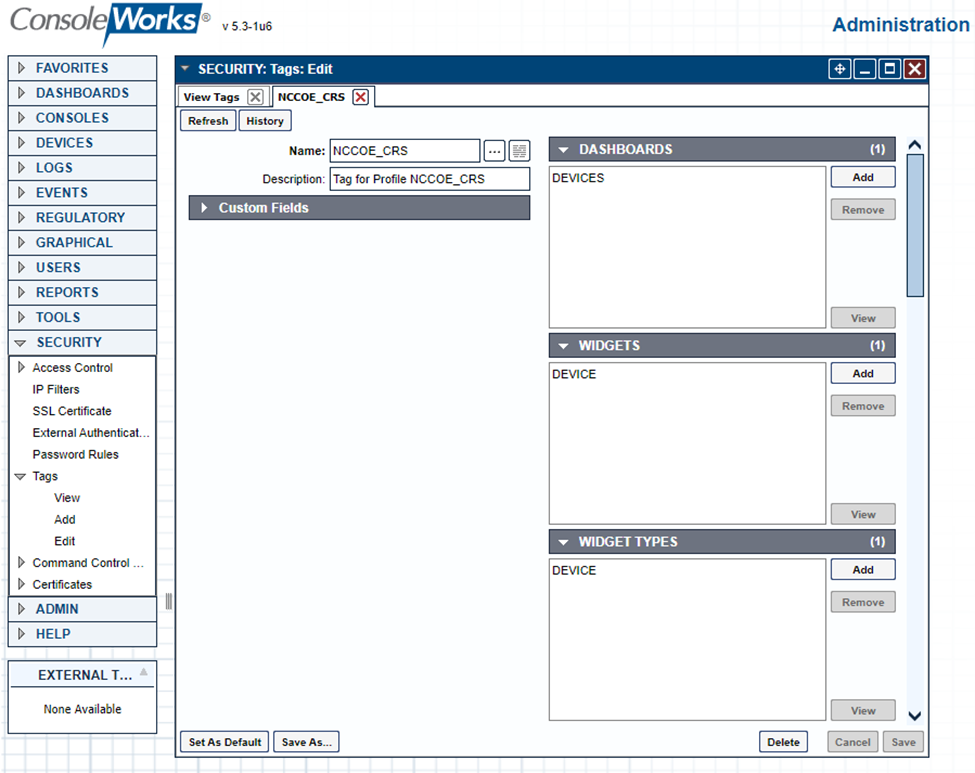
For Build 1 (PCS) the following tags were created as shown in Figure 2‑61. Figure 2‑62 shows an example of a single tag.
Name: PCS_GENERAL
1) Under Dashboards, click Add and select Devices.2) Under Custom UI Classes click Add and select:a) DEVICE_LISTGRIDb) LISTGRID3. Under Devices, click Add and select:a) DMZ_HISTORIANb) PCS_HISTORIANc) PCS_HMIi. PCS_WORKSTATION4) Under Graphical Connections, click Add and select:a) DMZ_HISTORIANb) PCS_HISTORIANc) PCS_HMI_RDPd) PCS_WORKSTATION_RDPName: PCS_ADMIN:
1) Under Dashboards click Add and select Devices2) Under Custom UI Classes click Add and select:a) DEVICE_LISTGRIDb) LISTGRID3) Under Consoles, click Add and select:a) PCS_ROUTERb) PCS_SWITCH_VLAN1c) PCS_SWITCH_VLAN24) Under Devices, click Add and select:a) PCS_ROUTERb) PCS_SWITCH_VLAN1c) PCS_SWITCH_VLAN2
For Build 3 (CRS) Create the following:
Name: NCCOE_CRS
1) Under Dashboards, click Add and select Devices.2) Under Custom UI Classes, click Add and select:a) DEVICE_LISTGRIDb) LISTGRID3) Under Consoles, click Add and select:a) CRS_STATION1b) CRS_STATION2c) CRS_STATION3d) CRS_STATION4e) HMI4) Under Devices, click Add and select:a) CRS_HMIb) CRS_STATION1c) CRS_STATION2d) CRS_STATION3e) CRS_STATION4f) CRS_WORKSTATION5) Under Graphical Connections, click Add and select:a) CRS_WORKSTATIONName: NCCOE_ADMIN
1) Under Dashboards click Add and select Devices2) Under Custom UI Classes click Add and select:a) DEVICE_LISTGRIDb) LISTGRID3) Under Consoles click Add and select:a) CRS_CONTROL_LANb) CRS_FIELD_LANc) CRS_ROUTER4) Under Devices click Add and select:a) CRS_SWITCH_CONTROLb) CRS_SWITCH_FIELDc) CRS_ROUTER
Configure profiles to provide user accounts with granular access controls to available resources (Figure 2‑63).
Figure 2‑63 ConsoleWorks Example Profile
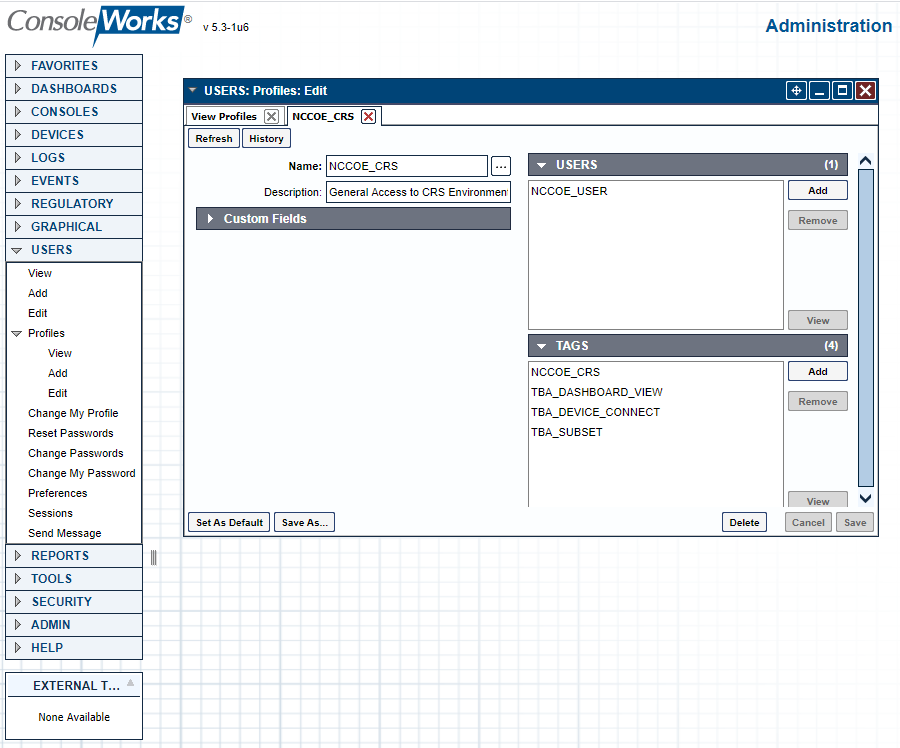
For Build 1 (PCS) the following profiles were created:
PCS_GENERAL
1) Under Users click Add and selecta) NCCOE_USER2) Under Tags click Add and selecta) PCS_GENERALb) TBA_DASHBOARD_VIEWc) TBA_DEVICE_CONNECTd) TBA_SUBSET
PCS_ADMIN
1) Under Users, click Add and select:a) NCCOE_ADMIN2. Under Tags, click Add and select:a) PCS_ADMINb) TBA_DASHBOARD_VIEWc) TBA_DEVICE_CONNECTd) TBA_SUBSETe) CONSOLE_CONTROL_ACCESSf) CONSOLE_VIEW_ACCESS
For Build 3 (CRS) create the following:
NCCOE_CRS profile for the NCCOE_USER with access to Tags:
1) Under Users, click Add and select:a) NCCOE_USER2) Under Tags click Add and select the following:a) NCCOE_CRSb) TBA_DASHBOARD_VIEWc) TBA_DEVICE_CONNECTd) TBA_SUBSETe) CONSOLE_CONTROL_ACCESSf) CONSOLE_VIEW_ACCESSNCCOE_ADMIN profile for the NCCOE_USER with access to Tags:
1) Under Users, click Add and select:a) NCCOE_ADMIN2) Under Tags click Add and select the following:a) NCCOE_ADMINb) TBA_DASHBOARD_VIEWc) TBA_DEVICE_CONNECTd) TBA_SUBSETe) CONSOLE_CONTROL_ACCESSf) CONSOLE_VIEW_ACCESS
2.9 Tenable.OT
The Tenable.OT implementation in Build 1 consists of a single appliance to meet BAD, hardware modification, firmware modification, and software modification capabilities. Tenable.OT utilizes a combination of passive and active sensors to monitor critical networks for anomalies and active querying to retrieve information about endpoints in the PCS environment.
2.9.1 Host and Network Configuration
Tenable.OT is installed and configured to support the PCS environment in Build 1. The overall build architecture is described in Figure B-1, and the Tenable.OT specific components are listed in Table 2‑25.
Table 2‑25 Tenable.OT Appliance Details.
Name |
System |
OS |
CPU |
Memory |
Storage |
Network |
|---|---|---|---|---|---|---|
Tenable.OT |
Model: NCA-4010C-IG1 |
CentOS 7 |
Intel Xeon D-1577 |
64 GB |
64 Gb 2 TB 2 TB |
Testbed LAN 10.100.0.66 |
2.9.2 Installation
The Tenable.OT (Version 3.8.17) appliance is installed in a rack with network connections for the Management/Query traffic on Port 1 and SPAN traffic on Port 2 of the appliance. Documentation for Tenable.OT is available at https://docs.tenable.com/Tenableot.htm.
2.9.3 Configuration
This section outlines the steps taken to configure Tenable.OT to fully integrate and support the PCS environment. These include setting NTP settings to synchronize the system time with the lab time source, configuring the scanning options for the PCS environment, and configuring network objects and policies to enhance alerting for DMZ specific remote connections.
Enable connection through PCS Firewall
Add the following rules (Table 2‑26) to the PCS Firewall to allow Tenable.OT to perform asset discovery and controller scanning.
Table 2‑26 Firewall Rules for Tenable.OT
Rule Type |
Source |
Destination |
Protocol:Port(s) |
Purpose |
|---|---|---|---|---|
Allow |
10.100.0.66 |
172.16.0.0/22 |
ICMP |
Asset Discovery |
Allow |
10.100.0.66 |
172.16.2.102 |
TCP: 44818,2222 |
PLC Controller Scans |
Set NTP Services as follows:
After logging into the appliance, navigate to Local Settings > Device.
To the right of System Time, click Edit to display the time service options (Figure 2‑64).
Enter the NTP Server information: 10.100.0.15
Click Save.
Figure 2‑64 Tenable.OT Local Device Setting for NTP Service
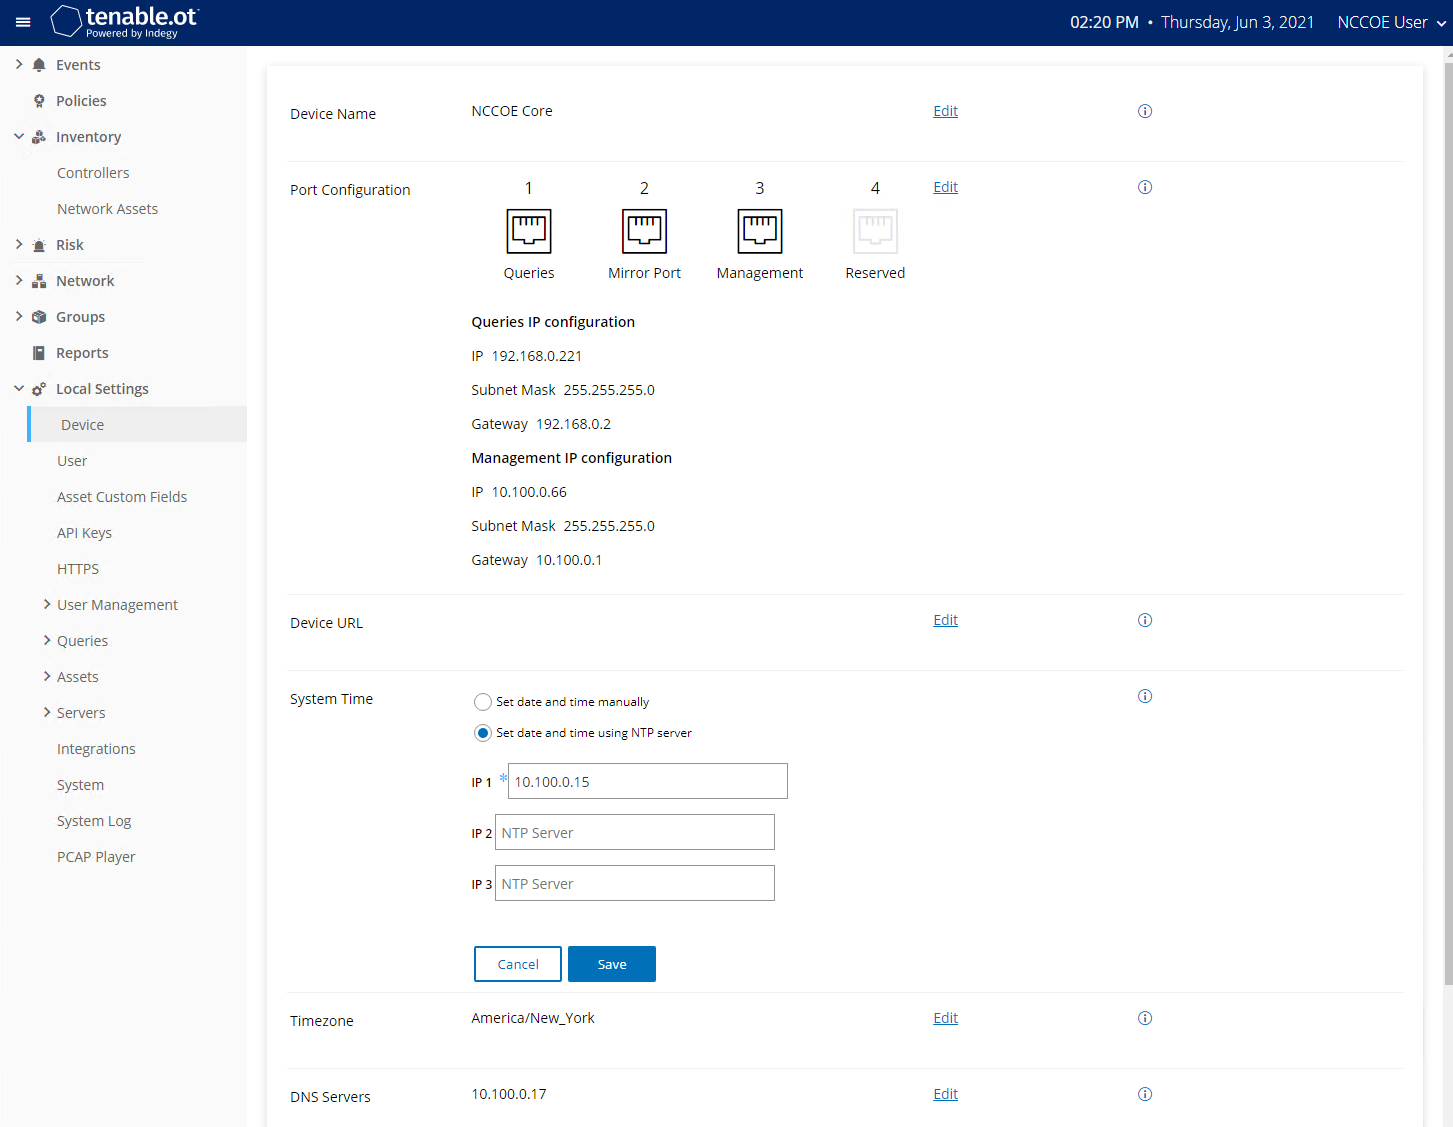
Configure Scanning Options as follows:
Set Asset Discovery Scans:
Navigate to Local Settings > Queries > Asset Discovery (Figure 2‑65)
Enable both scan options.
Select Edit next to Asset Discovery.
1) Enter the following CIDR for the PCS, DMZ, and Testbed networks:a) 172.16.0.0/22b) 10.100.0.0/24c) 10.100.1.0/242) Set the scan properties as follows:a) Number of Assets to Poll Simultaneously: 10b) Time Between Discovery Queries: 1 secondc) Frequency: Dailyd) Repeats Every: 7 Dayse) Repeats at: 9:00 PM3) Click Save.
Figure 2‑65 Tenable.OT Asset Discovery Settings
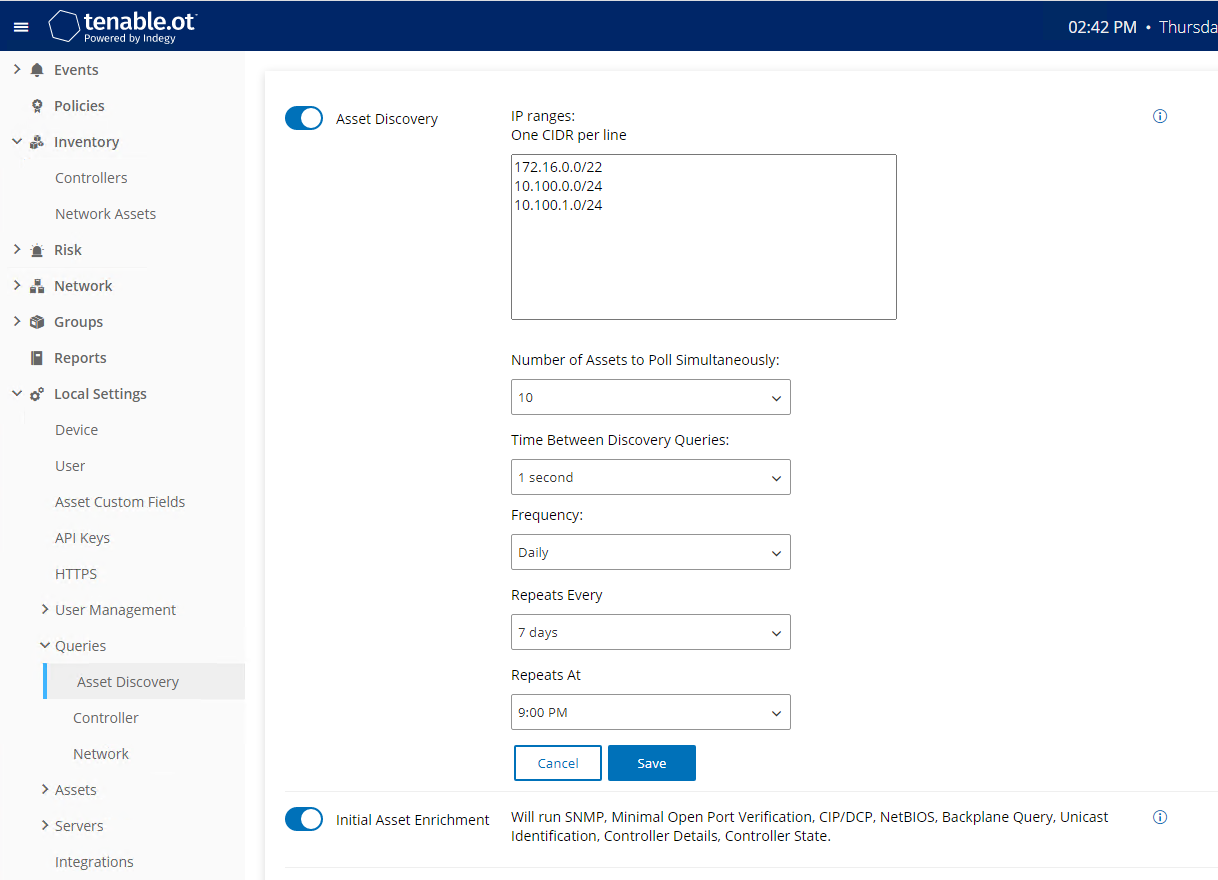
Set Controller Scans as follows:
Navigate to Local Settings > Queries > Controller (Figure 2‑66)
Enable the following options:
1) All Controller Queries2) Periodic Snapshots3) Controller Discovery4) Controller Status Query5) Controller Details Query6) Backplane Query
Figure 2‑66 Tenable.OT Controller Scans
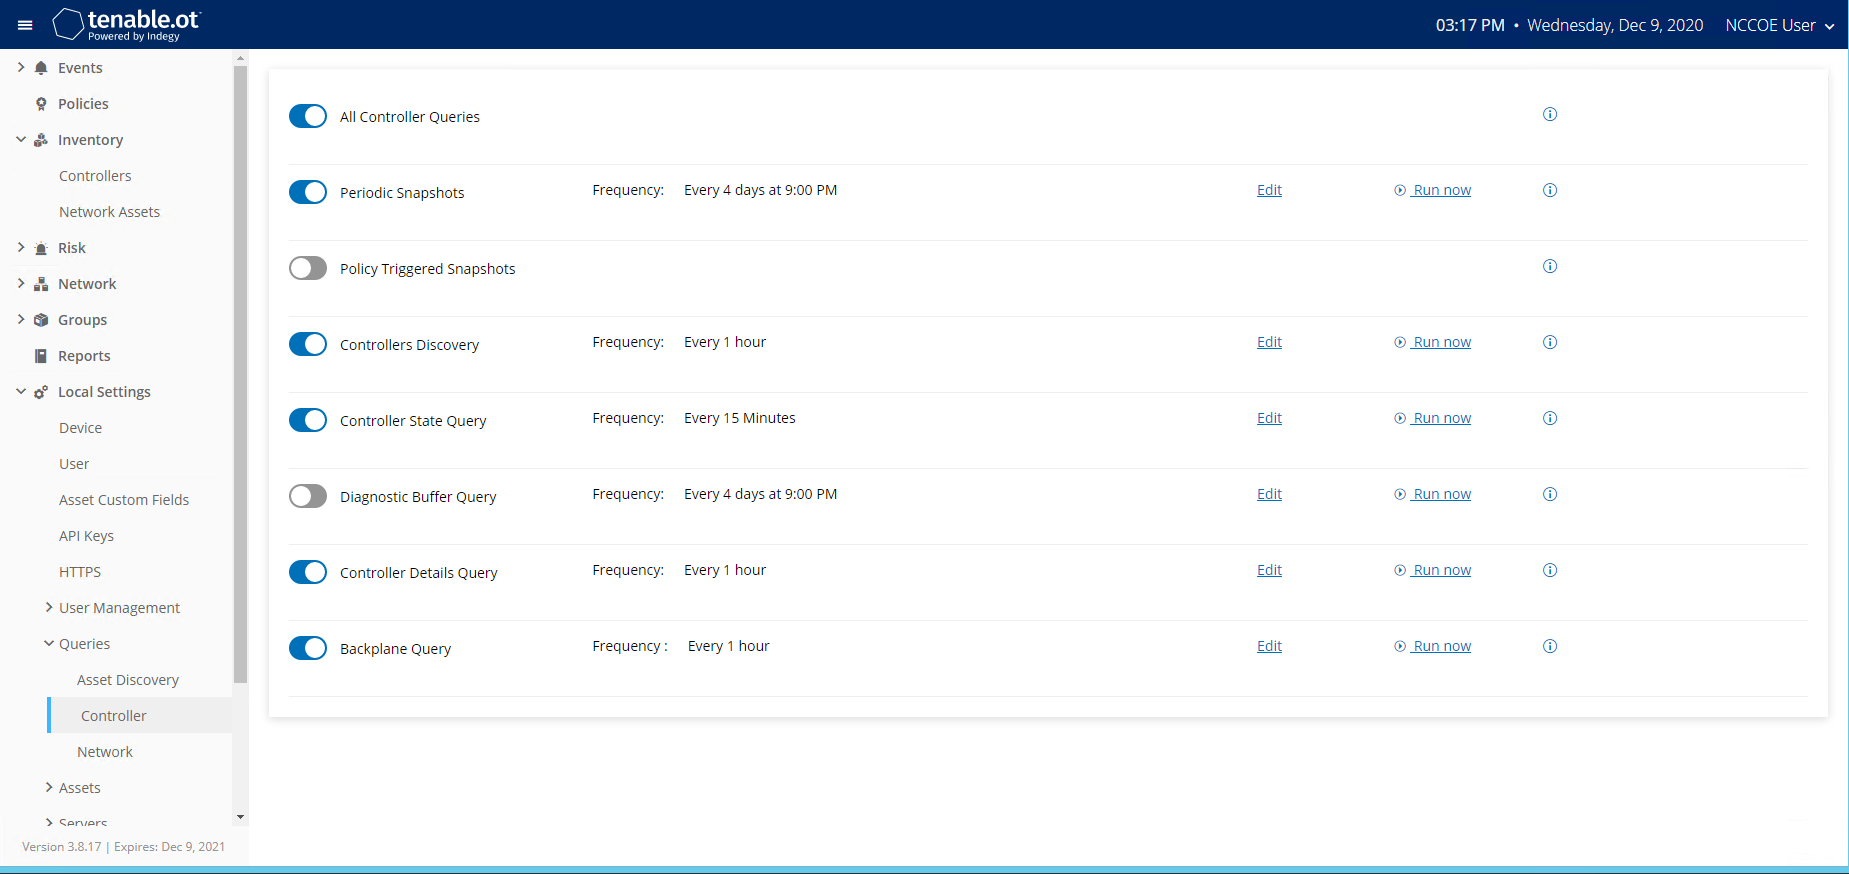
Set Network Scans as follows:
Navigate to Local Settings > Queries > Network (Figure 2‑67)
Enable the following options:
1) All Network Queries2) DNS Query3) ARP Query4) NetBIOS Query
Figure 2‑67 Tenable.OT Network Scan Settings
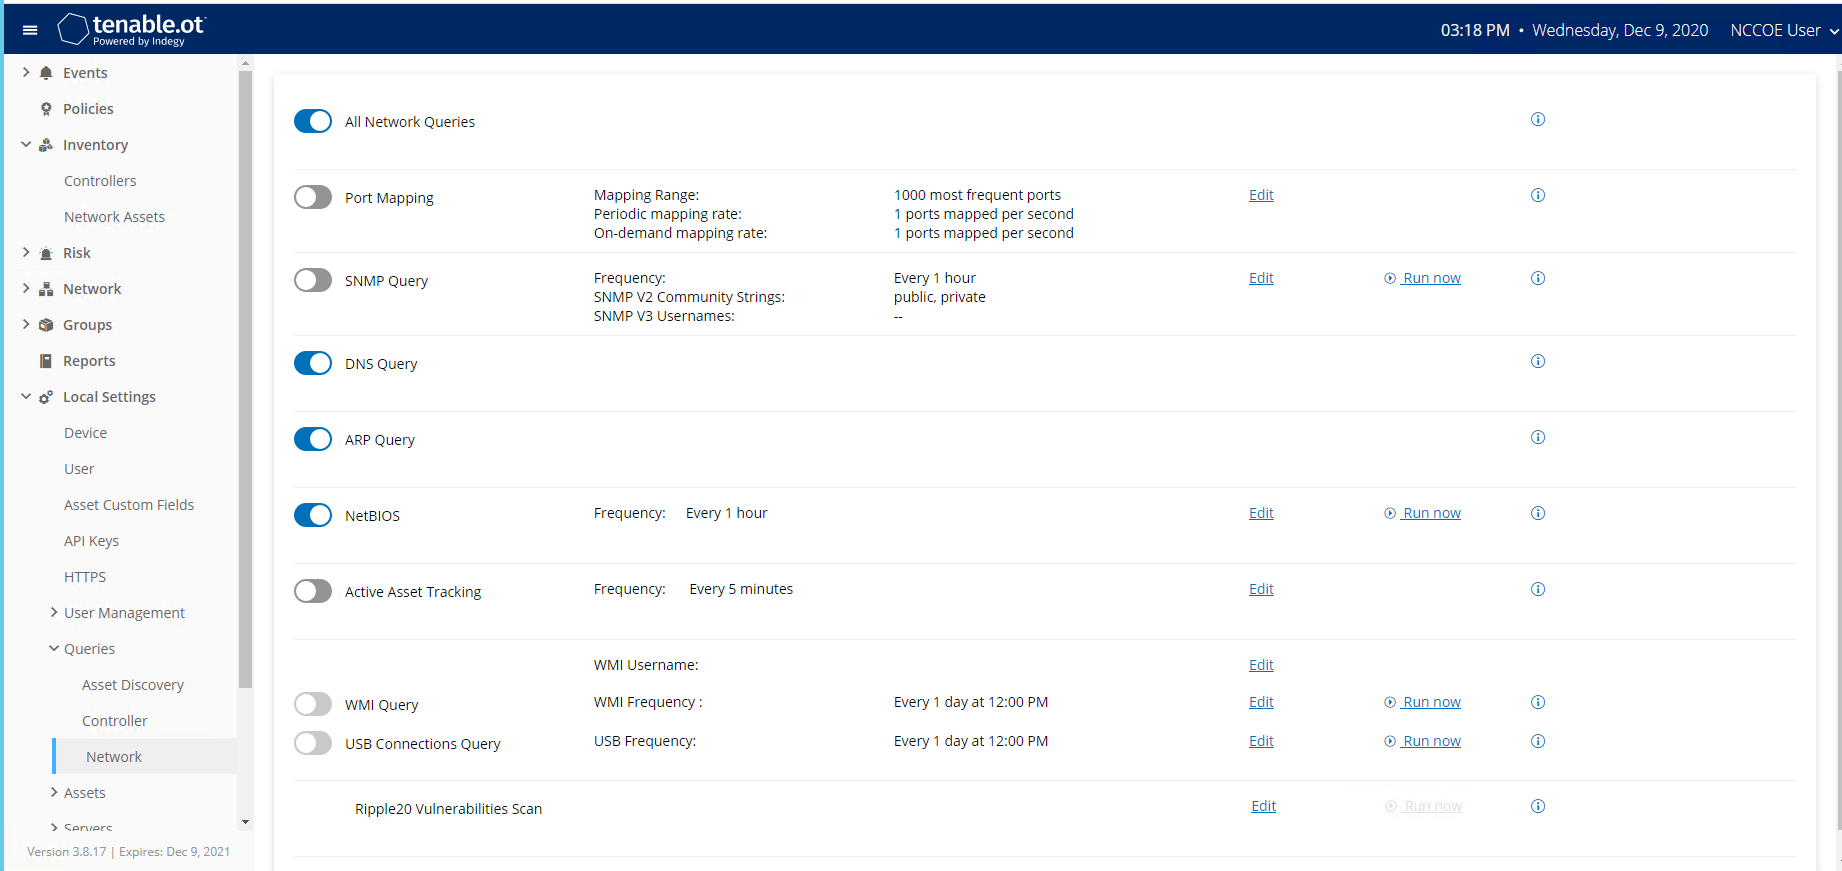
Create Group Object as follows:
Set DMZ Group Object
Navigate to Groups > Asset Groups
Click Create Asset Group to initiate the Wizard process.
1) Select IP Range for the Asset Group Type (Figure 2‑68)and Click Next.2) Enter the asset name in Name, the starting IP addressin Start IP, and the ending IP Address in End IP(Figure 2‑69) and Click Create.
Figure 2‑68 Tenable.OT Create Asset Group Type
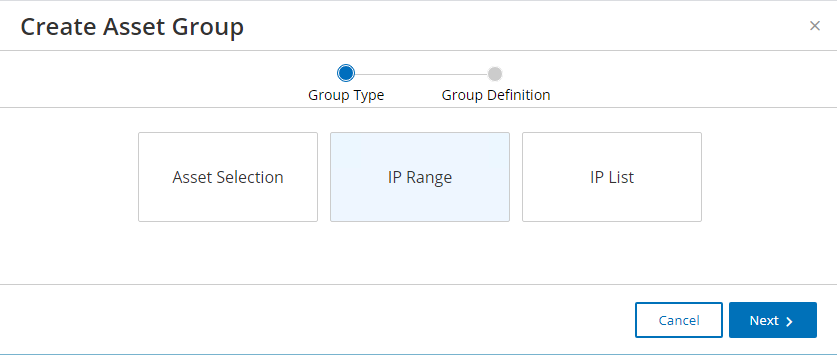
Figure 2‑69 Tenable.OT Create Asset Group Definition
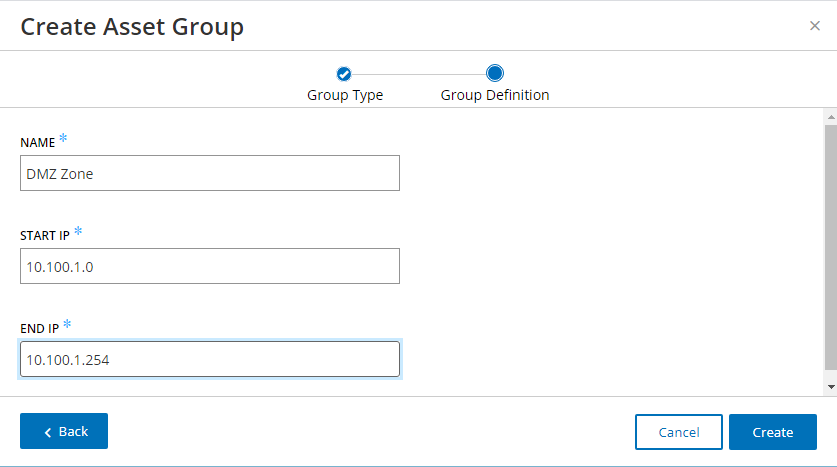
Create Policy to Detect External RDP Traffic:
In the left side navigation, click Policies.
Click Create Policy in the upper right corner of the page (Figure 2‑70), then follow these steps:
For the Event Type (Figure 2‑71), select as a Network Events > RDP Connection (Authenticated) and click Next.
For the Policy Definition (Figure 2‑72), specify the following parameters and click Next:
1) Policy Name: Enter “External RDP Communications”2) Source Group: Select “In” from the first drop-down,and “DMZ” from the second drop-down.3. Destination Group: Select “In” from the firstdrop-down and select “In Any Asset” from the seconddrop-down.4. Schedule Group: Select “In” from the first drop-down,and “In Any Time” from the second drop-down.For the Policy Action (Figure 2‑73), select Medium Sensitivity and click Create.
Figure 2‑70 Tenable.OT Policy Settings
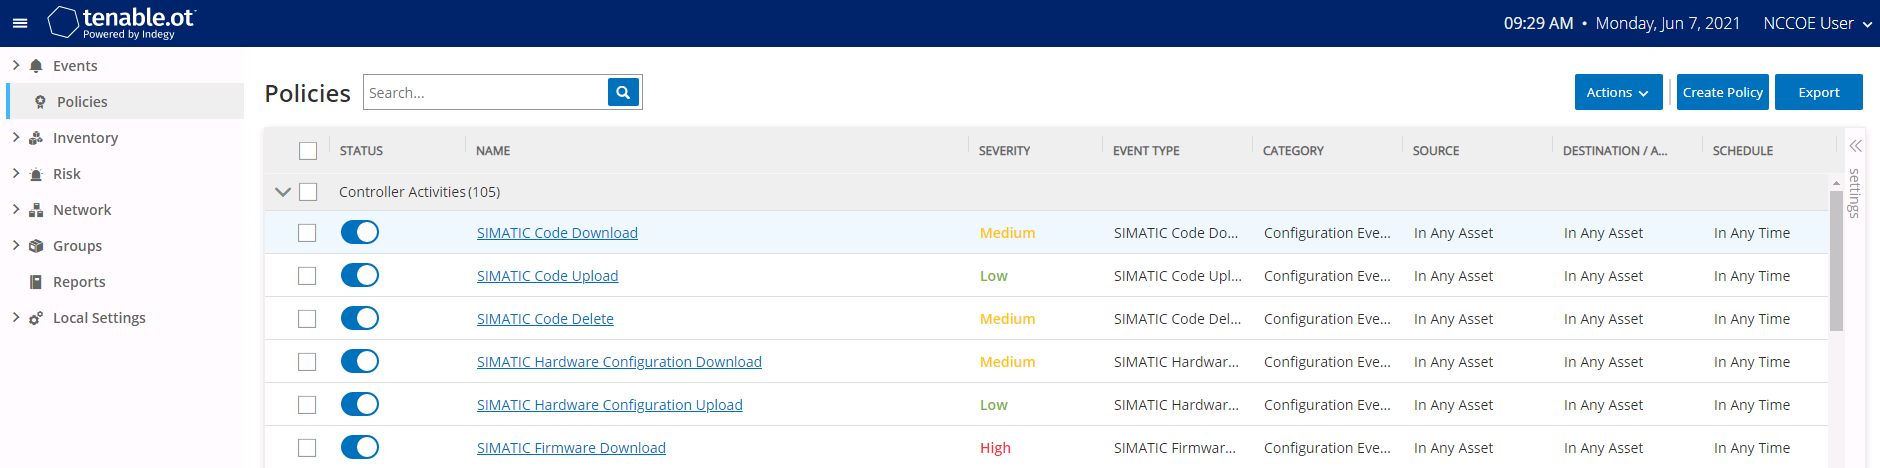
Figure 2‑71 Tenable.OT Create Policy – Event Type Options
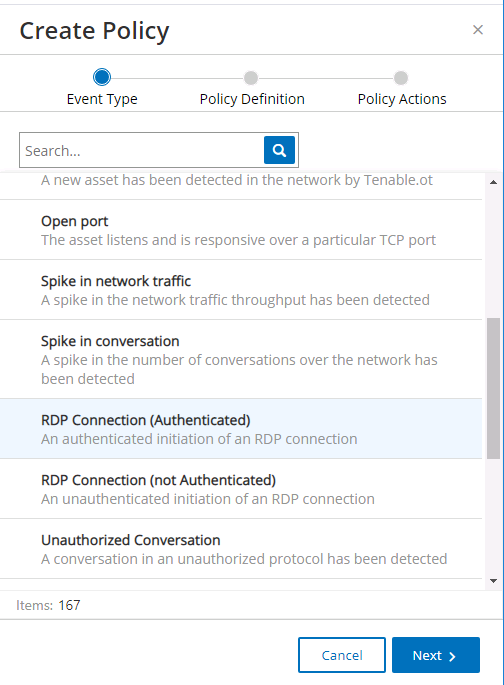
Figure 2‑72 Tenable.OT Create Policy - Definition
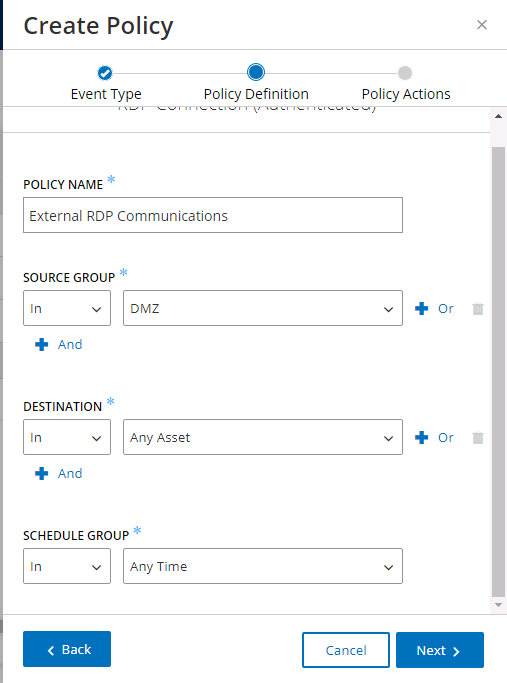
Figure 2‑73 Tenable.OT Create Policy - Actions
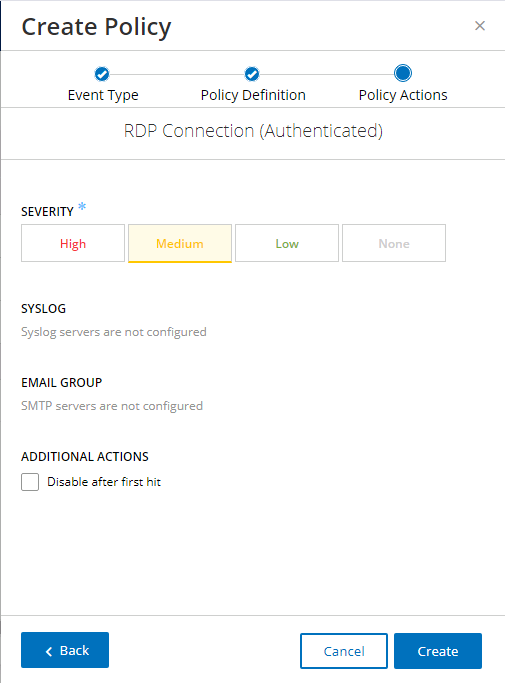
2.10 VMware Carbon Black App Control
VMWare Carbon Black App Control is an endpoint protection tool that provides multiple file integrity and application features, including application allow/deny listing and file modification or deletion protection. Carbon Black was used for Builds 1 and 4 as the application allowlisting (AAL) and file integrity checking tool.
2.10.1 Host and Network Configuration
The following tables (Table 2‑27, Table 2‑28, and Table 2‑29) detail the host and network configuration of the Carbon Black App Control server for PCS and CRS.
Table 2‑27 Carbon Black App Control Domain Hosts Deployment
Name |
System |
OS |
CPU |
Memory |
Storage |
Network |
|---|---|---|---|---|---|---|
Carbon Black Server |
VMware ESXi VM |
Windows Server 2016 Datacenter |
4 |
8GB |
500GB |
Testbed LAN 10.100.0.52 |
Windows Server |
Hyper-V VM |
Windows Server 2012 R2 |
2 |
6GB |
65GB |
Testbed LAN 10.100.0.25 |
OSIsoft Pi Server |
Hyper-V VM |
Windows Server 2016 Standard |
4 |
8GB |
80G B/171GB |
DMZ 10.100.1.4 |
Dispel VDI |
Hyper-V VM |
Windows Server 2016 Datacenter |
2 |
8GB |
126GB |
N/A |
Table 2‑28 Carbon Black App Control PCS Hosts Deployment
Name |
System |
OS |
CPU |
Memory |
Storage |
Network |
|---|---|---|---|---|---|---|
PCS HMI Workstation |
Supermicro Z97X-Ud5H |
Windows 7 |
4 |
8GB |
233GB |
PCS 172.16.1.4 |
PCS Engineering Workstation |
Supermicro Z97X-Ud5H |
Windows 7 |
4 |
16GB |
465GB |
PCS 172.16.3.10 |
Table 2‑29 Carbon Black App Control CRS Hosts Deployment
Name |
System |
OS |
CPU |
Memory |
Storage |
Network |
|---|---|---|---|---|---|---|
CRS Engineering Workstation |
Dell Precision T5610 |
Windows 10 |
8 |
16GB |
465GB |
CRS Supervisory 192.168.0.20 |
CRS OSIsoft Pi Server |
Hyper-V VM |
Windows Server 2016 Standard |
4 |
16GB |
80GB/171GB |
CRS Supervisory 192.168.0.21 |
2.10.2 Installation
Prepare the Carbon Black App Control Server (fka CB_Protection) in accordance with the CB Protection Operating Environment Requirements v8.1.6 document that is provided for installation. This document, and all Carbon Black documentation, can be found on the website https://community.carbonblack.com.
Install Carbon Black App Control Server (fka CB_Protection) using these steps:
Created the nccoeCarbon domain user account on LAN AD to be used for installation and administration of CB App Control Server and add this user to the local administrators’ group on the server.
Install SQL Server Express 2017 according to the CB Protection SQL Server Configuration v8.1.4 document.
Install the CB App Control Server according to the CB Protection Server Install Guide v8.1.6 document.
2.10.3 Configuration
Follow these steps to configure Windows Server 2016:
On the Carbon Black App Control Server, configure Windows Server 2016:
Based on Carbon Black documentation (Figure 2‑74), Windows Server 2016 will need to have the following features for the Internet Information Services (IIS) role enabled for Carbon Black to work (Figure 2‑75).
- Figure 2‑74 Excerpt from Carbon Black Documentation on Support Server
Requirements
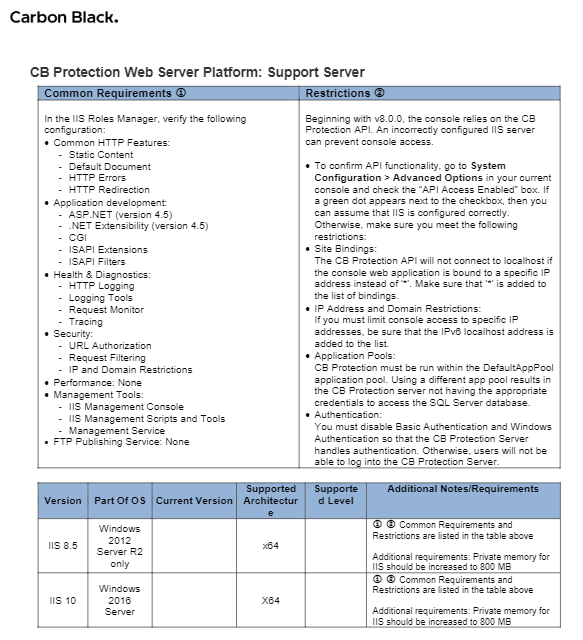
Figure 2‑75 IIS Configuration for Carbon Black, Server Roles
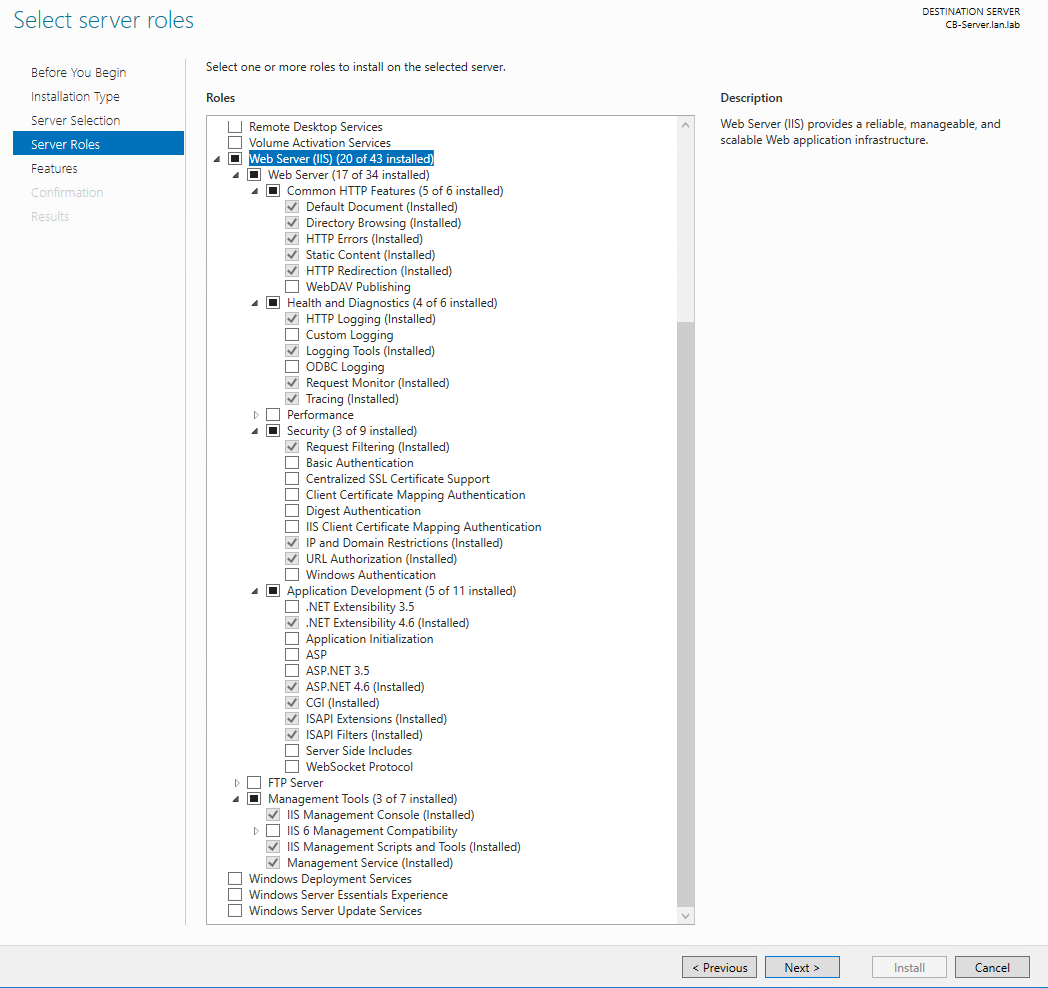
Manually update the Windows Server firewall configuration to allow inbound port 41002 traffic from CB App Control clients/agents.
Configure Policy in the Carbon Black Console using these steps:
In the CB App Control Console, go to Rules > Policies.
Create a new policy with the desired enforcement level. In this case, a high enforcement level was chosen to actively block execution of unapproved or banned executables (Figure 2‑76).
Figure 2‑76 Carbon Black Policy Edit
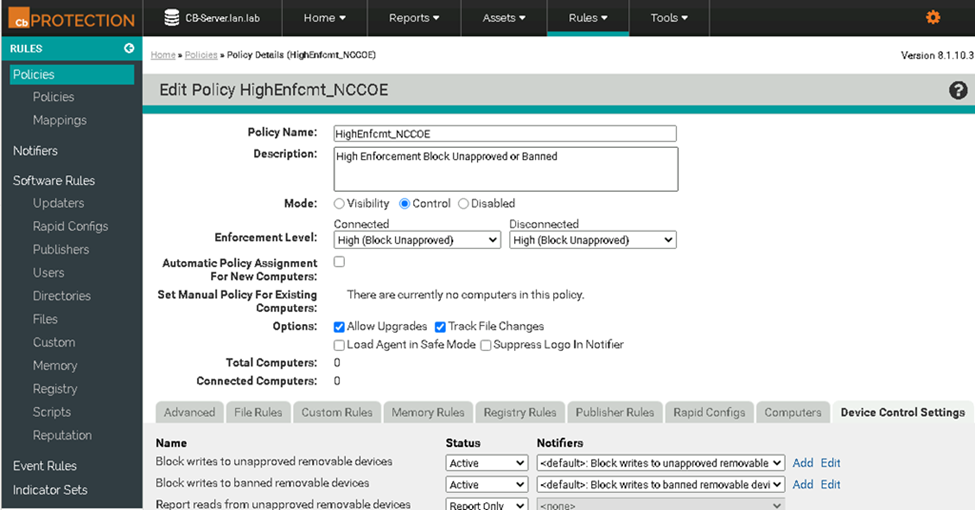
Enable AD Integration Features as follows:
Enable AD integration features on the CB App Control Console for domain user account login and AD-Based Policy mapping. AD-Based Policy mapping allows automatic policy assignment to be mapped to AD users, groups, computers, organizational units (OUs), etc., as configured by a CB App Control Console administrator (Figure 2‑77).
Figure 2‑77 Carbon Black App Control System Configuration
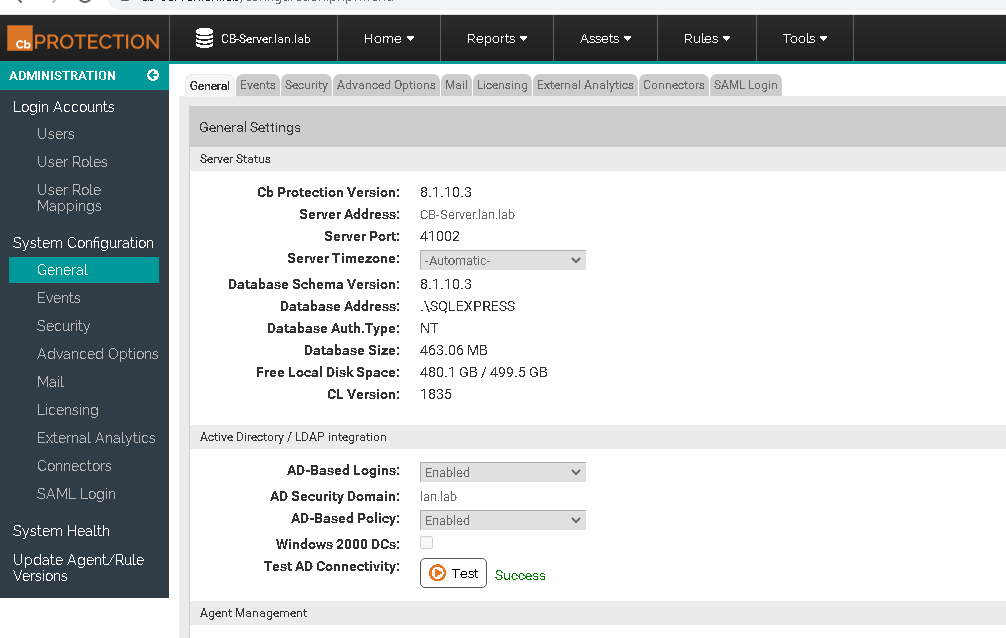
Add users from AD and assign policies:
Add “Test Users” OU from the AD to policy mapping settings and assign the “HighEnfcmt_NCCOE” policy (Figure 2‑78).
This OU includes the “nccoeUser” and “nccoeAdmin” user accounts created for the test scenarios. This policy will be automatically applied to these users logged in on any computer that is running the CB Protection Agent. The “HighEnfcmt_NCCOE” policy is set to High Enforcement level, which will actively block all unapproved or banned files, applications, or devices.
Figure 2‑78 Carbon Black App Control AD Policy Mappings
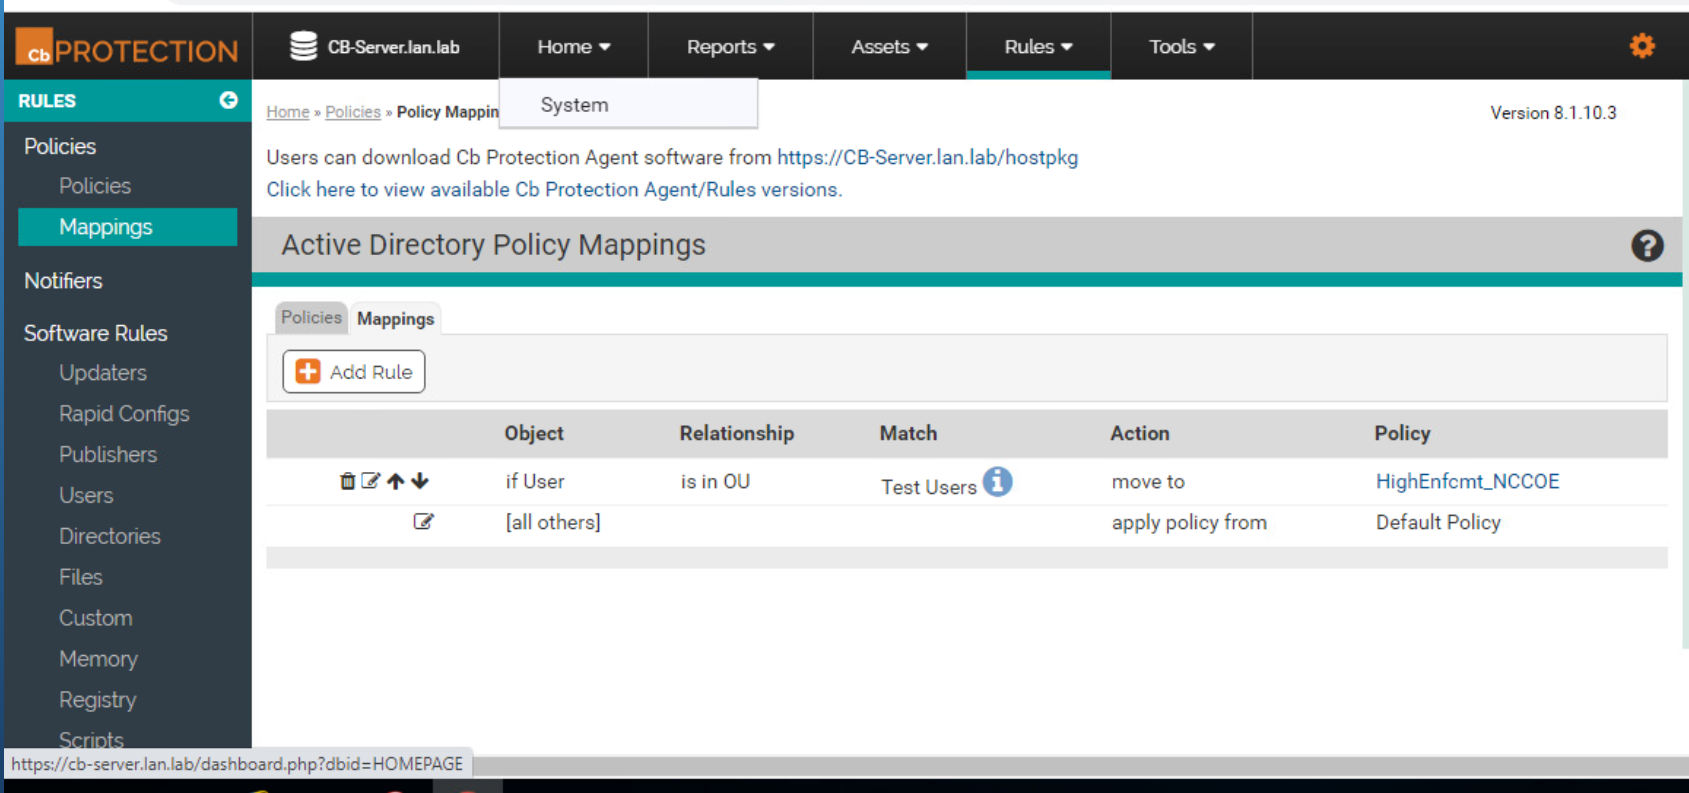
Download and install CB App Control Agent from CB App Control Server
(The process outlined below uses the CRS Engineering Workstation as an example, but the process was the same for all the agent computers.). Follow these steps:
Open the browser on the CRS Engineering Workstation and enter the URL to download the agent installer: https://CB-Server.lan.lab/hostpkg. This URL is on the Carbon Black server itself and is accessed on the local network. CB-Server.lan.lab is the full host name we gave this server during installation.
If the host cannot access CB-Server.lan.lab, update the environment DNS Server by mapping the IP address, 10.100.0.52, to CB-Server.lan.lab or add the mapping to the local host file.
Download the Windows CB App Control Agent installer from the CB App Control Server and install on the CRS Engineering Workstation (Figure 2‑79).
Figure 2‑79 Carbon Black Agent Download
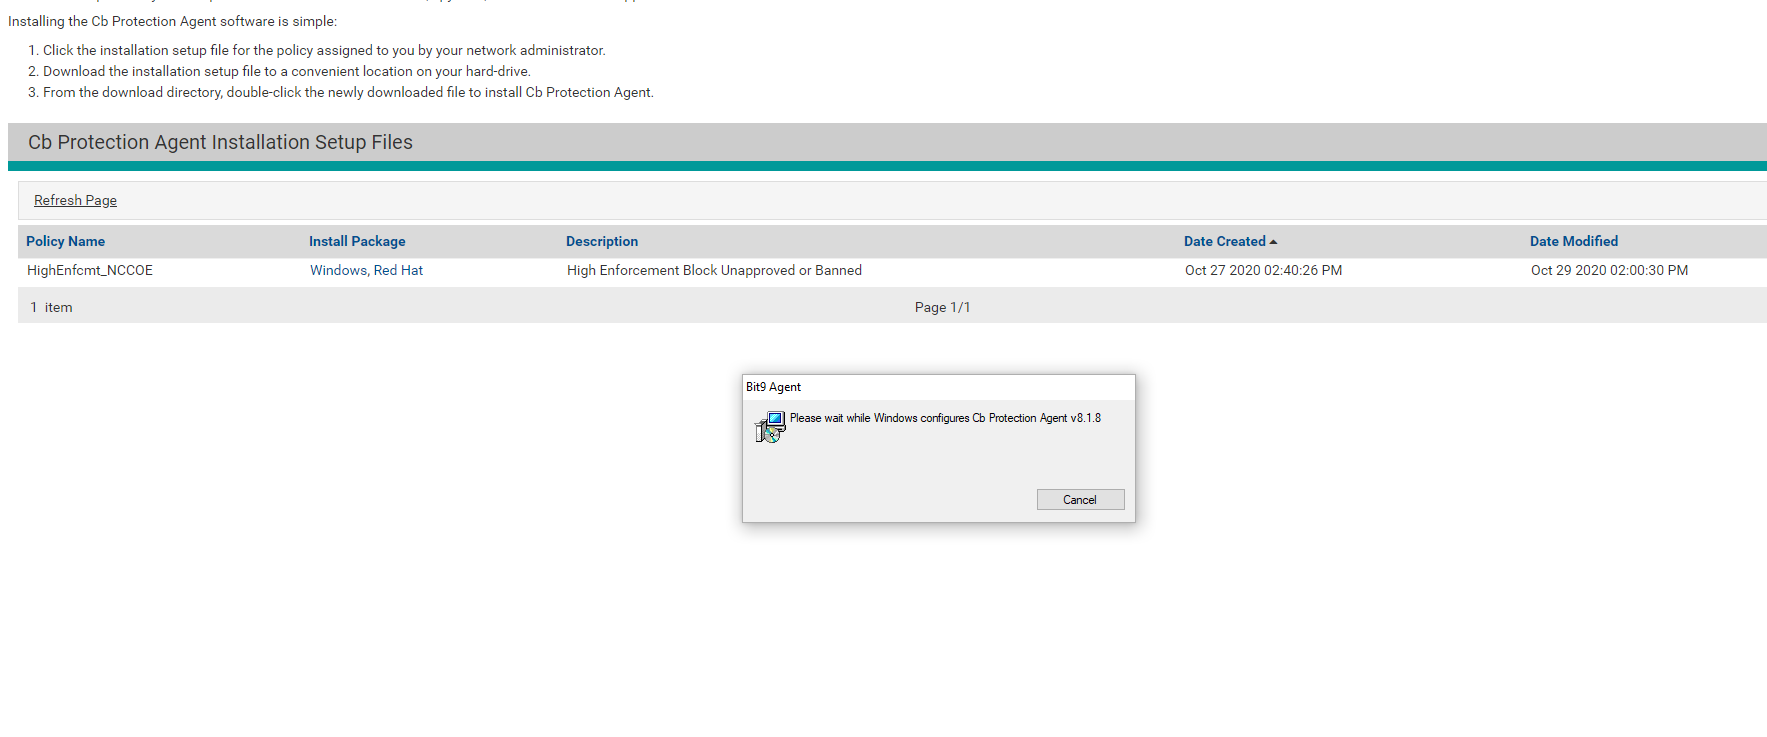
Check the CB App Control Console to verify communication and initialization of the new CRS Engineering Workstation agent computer on the CB App Control Server (Figure 2‑80).
Figure 2‑80 Carbon Black App Control Computers
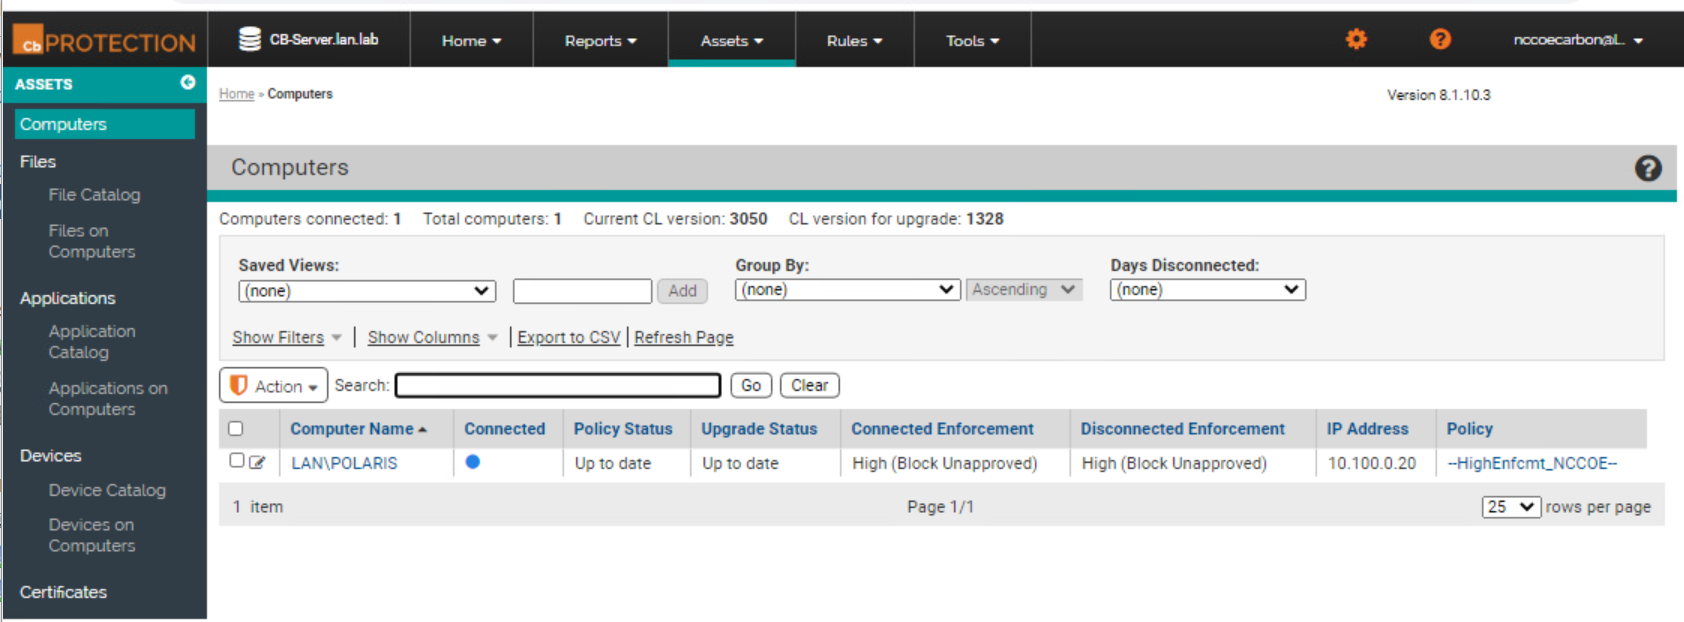
Approve all new trusted files and publishers that were added from the CRS Engineering Workstation to the catalog on the CB App Control Server.
This image (Figure 2‑81) shows the CB Protection - Files page of the CB App Control Console.
Figure 2‑81 Carbon Black App Control File Catalog
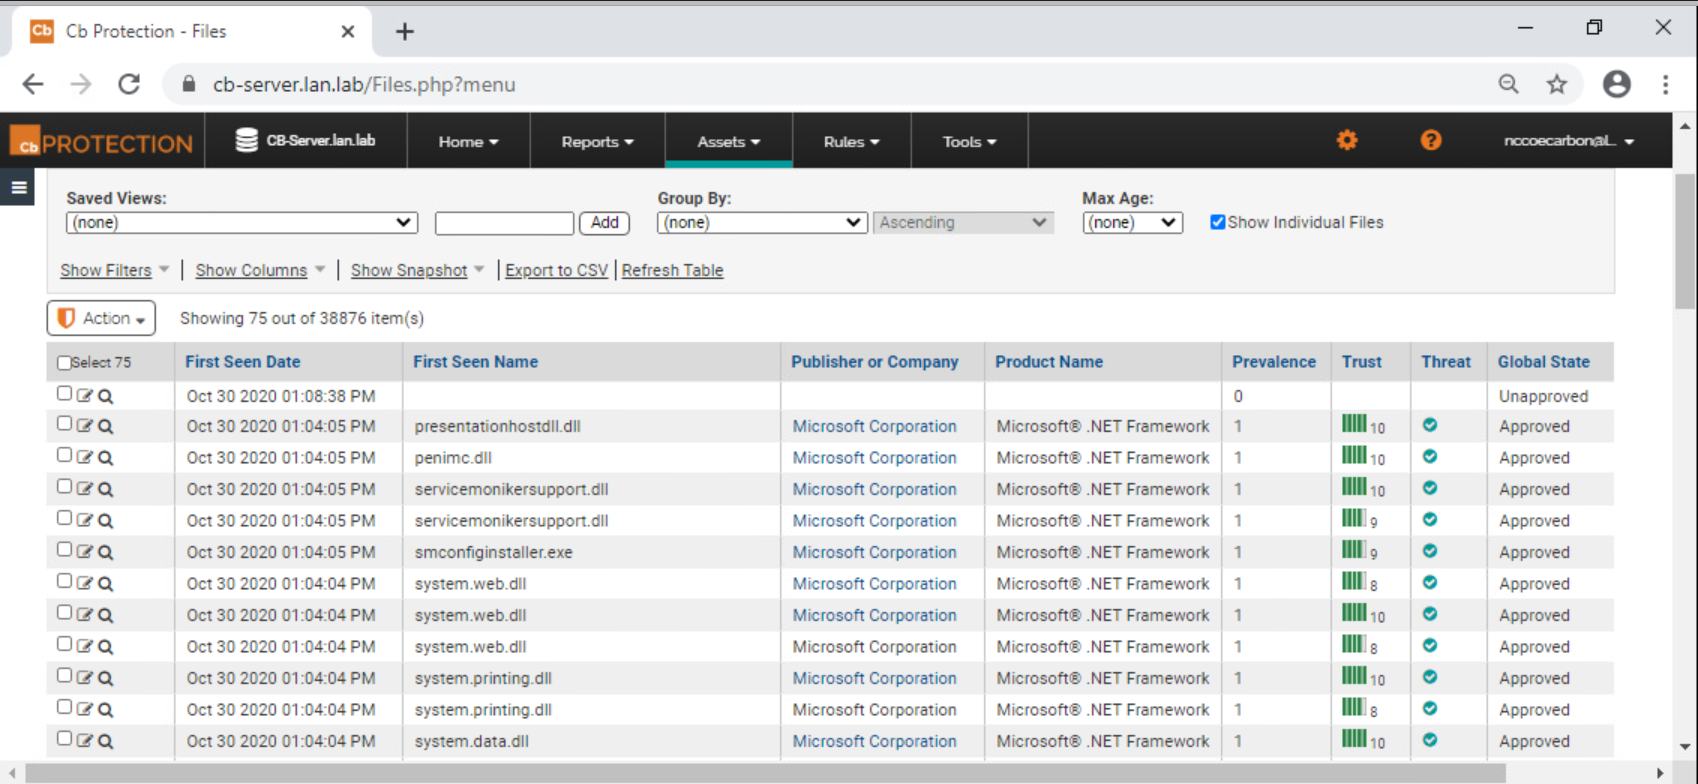
2.11 Windows Software Restriction Policy (SRP)
Windows SRP is a feature that is a part of the Windows operating system. It identifies applications that are running on any domain-controlled computer, and it can block any programs that have not been allow-listed. Configuring Windows SRP is done through group policy object management. Windows SRP was used for AAL in Builds 2 and 3.
2.11.1 Host and Network Configuration
Windows SRP configuration is established by Group Policy Objects (GPOs) located on the two AD servers. The domain controllers were common across all builds as detailed in Table 2‑30.
Table 2‑30 Windows SRP Domain Servers
Name |
System |
OS |
CPU |
Memory |
Storage |
Network |
|---|---|---|---|---|---|---|
AD (Primary) Server |
Hyper-V VM |
Windows 2012R2 |
2x vCPU |
2 GB |
45 GB |
Testbed LAN 10.100.0.17 |
AD (Secondary) Server |
Hyper-V VM |
Windows 2012R2 |
1x vCPU |
2 GB |
21 GB |
Testbed LAN 10.100.0.13 |
The following systems were configured to utilize Windows SRP for each build. Additional details for each build are available in Section 4.5 of Volume B.
Build 2 supports the testing within the PCS environment. The overall build architecture is provided in Figure B-2. The Windows SRP specific components are in Table 2‑31.
Table 2‑31 Windows SRP Build 2 Deployment
Name |
System |
OS |
CPU |
Memory |
Storage |
Network |
|---|---|---|---|---|---|---|
Windows Server |
Hyper-V VM |
Windows 2012R2 |
2x vCPU |
6 GB |
65 GB |
Testbed LAN 10.100.0.25 |
Dispel VDI |
Hyper-V VM |
Windows 2016 |
2x vCPU |
8 GB |
126 GB |
DMZ LAN 10.100.1.61 |
DMZ Historian |
Hyper-V VM |
Windows 2016 |
4x vCPU |
8 GB |
80 GB, 171 GB |
DMZ LAN 10.100.1.4 |
Engineering Workstation |
HP Z230 Workstation |
Windows 7 |
Intel i5-4570 |
16 GB |
465 GB |
172.16.3.10 |
HMI Host |
Generic |
Windows 7 |
Intel i5-4590 |
8 GB |
233 GB |
PCS VLAN 1 172.16.1.4 |
Build 3 supports the testing within the CRS environment. The overall build architecture is provided in Figure B-3. The Windows SRP specific components are in Table 2‑32.
Table 2‑32 Windows SRP Build 3 Deployment
Name |
System |
OS |
CPU |
Memory |
Storage |
Network |
|---|---|---|---|---|---|---|
Windows Server |
Hyper-V VM |
Windows 2012R2 |
2x vCPU |
6 GB |
65 GB |
Testbed LAN 10.100.0.25 |
DMZ Historian |
Hyper-V VM |
Windows 2016 |
4x vCPU |
8 GB |
80 GB, 171 GB |
DMZ LAN 10.100.1.4 |
Engineering Workstation |
Dell T5610 |
Windows 10 |
2x Intel E3-2609 v2 |
16 GB |
465 GB |
CRS Supervisory LAN 192.168.0.20 |
CRS Local Historian |
Hyper-V VM |
Windows 2016 |
4x vCPU |
16 GB |
80 GB, 171 GB |
CRS Supervisory LAN 192.168.0.21 |
2.11.2 Installation
Windows SRP is a feature of the Windows operating system and therefore did not require any specific installation for use in the project.
2.11.3 Configuration
The Windows SRP configuration required setting GPOs on the AD servers to enable the policy on all hosts that were part of the Windows domain. Additionally, hosts that were not part of the Windows domain had GPO settings configured locally to the host. Follow these steps to configure AD with user accounts and set enforcement policies:
Set up AD with a “Test User” OU and add the NCCOE User (nccoeUser) and Admin (nccoeAdmin) accounts for this project to the OU.
To allow the NCCOE Admin account to be included as a local administrator within the environment, modify the Default Domain GPO to add administrators to the Restricted Group and include the NCCOE Admin account.
To support applying GPOs as local settings to non-domain computers, download LGPO.zip from Microsoft Security Compliance Toolkit 1.0 available at https://www.microsoft.com/en-us/download/details.aspx?id=55319.
Review the National Security Agency (NSA) Guidance for Application Whitelisting using Software Restriction Policies and Guidelines for Application Whitelisting ICSs available at https://www.iad.gov/iad/library/reports/application-whitelisting-using-srp.cfm and https://www.iad.gov/iad/library/ia-guidance/security-configuration/industrial-control-systems/guidelines-for-application-whitelisting-industrial-control-systems.cfm respectively.
Create the Windows SRP GPO with the following settings:
From the Enforcement Properties dialog (Figure 2‑82):
Select the All Software Files radio button.
Select the All Users radio button.
Figure 2‑82 Setting Enforcement Properties
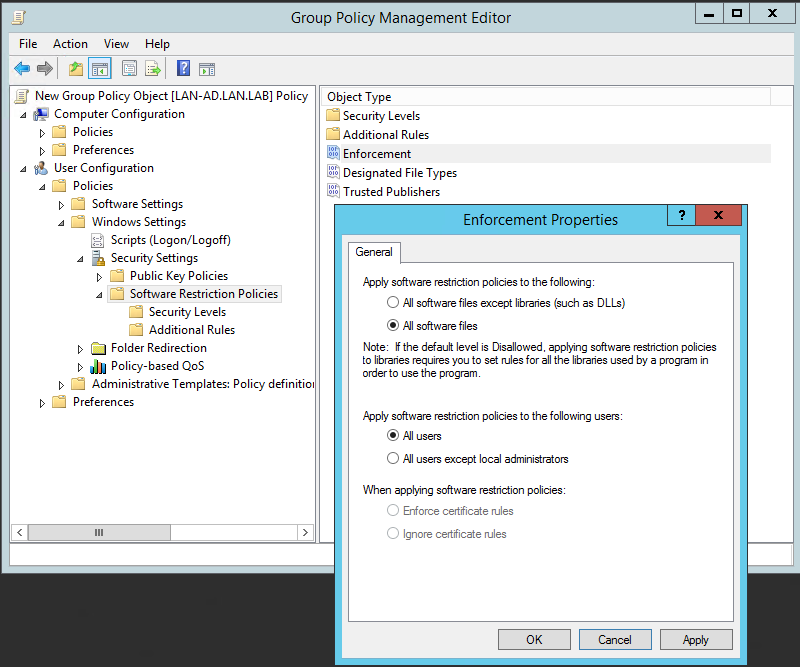
In the Group Policy Management Editor, in the Security Levels folder:
Double-click the Disallowed security level to open the Disallowed Properties window.
Click the Set as Default radio button (Figure 2‑83) to configure SRP in allowlist mode. After completing this step, only programs in the paths specified by the environment variables SYSTEMROOT (typically C:Windows), PROGRAMFILES (C:Program Files), and PROGRAMFILES(x86) (C:Program Files (x86)) are permitted to execute. These path rules are automatically added when the “Disallowed” security level is set as the default.
Figure 2‑83 Setting Security Level Default
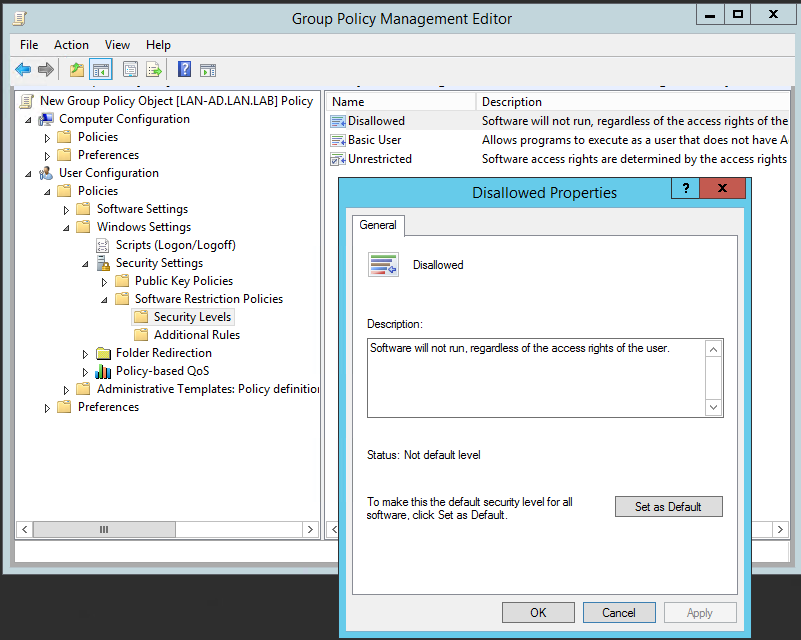
Customize the Allowlist Rules to enhance security by disallowing specific subfolders in the default allowed paths and to support organization application requirements.
Click the Additional Rules folder and apply the rules shown in Figure 2‑84. This figure combines the NSA recommended path settings in addition to lab application requirements and for disabling installers and other executable content as indicated in the comments. Organizations should audit their environments to determine the appropriate rules to define within the policy.
Figure 2‑84 Additional Rules Defined for Lab Environment
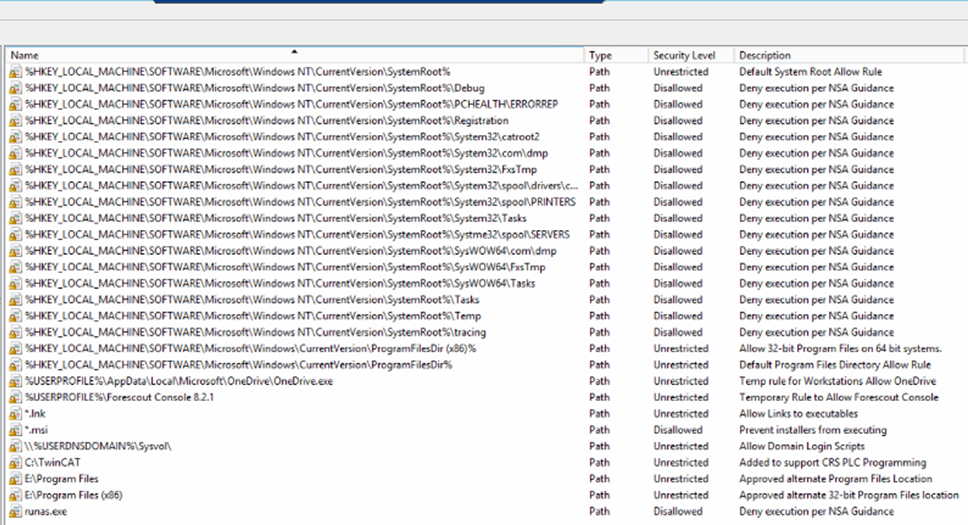
Link the GPO to the Test User OU:
In the Group Policy Management tool, right click the “Test User” OU and select Link an Existing GPO from the pop-up menu (Figure 2‑85).
Figure 2‑85 Menu Options for Accessing the Link an Existing GPO Option
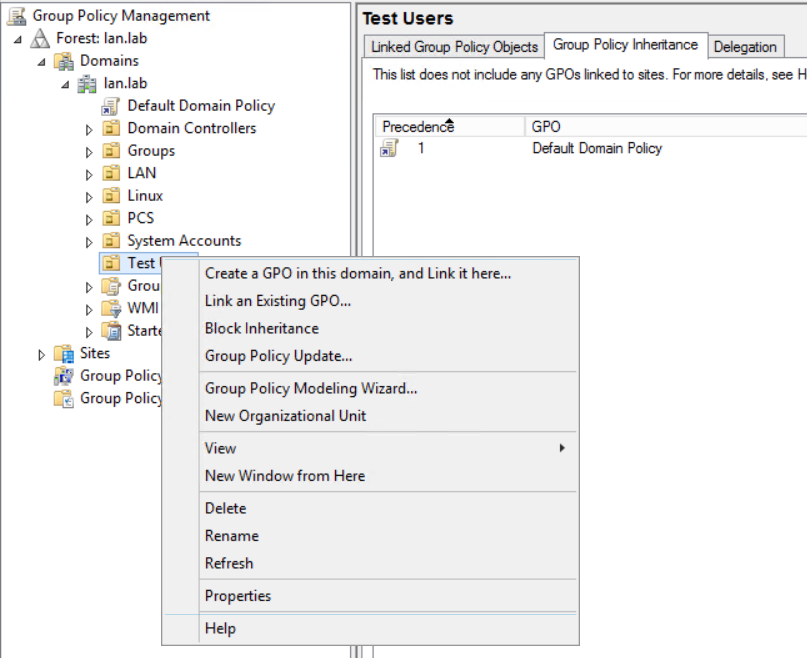
In the dialog box, select the Windows SRP GPO Object from the list and click OK (Figure 2‑86).
Figure 2‑86 Dialog Box for Selecting GPO to Link
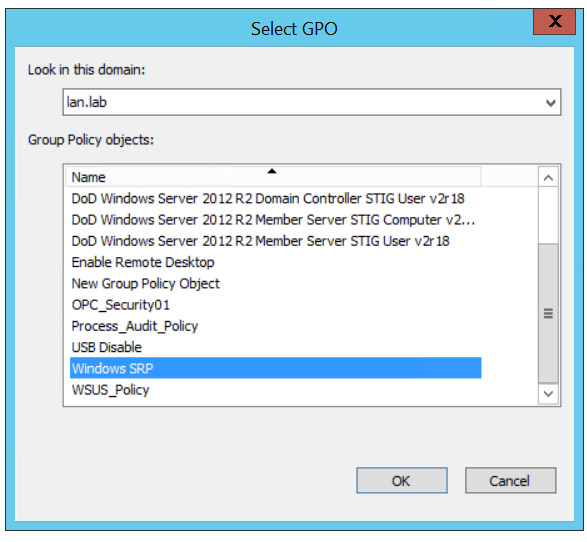
(Optional) Install GPO as the local policy on non-domain systems; for systems that are not joined to the domain, the nccoeUser and nccoeAdmin accounts are created as local user and administrator accounts, respectively. Additionally, the Windows SRP GPO is manually applied to the local system using the LGPO.exe application contained in the ZIP file from Step 3.
Create a Backup of the Windows SRP GPO Object:
From the Group Policy Manager, select the Group Policy Objects folder and right-click on the Windows SRP GPO object.
Select the Back Up… option from the pop-up menu.
In the dialog box, choose a destination location such as C:Backup GPO Folder or some other convenient location to place the files and click Back Up.
Copy the LGPO.exe along with the files created in the previous step to the non-domain computer system.
Login as an administrator on the non-domain computer and navigate to the {GUID}DomainSysvolGPOUser folder, which should contain the registory.pol file for the GPO.
Execute the following commands to apply the settings to the local nccoeUser and nccoeAdmin accounts:
lgpo.exe /u:nccoeUser registory.pol
lgpo.exe /u:nccoeAdmin registory.pol