NIST SPECIAL PUBLICATION 1800-30C
Securing Telehealth Remote Patient Monitoring Ecosystem
Volume C:
How-to Guides
Jennifer Cawthra*
Nakia Grayson
Ronald Pulivarti
National Cybersecurity Center of Excellence
National Institute of Standards and Technology
Bronwyn Hodges
Jason Kuruvilla*
Kevin Littlefield
Sue Wang
Ryan Williams*
Kangmin Zheng
The MITRE Corporation
McLean, Virginia
*Former employee; all work for this publication done while at employer.
February 2022
FINAL
This publication is available free of charge from https://doi.org/10.6028/NIST.SP.1800-30
The second draft of this publication is available free of charge from https://www.nccoe.nist.gov/sites/default/files/legacy-files/rpm-nist-sp1800-30-2nd-draft.pdf

DISCLAIMER
Certain commercial entities, equipment, products, or materials may be identified by name or company logo or other insignia in order to acknowledge their participation in this collaboration or to describe an experimental procedure or concept adequately. Such identification is not intended to imply special status or relationship with NIST or recommendation or endorsement by NIST or NCCoE; neither is it intended to imply that the entities, equipment, products, or materials are necessarily the best available for the purpose.
While NIST and the NCCoE address goals of improving management of cybersecurity and privacy risk through outreach and application of standards and best practices, it is the stakeholder’s responsibility to fully perform a risk assessment to include the current threat, vulnerabilities, likelihood of a compromise, and the impact should the threat be realized before adopting cybersecurity measures such as this recommendation.
National Institute of Standards and Technology Special Publication 1800-30C, Natl. Inst. Stand. Technol. Spec. Publ. 1800-30C, 171 pages, February 2022, CODEN: NSPUE2
FEEDBACK
As a private-public partnership, we are always seeking feedback on our practice guides. We are particularly interested in seeing how businesses apply NCCoE reference designs in the real world. If you have implemented the reference design, or have questions about applying it in your environment, please email us at hit_nccoe@nist.gov.
All comments are subject to release under the Freedom of Information Act.
NATIONAL CYBERSECURITY CENTER OF EXCELLENCE
The National Cybersecurity Center of Excellence (NCCoE), a part of the National Institute of Standards and Technology (NIST), is a collaborative hub where industry organizations, government agencies, and academic institutions work together to address businesses’ most pressing cybersecurity issues. This public-private partnership enables the creation of practical cybersecurity solutions for specific industries, as well as for broad, cross-sector technology challenges. Through consortia under Cooperative Research and Development Agreements (CRADAs), including technology partners—from Fortune 50 market leaders to smaller companies specializing in information technology security—the NCCoE applies standards and best practices to develop modular, adaptable example cybersecurity solutions using commercially available technology. The NCCoE documents these example solutions in the NIST Special Publication 1800 series, which maps capabilities to the NIST Cybersecurity Framework and details the steps needed for another entity to re-create the example solution. The NCCoE was established in 2012 by NIST in partnership with the State of Maryland and Montgomery County, Maryland.
NIST CYBERSECURITY PRACTICE GUIDES
NIST Cybersecurity Practice Guides (Special Publication 1800 series) target specific cybersecurity challenges in the public and private sectors. They are practical, user-friendly guides that facilitate the adoption of standards-based approaches to cybersecurity. They show members of the information security community how to implement example solutions that help them align with relevant standards and best practices and provide users with the lists of materials, configuration files, and other information they need to implement a similar approach.
The documents in this series describe example implementations of cybersecurity practices that businesses and other organizations may voluntarily adopt. These documents do not describe regulations or mandatory practices, nor do they carry statutory authority.
ABSTRACT
Increasingly, healthcare delivery organizations (HDOs) are relying on telehealth and remote patient monitoring (RPM) capabilities to treat patients at home. RPM is convenient and cost-effective, and its adoption rate has increased. However, without adequate privacy and cybersecurity measures, unauthorized individuals may expose sensitive data or disrupt patient monitoring services.
RPM solutions engage multiple actors as participants in a patient’s clinical care. These actors include HDOs, telehealth platform providers, and the patients themselves. Each participant uses, manages, and maintains different technology components within an interconnected ecosystem, and each is responsible for safeguarding their piece against unique threats and risks associated with RPM technologies.
This practice guide assumes that the HDO engages with a telehealth platform provider that is a separate entity from the HDO and patient. The telehealth platform provider manages a distinct infrastructure, applications, and set of services. The telehealth platform provider coordinates with the HDO to provision, configure, and deploy the RPM components to the patient home and assures secure communication between the patient and clinician.
The NCCoE analyzed risk factors regarding an RPM ecosystem by using risk assessment based on the NIST Risk Management Framework. The NCCoE also leveraged the NIST Cybersecurity Framework, NIST Privacy Framework, and other relevant standards to identify measures to safeguard the ecosystem. In collaboration with healthcare, technology, and telehealth partners, the NCCoE built an RPM ecosystem in a laboratory environment to explore methods to improve the cybersecurity of an RPM.
Technology solutions alone may not be sufficient to maintain privacy and security controls on external environments. This practice guide notes the application of people, process, and technology as necessary to implement a holistic risk mitigation strategy.
This practice guide’s capabilities include helping organizations assure the confidentiality, integrity, and availability of an RPM solution, enhancing patient privacy and limiting HDO risk when implementing an RPM solution.
KEYWORDS
access control; authentication; authorization; behavioral analytics; cloud storage; data privacy; data security; encryption; HDO; healthcare; healthcare delivery organization; remote patient monitoring; RPM; telehealth
ACKNOWLEDGMENTS
We are grateful to the following individuals for their generous contributions of expertise and time.
Name |
Organization |
|---|---|
Alex Mohseni |
Accuhealth |
Stephen Samson |
Accuhealth |
Brian Butler |
Cisco |
Matthew Hyatt |
Cisco |
Kevin McFadden |
Cisco |
Peter Romness |
Cisco |
Steven Dean |
Inova Health System |
Zach Furness |
Inova Health System |
James Carder |
LogRhythm |
Brian Coulson |
LogRhythm |
Steven Forsyth |
LogRhythm |
Jake Haldeman |
LogRhythm |
Andrew Hollister |
LogRhythm |
Zack Hollister |
LogRhythm |
Dan Kaiser |
LogRhythm |
Sally Vincent |
LogRhythm |
Vidya Murthy |
MedCrypt |
Axel Wirth |
MedCrypt |
Stephanie Domas |
MedSec |
Garrett Sipple |
MedSec |
Nancy Correll |
The MITRE Corporation |
Spike Dog |
The MITRE Corporation |
Robin Drake |
The MITRE Corporation |
Sallie Edwards |
The MITRE Corporation |
Donald Faatz |
The MITRE Corporation |
Nedu Irrechukwu |
The MITRE Corporation |
Karri Meldorf |
The MITRE Corporation |
Stuart Shapiro |
The MITRE Corporation |
John Dwyier |
Onclave Networks, Inc. (Onclave) |
Chris Grodzickyj |
Onclave |
Marianne Meins |
Onclave |
Dennis Perry |
Onclave |
Christina Phillips |
Onclave |
Robert Schwendinger |
Onclave |
James Taylor |
Onclave |
Chris Jensen |
Tenable |
Joshua Moll |
Tenable |
Jeremiah Stallcup |
Tenable |
Julio C. Cespedes |
The University of Mississippi Medical Center |
Saurabh Chandra |
The University of Mississippi Medical Center |
Donald Clark |
The University of Mississippi Medical Center |
Alan Jones |
The University of Mississippi Medical Center |
Kristy Simms |
The University of Mississippi Medical Center |
Richard Summers |
The University of Mississippi Medical Center |
Steve Waite |
The University of Mississippi Medical Center |
Dele Atunrase |
Vivify Health |
Aaron Gatz |
Vivify Health |
Michael Hawkins |
Vivify Health |
Robin Hill |
Vivify Health |
Dennis Leonard |
Vivify Health |
David Norman |
Vivify Health |
Bill Paschall |
Vivify Health |
Eric Rock |
Vivify Health |
Alan Stryker |
Vivify Health |
Dave Sutherland |
Vivify Health |
Michael Tayler |
Vivify Health |
The Technology Partners/Collaborators who participated in this build submitted their capabilities in response to a notice in the Federal Register. Respondents with relevant capabilities or product components were invited to sign a Cooperative Research and Development Agreement (CRADA) with NIST, allowing them to participate in a consortium to build this example solution. We worked with:
Technology Partner/Collaborator |
Build Involvement |
|---|---|
Accuhealth Evelyn |
|
Cisco Firepower Version 6.3.0 Cisco Umbrella Cisco Stealthwatch Version 7.0.0 |
|
subject matter expertise |
|
LogRhythm XDR Version 7.4.9 LogRhythm NetworkXDR Version 4.0.2 |
|
subject matter expertise |
|
subject matter expertise |
|
Onclave Zero Trust Platform Version 1.1.0 |
|
Tenable.sc Vulnerability Management Version 5.13.0 with Nessus |
|
subject matter expertise |
|
Vivify Pathways Home Vivify Pathways Care Team Portal |
DOCUMENT CONVENTIONS
The terms “shall” and “shall not” indicate requirements to be followed strictly to conform to the publication and from which no deviation is permitted. The terms “should” and “should not” indicate that among several possibilities, one is recommended as particularly suitable without mentioning or excluding others, or that a certain course of action is preferred but not necessarily required, or that (in the negative form) a certain possibility or course of action is discouraged but not prohibited. The terms “may” and “need not” indicate a course of action permissible within the limits of the publication. The terms “can” and “cannot” indicate a possibility and capability, whether material, physical, or causal.
PATENT DISCLOSURE NOTICE
NOTICE: The Information Technology Laboratory (ITL) has requested that holders of patent claims whose use may be required for compliance with the guidance or requirements of this publication disclose such patent claims to ITL. However, holders of patents are not obligated to respond to ITL calls for patents and ITL has not undertaken a patent search in order to identify which, if any, patents may apply to this publication.
As of the date of publication and following call(s) for the identification of patent claims whose use may be required for compliance with the guidance or requirements of this publication, no such patent claims have been identified to ITL.
No representation is made or implied by ITL that licenses are not required to avoid patent infringement in the use of this publication.
List of Figures
Figure 2‑1 RPM Communications Paths
1 Introduction
The following volumes of this guide show information technology (IT) professionals and security engineers how we implemented this example solution. We cover all of the products employed in this reference design. We do not recreate the product manufacturers’ documentation, which is presumed to be widely available. Rather, these volumes show how we incorporated the products together in our environment.
Note: These are not comprehensive tutorials. There are many possible service and security configurations for these products that are out of scope for this reference design.
1.1 How-To Guide
This National Institute of Standards and Technology (NIST) Cybersecurity Practice Guide demonstrates a standards-based reference design and provides users with the information they need to replicate the telehealth remote patient monitoring (RPM) environment. This reference design is modular and can be deployed in whole or in part.
This guide contains three volumes:
NIST SP 1800-30A: Executive Summary
NIST SP 1800-30B: Approach, Architecture, and Security Characteristics–what we built and why
NIST SP 1800-30C: How-To Guides–instructions for building the example solution (you are here)
Depending on your role in your organization, you might use this guide in different ways:
Business decision makers, including chief security and technology officers, will be interested in the Executive Summary, NIST SP 1800-30A, which describes the following topics:
challenges that enterprises face in securing the remote patient monitoring ecosystem
example solution built at the NCCoE
benefits of adopting the example solution
Technology or security program managers who are concerned with how to identify, understand, assess, and mitigate risk will be interested in NIST SP 1800-30B, which describes what we did and why. The following sections will be of particular interest:
Section 3.4, Risk Assessment, describes the risk analysis we performed.
Section 3.5, Security Control Map, maps the security characteristics of this example solution to cybersecurity standards and best practices.
You might share the Executive Summary, NIST SP 1800-30A, with your leadership team members to help them understand the importance of adopting standards-based commercially available technologies that can help secure the RPM ecosystem.
IT professionals who want to implement an approach like this will find this whole practice guide useful. You can use this How-To portion of the guide, NIST SP 1800-30C, to replicate all or parts of the build created in our lab. This How-To portion of the guide provides specific product installation, configuration, and integration instructions for implementing the example solution. We do not recreate the product manufacturers’ documentation, which is generally widely available. Rather, we show how we incorporated the products together in our environment to create an example solution.
This guide assumes that IT professionals have experience implementing security products within the enterprise. While we have used a suite of commercial products to address this challenge, this guide does not endorse these particular products. Your organization can adopt this solution or one that adheres to these guidelines in whole, or you can use this guide as a starting point for tailoring and implementing parts of the National Cybersecurity Center of Excellences’ (NCCoE’s) risk assessment and deployment of a defense-in-depth strategy in a distributed RPM solution. Your organization’s security experts should identify the products that will best integrate with your existing tools and IT system infrastructure. We hope that you will seek products that are congruent with applicable standards and best practices. Section 3.6, Technologies, lists the products that we used and maps them to the cybersecurity controls provided by this reference solution.
A NIST Cybersecurity Practice Guide does not describe “the” solution but a possible solution. We seek feedback on its contents and welcome your input. Comments, suggestions, and success stories will improve subsequent versions of this guide. Please contribute your thoughts to hit_nccoe@nist.gov.
Acronyms used in figures are in the List of Acronyms appendix.
1.2 Build Overview
The NCCoE constructed a virtual lab environment to evaluate ways to implement security capabilities across an RPM ecosystem, which consists of three separate domains: patient home, telehealth platform provider, and healthcare delivery organization (HDO). The project implements virtual environments for the HDO and patient home while collaborating with a telehealth platform provider to implement a cloud-based telehealth RPM environment. The telehealth environments contain simulated patient data that portray relevant cases that clinicians could encounter in real-world scenarios. The project then applies security controls to the virtual environments. Refer to NIST Special Publication (SP) 1800-30B, Section 5, Security and Privacy Characteristic Analysis, for an explanation of why we used each technology.
1.3 Typographic Conventions
The following table presents typographic conventions used in this volume.
Typeface/ Symbol |
Meaning |
Example |
|---|---|---|
Italics |
file names and path names; references to documents that are not hyperlinks; new terms; and placeholders |
For language use and style guidance, see the NCCoE Style Guide. |
Bold |
names of menus, options, command buttons, and fields |
Choose File > Edit. |
Monospace |
command-line input, onscreen computer output, sample code examples, and status codes |
|
Monospace (block) |
multi-line input, on-screen computer output, sample code examples, status codes |
% mkdir -v nccoe_projects
mkdir: created directory 'nccoe_projects'
|
blue text |
link to other parts of the document, a web URL, or an email address |
All publications from NIST’s NCCoE are available at https://www.nccoe.nist.gov. |
1.4 Logical Architecture Summary
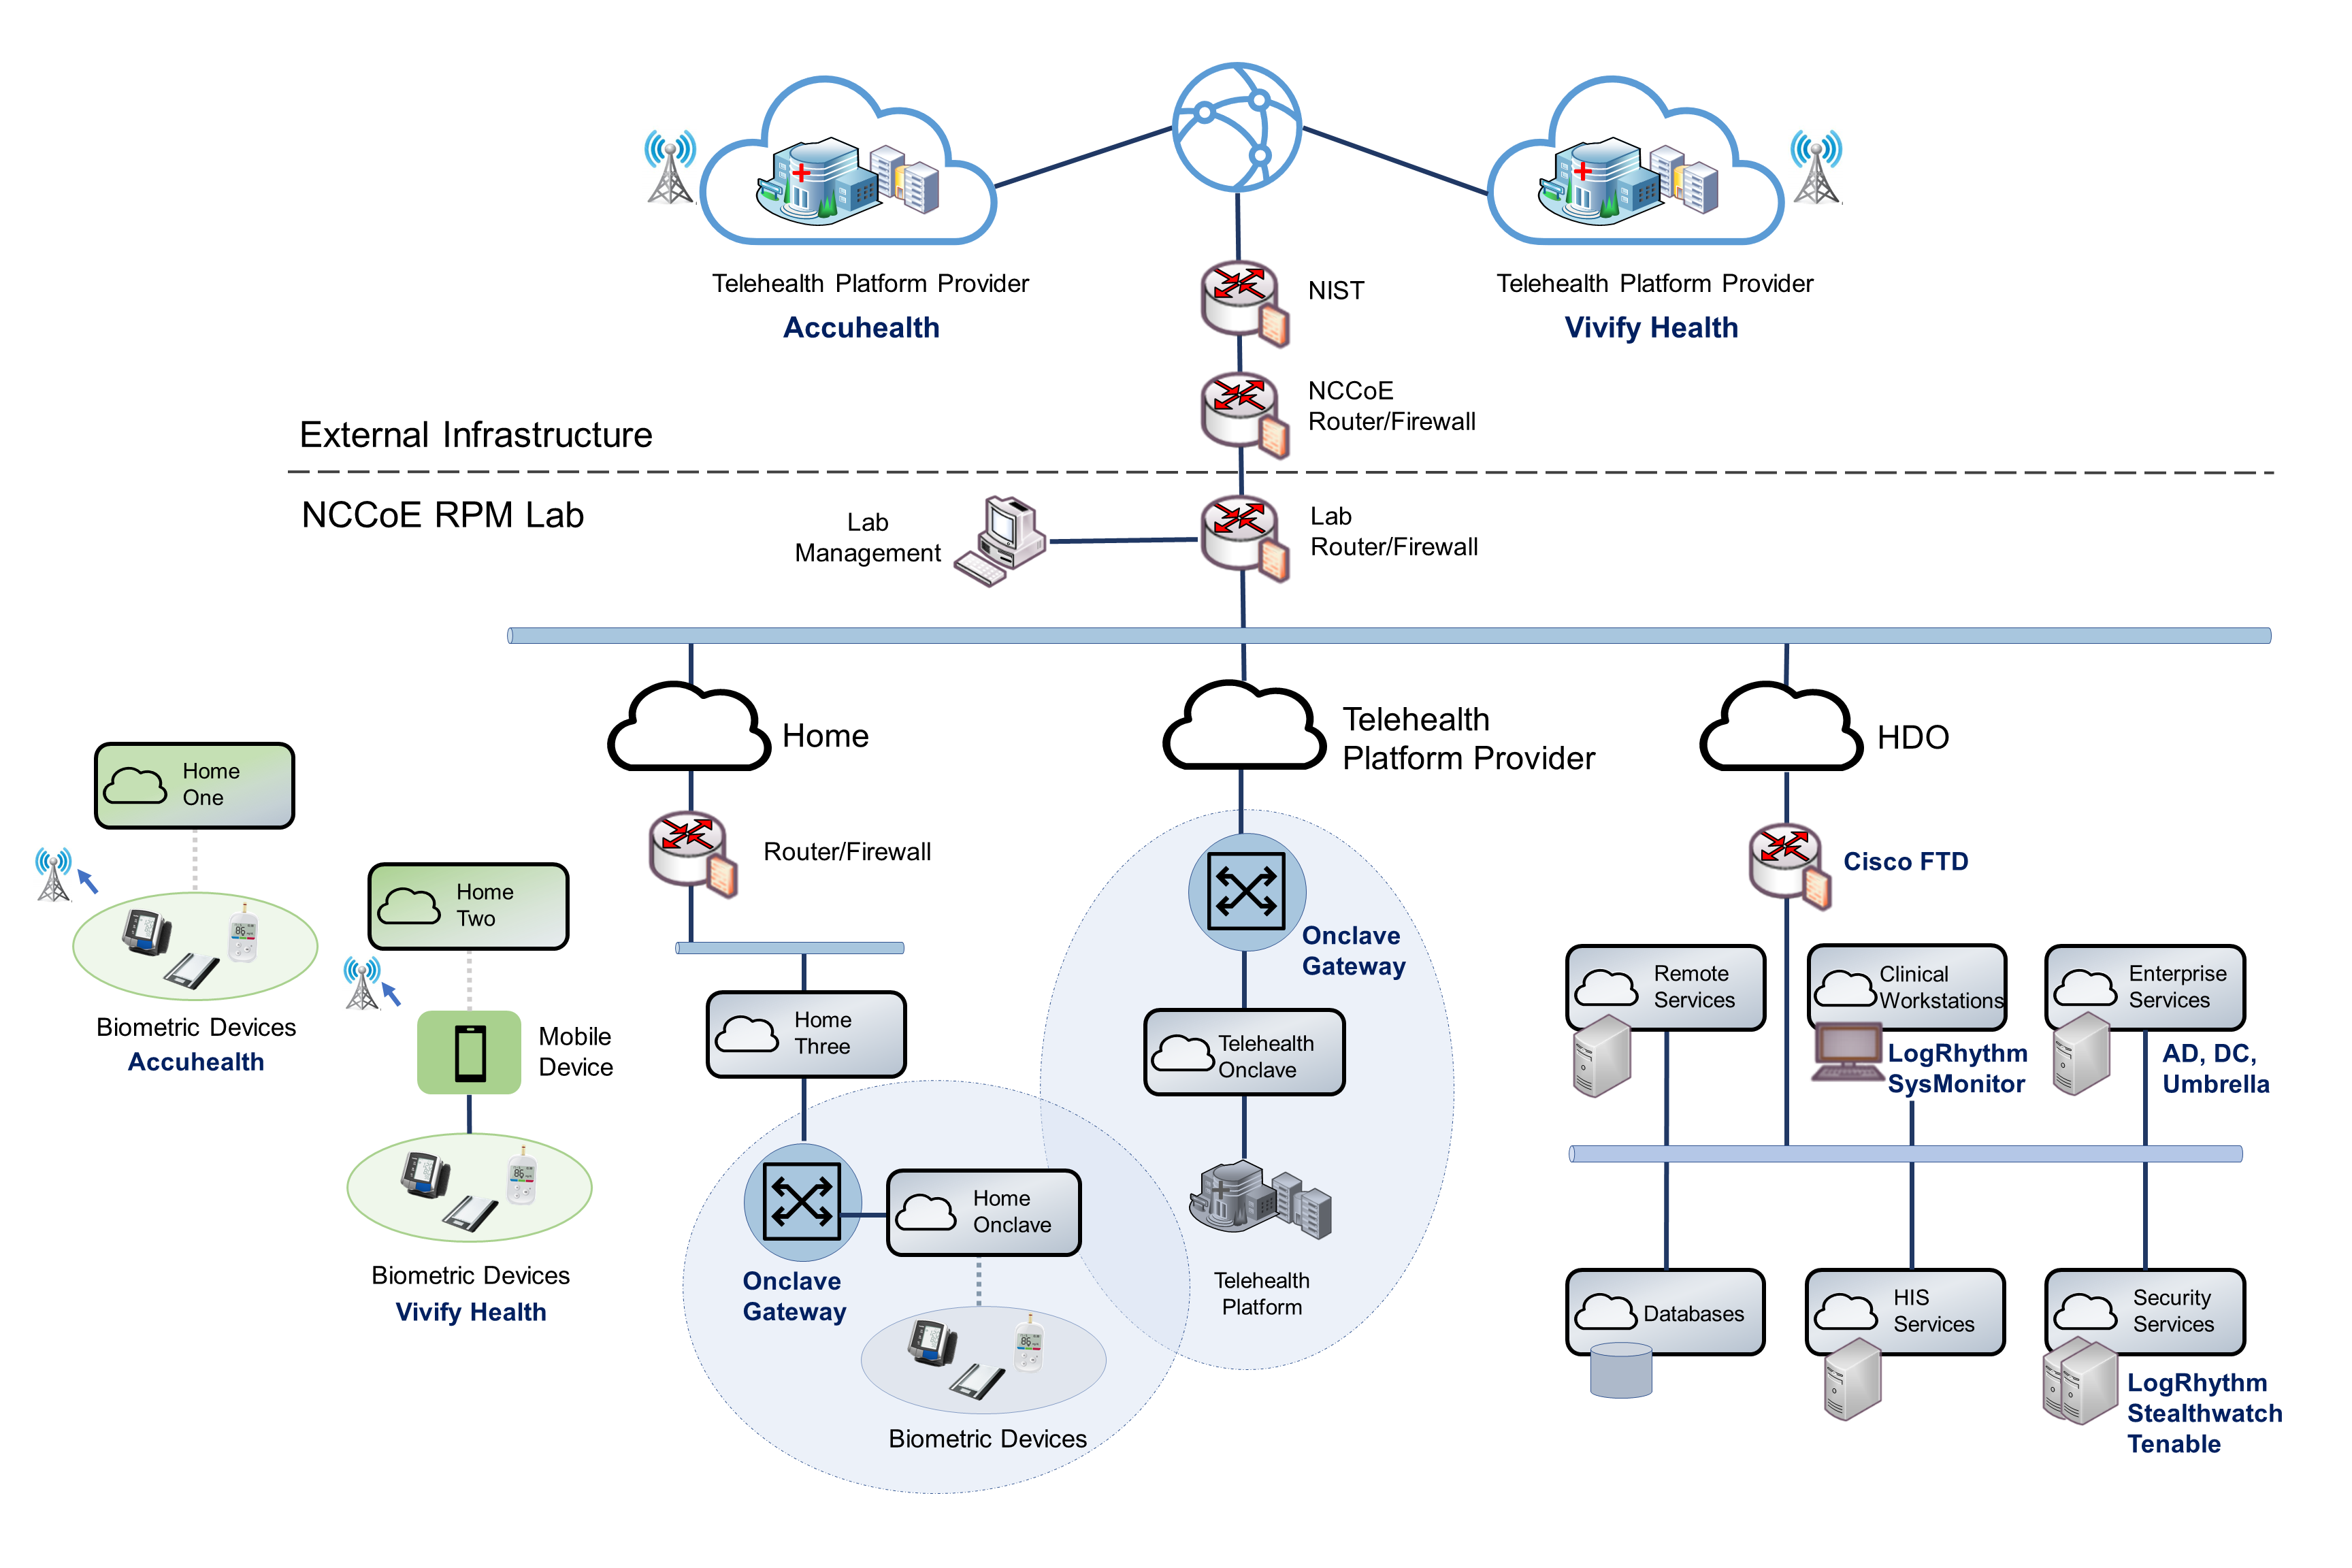
Figure 1‑1 illustrates the reference network architecture implemented in the NCCoE virtual environment, initially presented in NIST SP 1800-30B, Section 4.5, Final Architecture. The HDO environment utilizes network segmenting similar to the architecture segmentation used in NIST SP 1800-24, Securing Picture Archiving and Communication System (PACS) [C1]. The telehealth platform provider is a vendor-managed cloud environment that facilitates data transmissions and communications between the patient home and the HDO. Patient home environments have a minimalistic structure, which incorporates the devices provided by the telehealth platform provider.
Figure 1‑1 Final Architecture
2 Product Installation Guide
This section of the practice guide contains detailed instructions for installing and configuring all the products used to build an instance of the example solution. The project team implemented several capabilities that included deploying components received from telehealth platform providers and components that represent the HDO. The telehealth platform providers provisioned biometric devices that were deployed to a patient home environment. Within the HDO, the engineers deployed network infrastructure devices to implement network zoning and configure perimeter devices. The engineers also deployed security capabilities that supported vulnerability management and a security incident and event management (SIEM) tool. The following sections detail deployment and configuration of these components.
2.1 Telehealth Platform Provider
The project team implemented a model where an HDO partners with telehealth platform providers to enable RPM programs. Telehealth platform providers are third parties that, for this practice guide, configured, deployed, and managed biometric devices and mobile devices (e.g., tablets) that were sent to the patient home. The telehealth platform provider managed data communications over cellular and broadband where patients send biometric data to the telehealth platform provider. The telehealth platform provider implemented an application that allowed clinicians to access the biometric data.
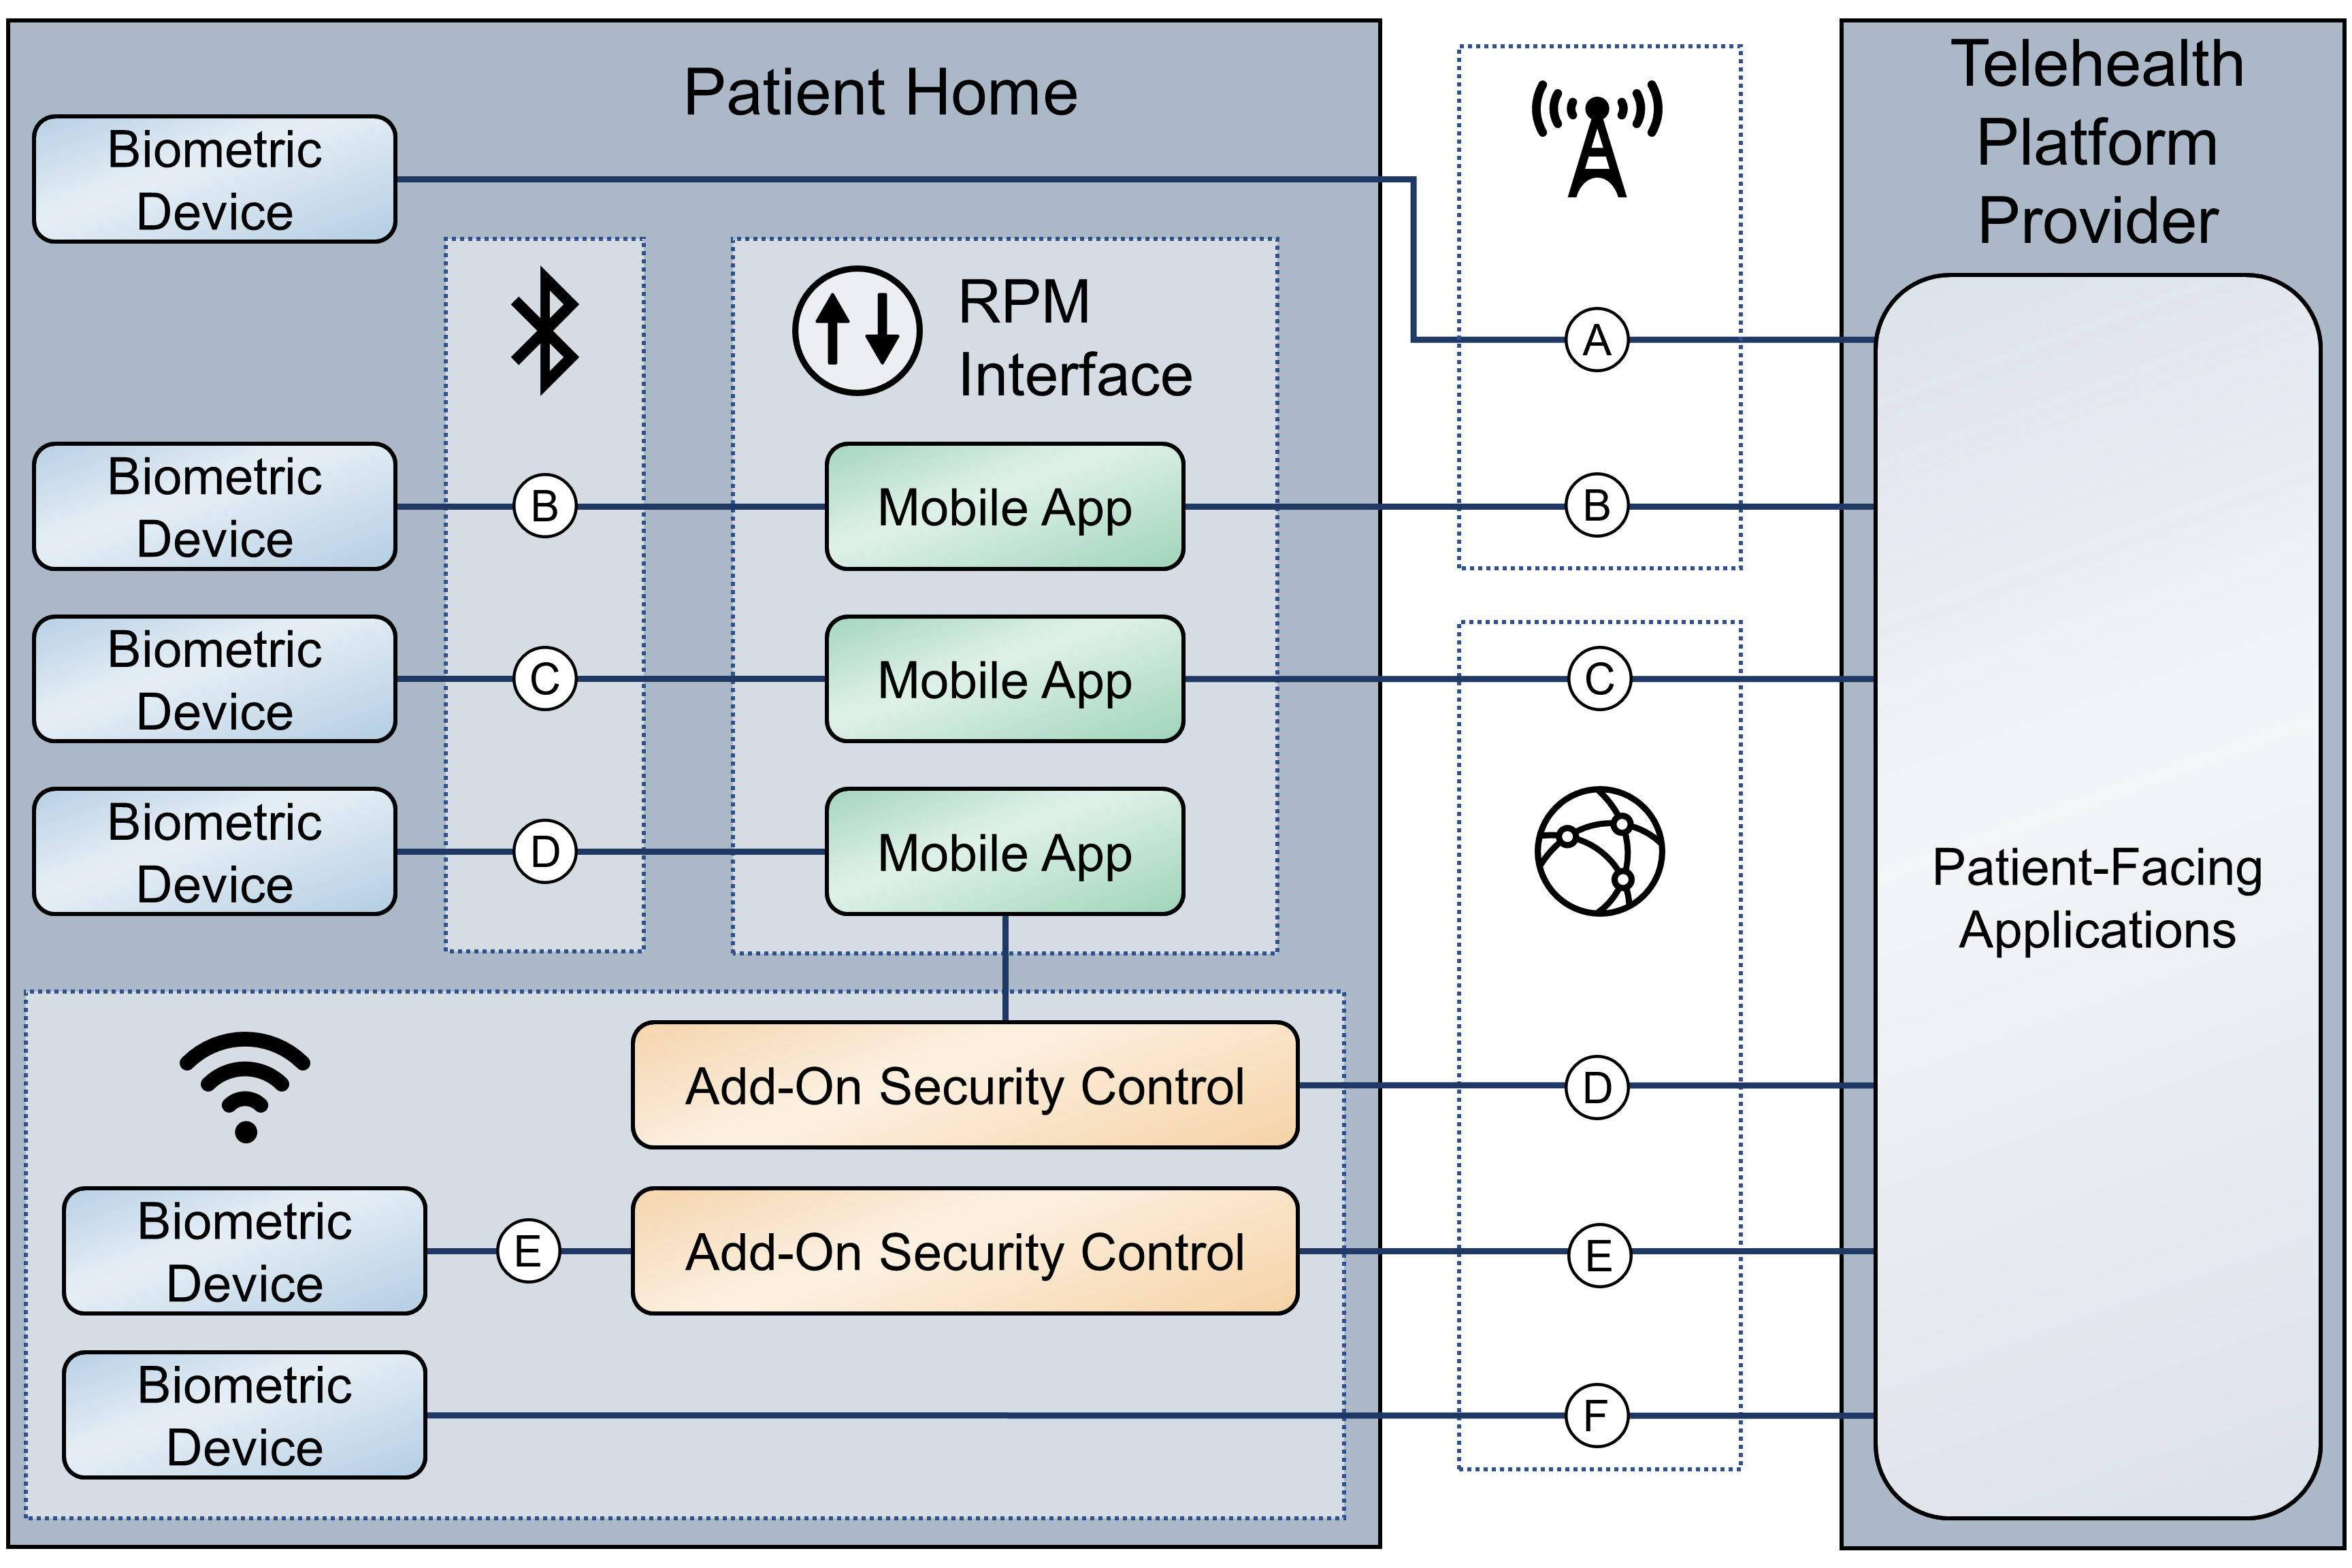
The team collaborated with two independent telehealth platform providers. Collaborating with two unique platforms enabled the team to apply NIST’s Cybersecurity Framework [C2] to multiple telehealth platform implementations. One platform provides biomedical devices enabled with cellular data. These devices transmitted biometric data to the cloud-based telehealth platform. The second platform provider deployed biometric devices enabled with Bluetooth wireless technology. Biometric devices communicated with an interface device (i.e., a tablet). The telehealth platform provider configured the interface device by using a mobile device management solution, limiting the interface device’s capabilities to those services required for RPM participation. The patient transmitted biometric data to the telehealth platform provider by using the interface device. The interface device transmitted data over cellular or broadband data communications. Both telehealth platform providers allowed HDOs to access patient data by using a web-based application. Both platforms implemented unique access control policies for access control, authentication, and authorization. Figure 2‑1 depicts the different communication pathways tested in this practice guide. A detailed description of each communications pathway is provided in NIST SP 1800-30B, Section 4.2, High-Level Architecture Communications Pathways.
Figure 2‑1 RPM Communications Paths
2.1.1 Accuhealth
Accuhealth provided biometric devices that included cellular data communication. Accuhealth also included a cloud-hosted application for HDOs to access patient-sent biometric data. Accuhealth provisioned biomedical devices with subscriber identity module (SIM) cards that enabled biomedical devices to transmit data via cellular data communications to the Accuhealth telehealth platform. Accuhealth stored patient-transmitted data in an application. Individuals assigned with clinician roles accessed transmitted data hosted in the Accuhealth application. The biomedical data displayed in the following screen captures are notional in nature and do not relate to an actual patient.
2.1.1.1 Patient Home–Communication Path A
This practice guide assumes that the HDO enrolls the patient in an RPM program. Clinicians would determine when a patient may be enrolled in the program appropriately, and conversations would occur about understanding the roles and responsibilities associated with participating in the RPM program. When clinicians enroll patients in the RPM program, the HDO would collaborate with Accuhealth. Accuhealth received patient contact information and configured biometric devices appropriate for the RPM program in which the patient was enrolled. Accuhealth configured biometric devices to communicate via cellular data, which is depicted as communication path A of Figure 2‑1. Biometric devices. Thus, biometric devices were isolated from the patient home network environment.
2.1.1.2 HDO
The Accuhealth solution includes installing an application within the HDO environment. Clinicians access a portal hosted by Accuhealth that allows a clinician to view patient biometric data. The application requires unique user accounts and role-based access control. System administrators create accounts and assign roles through an administrative console. Sessions from the clinician to the hosted application use encryption to ensure data-in-transit protection.
This section discusses the HDO application installation and configuration procedures.
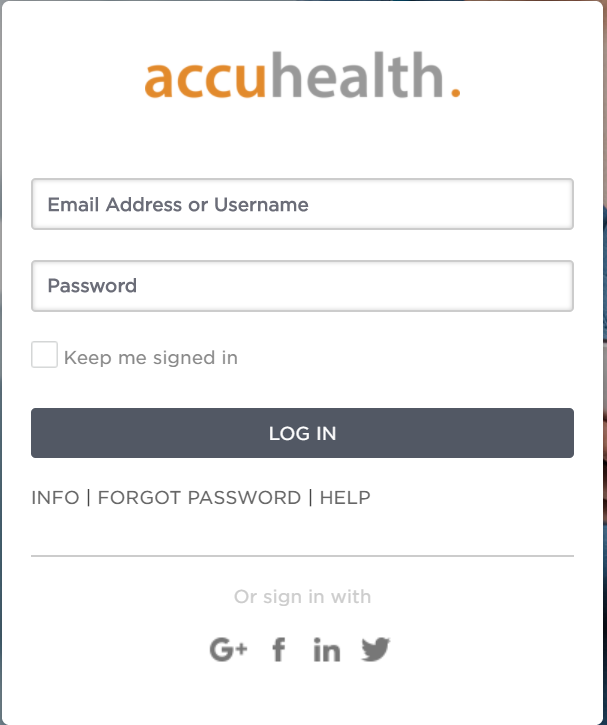
Access a device that has a web browser.
Navigate to Accuhealth login page and provide a Username and Password. The following screenshots show a doctor’s point of view in the platform.
Click LOG IN.
After logging in, the Patient Overview screen displays.
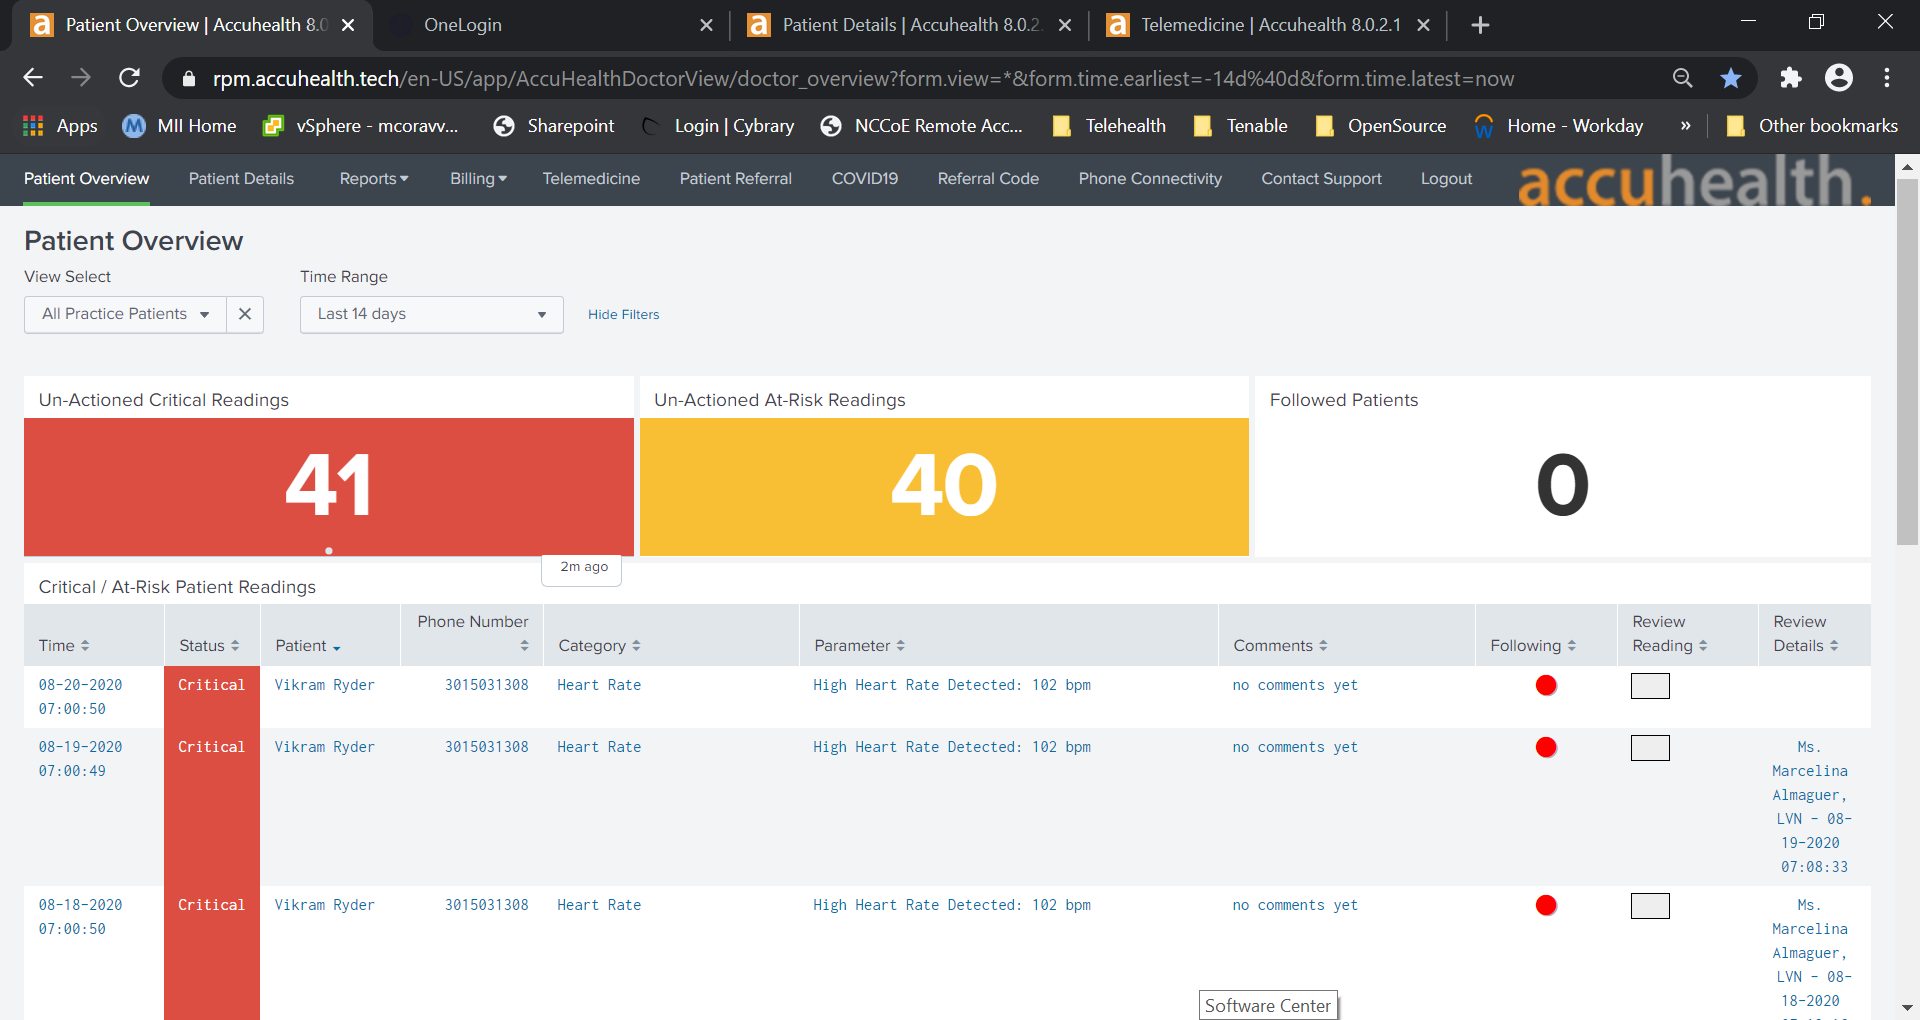
To view patients associated with the account used to log in, navigate to the View Select drop-down list in the top left corner of the screen and select My Patients.
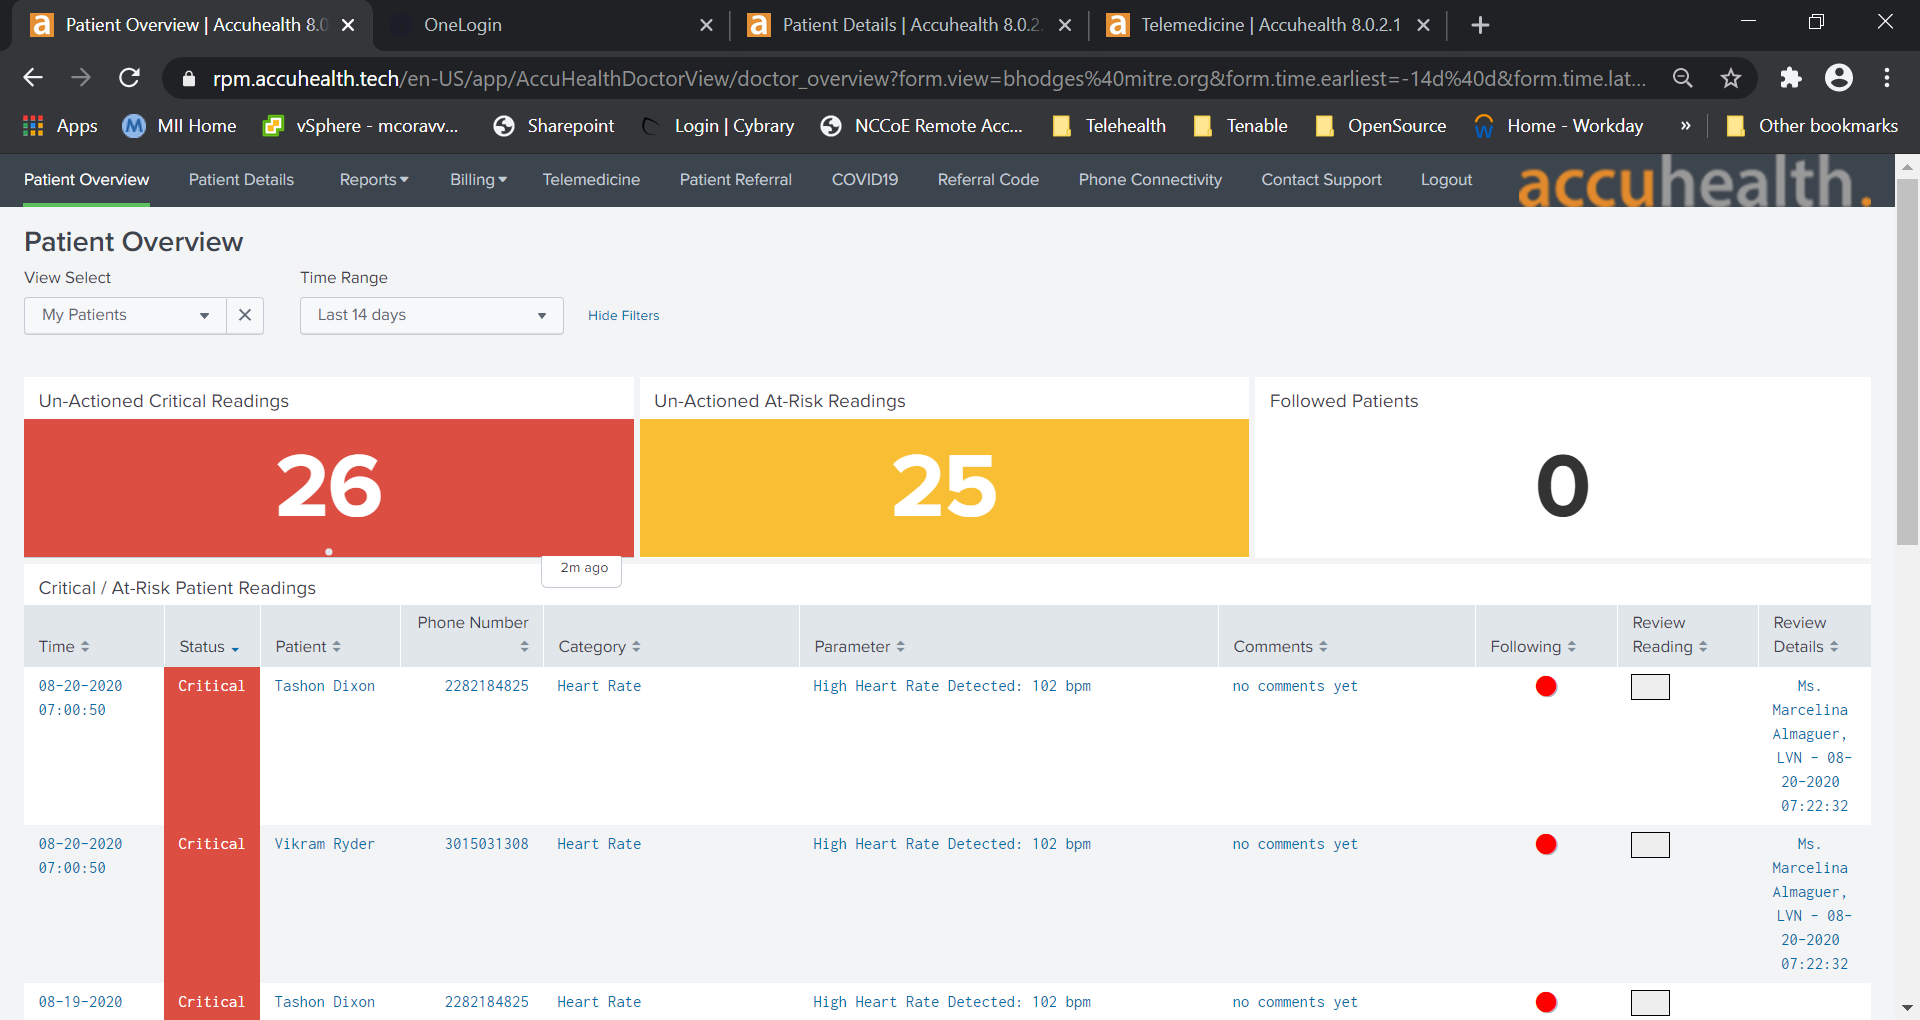
Click a Patient to display the Patient Details page, which displays all patient biomedical readings.
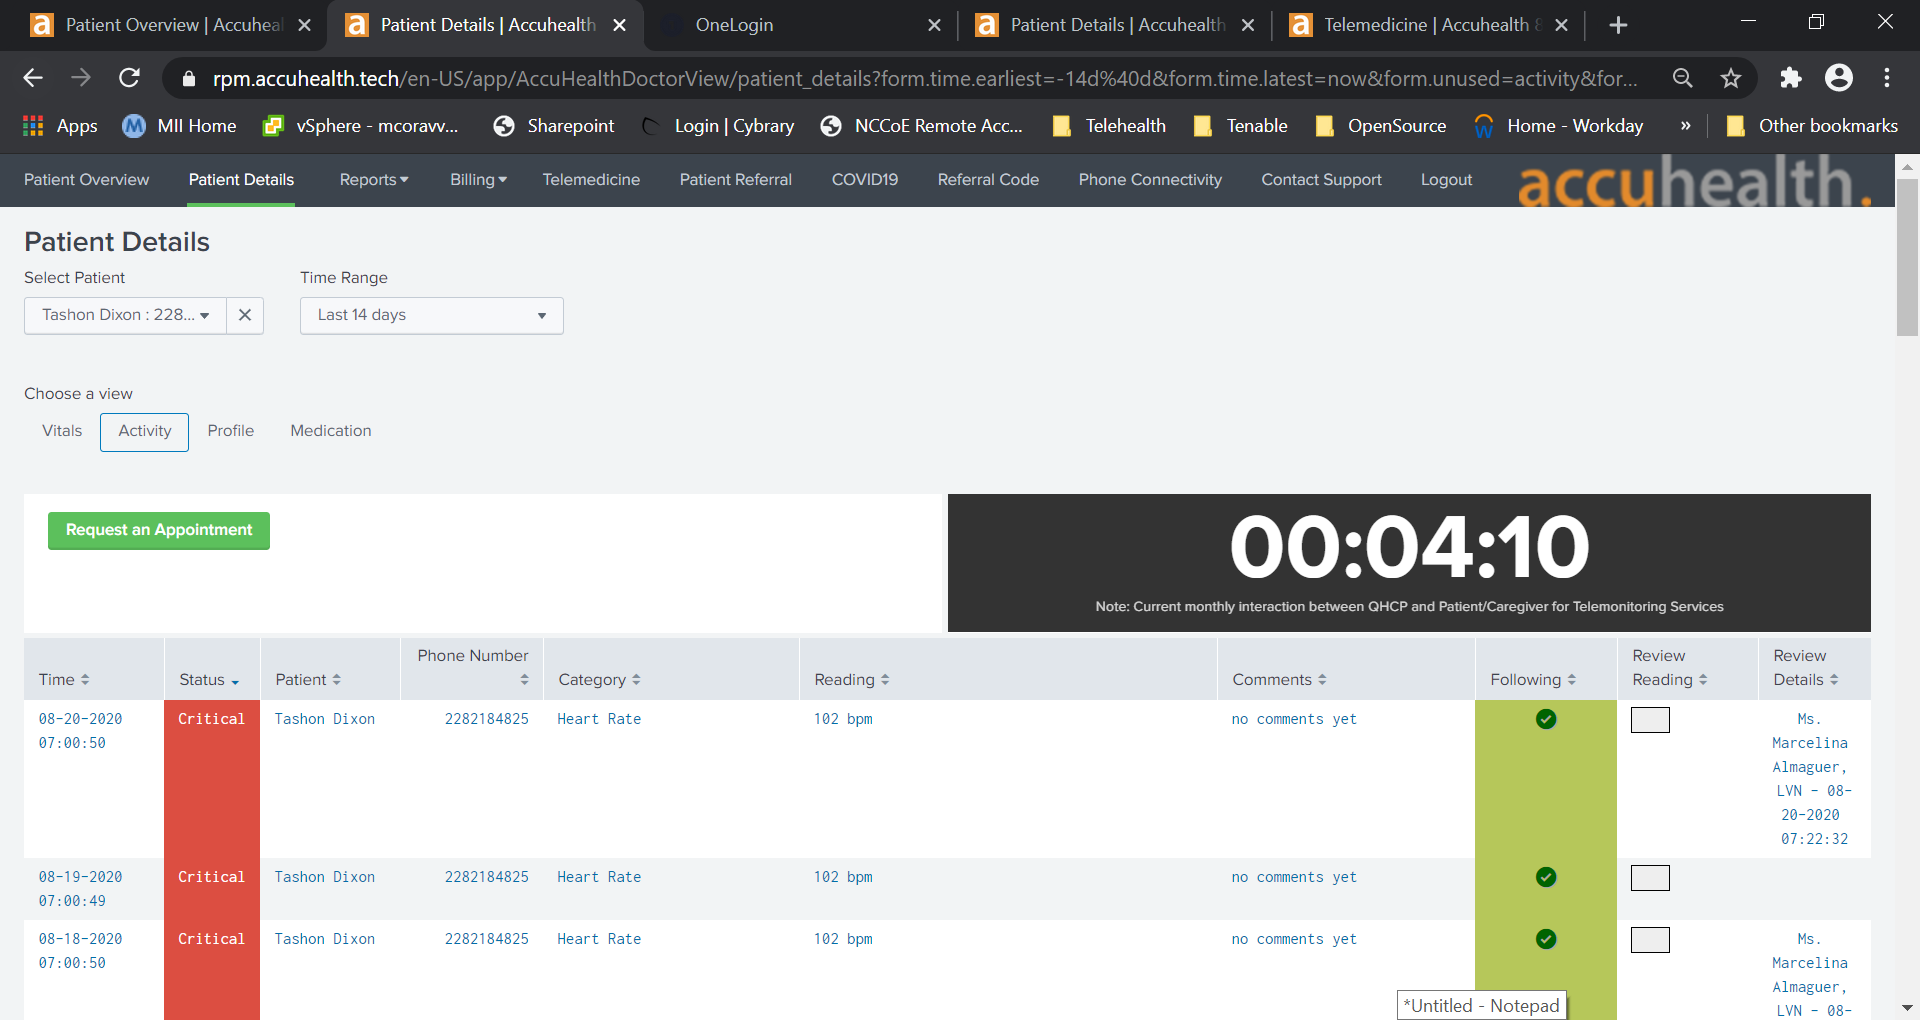
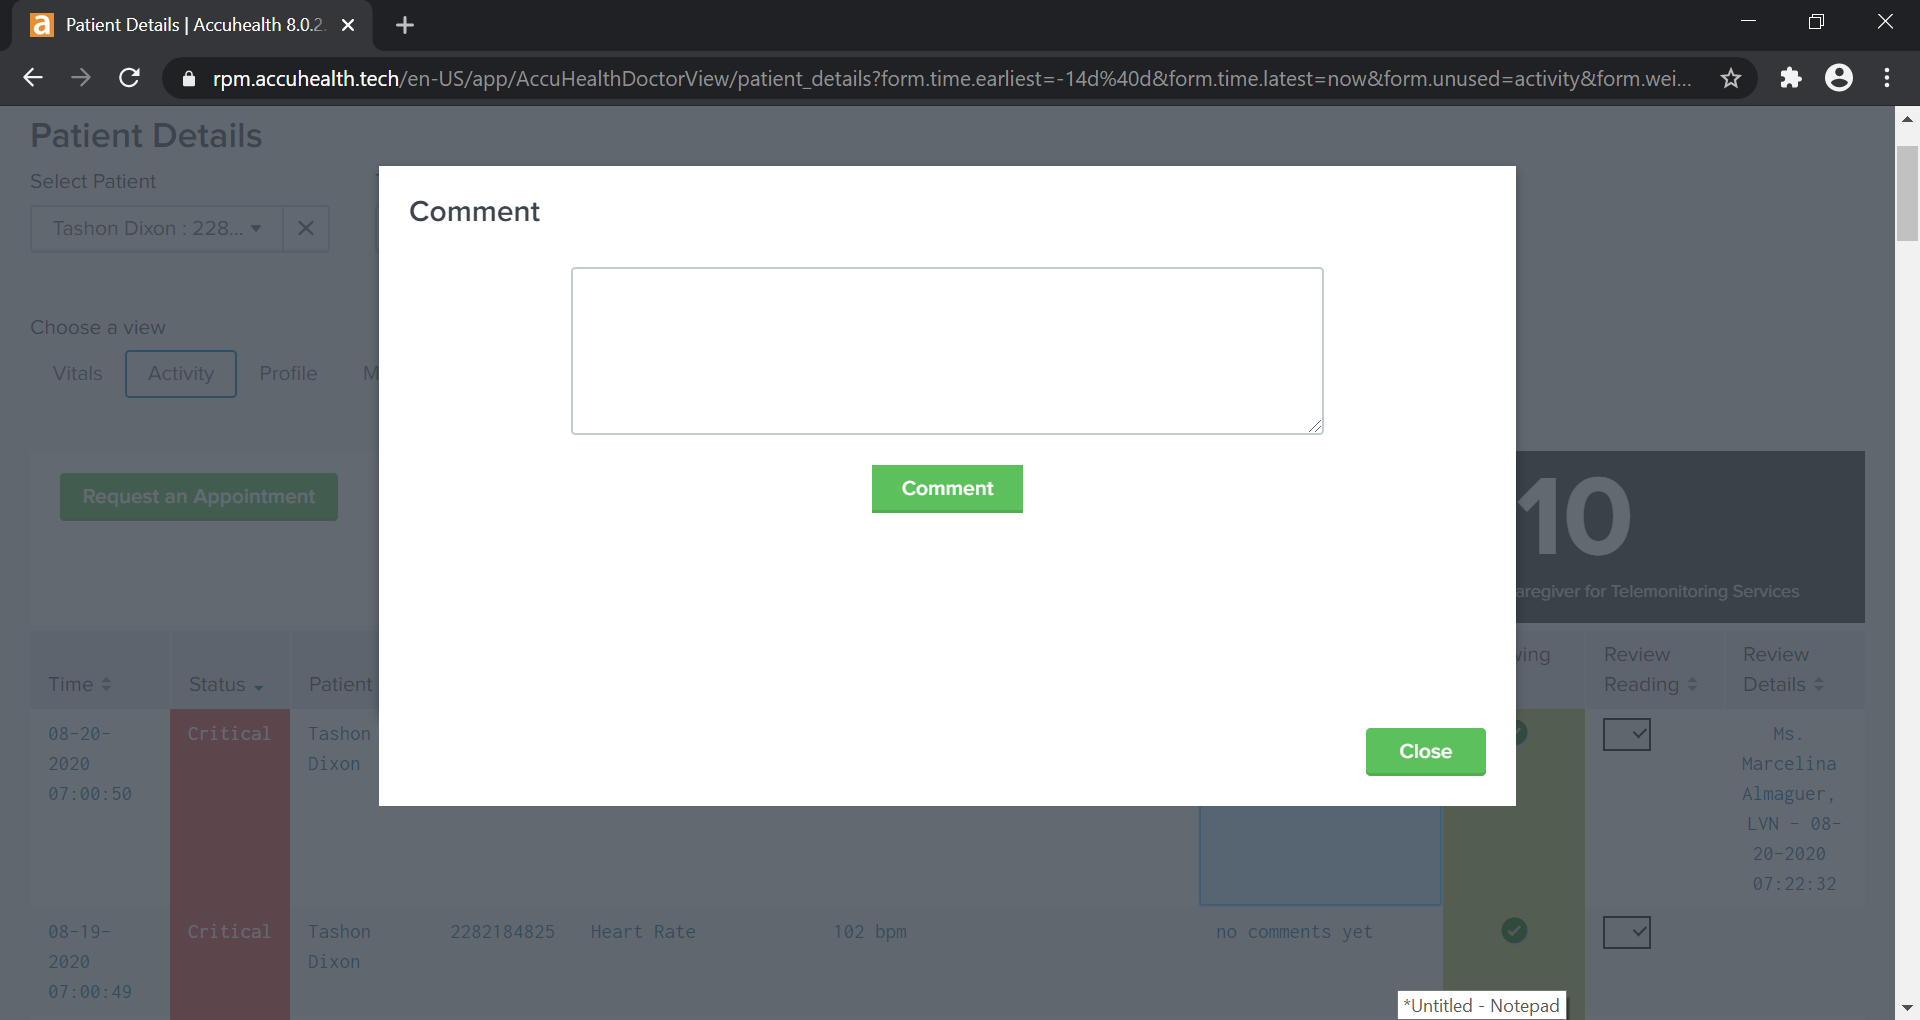
To leave a comment on a reading, click no comments yet under the Comments column on the row of the reading to which the comment refers.
A Comment screen displays that allows free text input.
Click Comment.
Click Close.
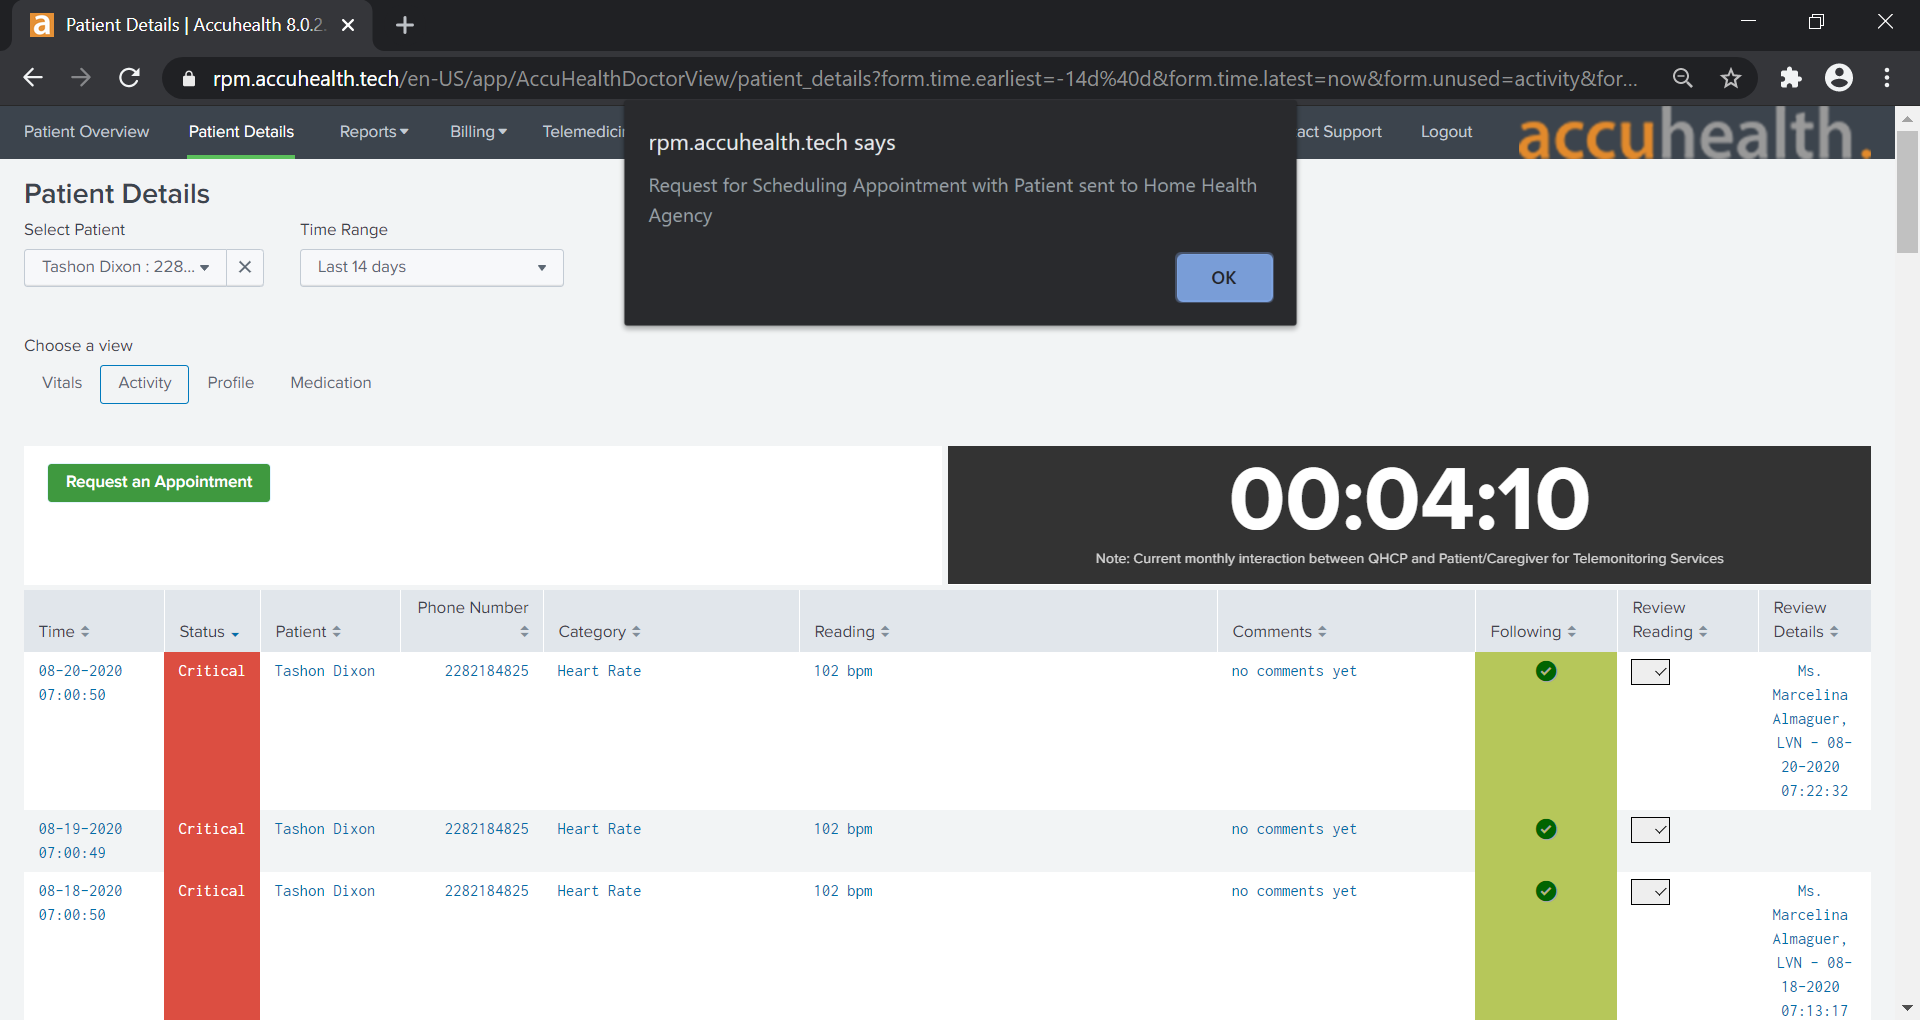
To have a call with a patient, click Request an Appointment in the top left of the Patient Details page.
A notification box displays, asking if the Home Health Agency needs to schedule an appointment with the patient.
Click OK.
2.1.2 Vivify
Vivify provided biometric and interface devices (i.e., Vivify provisioned a tablet device) and a cloud-hosted platform. Vivify enabled biometric devices with Bluetooth communication and provisioned interface devices with SIM cards. Individuals provisioned with patient roles used the interface device to retrieve data from the biometric devices via Bluetooth. Individuals acting as patients then used the interface device to transmit data to Vivify by using cellular data. Vivify’s application presented the received data. Individuals provisioned with clinician roles accessed the patient-sent data stored in the Vivify application via a web interface.
2.1.2.1 Patient Home–Communication Path B
This practice guide assumes that the HDO enrolls the patient in an RPM program. Clinicians would determine when a patient may be enrolled in the program appropriately, and conversations then occur about understanding the roles and responsibilities associated with participating in the RPM program. When clinicians enroll patients in the RPM program, the HDO would collaborate with Vivify. Vivify received patient contact information and configured biometric devices and an interface device (i.e., tablet) appropriate for the RPM program in which the patient was enrolled. These devices were configured to transmit data via cellular through the interface device, which is depicted as communication path B in Figure 2‑1. Vivify assured device configuration and asset management.
2.1.2.2 Patient Home–Communication Paths C and D
To evaluate communication path C in Figure 2‑1, the project team implemented another instance of the Vivify Pathways Care Team Portal in a simulated cloud environment. The simulated cloud environment represented how a telehealth platform provider may operate; however, it does not reflect how any specific telehealth platform provider hosts its components. The simulated cloud environment deployed Vivify-provided software. One should note that the simulated cloud environment does not represent how Vivify implements its commercial service offering. The NCCoE implemented the simulated cloud environment as a test case where telehealth platforms may incorporate layer 2 over layer 3 solutions as part of their architecture. A Vivify Pathways Home kit was hosted in a patient home network, which included peripherals as well as an RPM interface. Engineers connected the RPM interface (mobile device) to the patient home network to enable broadband communications with the new simulated cloud instance. The RPM interface collected patient data from the provided peripherals via Bluetooth and then transmitted thesedata to the simulated cloud environment through the broadband connection.
After implementing communication path C and the Onclave Network Solution, the RPM interface connected to an add-on security control, Onclave Home Gateway, inside the patient home environment. Once the RPM interface was connected to the Onclave Home Gateway, patient data were transmitted to the simulated cloud environment through the Onclave Telehealth Gateway. These connections enabled the project team to implement communication path D as depicted in Figure 2‑1. Details on how engineers installed and configured Onclave tools are described in section 2.2.5.1, Onclave SecureIoT.
2.1.2.3 Telehealth Platform Provider–Communication Paths C and D
For communication paths C and D, a simulated cloud environment was created to represent a telehealth platform provider that supports broadband-capable biometric devices. A sample Vivify Pathways Care Team Portal was obtained to demonstrate how patient data could be transmitted via broadband communications. Practitioners should note, however, that Vivify as an entity may not support this use case. Vivify engineers facilitated deploying the Vivify Pathways Care Team Portal as representative of how a telehealth platform provider may support the communications pathway. Communication paths A and B used telehealth platform providers that were located outside the NCCoE lab, and data were transmitted via cellular communications.
Communication path D required more add-on security controls to be configured in the virtual cloud environment. For this communication pathway, the representative Vivify Pathways Care Team Portal was connected to an Onclave Telehealth Gateway. This gateway accepted data transmissions from the RPM interface connected to the Onclave Home Gateway housed in the patient home environment.
2.1.2.4 HDO
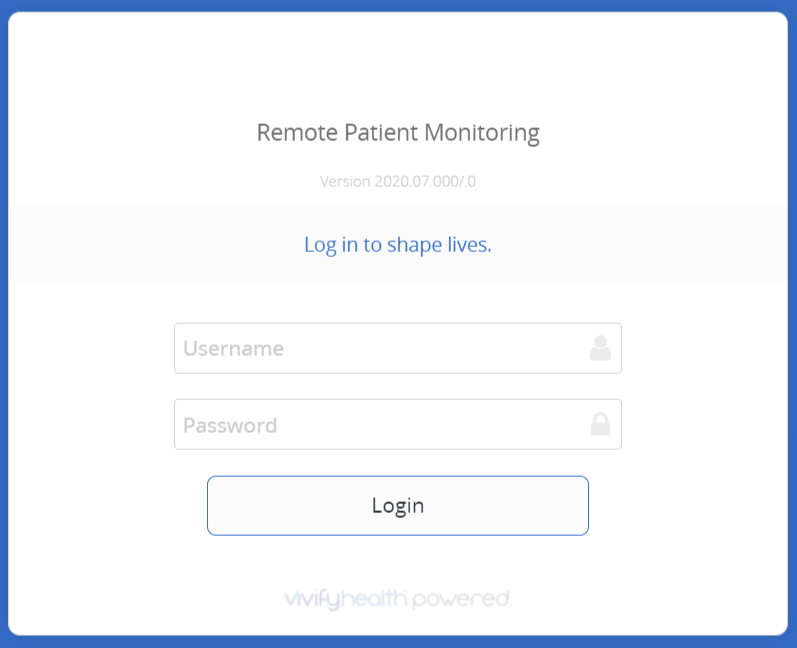
Using a web browser interface, clinicians access a portal hosted by Vivify that allows access to view patient biometric data. Portal interaction requires unique user accounts and role-based access control. System administrators create accounts and assign roles through an administrative console. Sessions from the clinician to the hosted application use encryption to ensure data-in-transit protection.
This section discusses the HDO application installation and configuration procedures.
Access a device that has a web browser.
Navigate to https://<vivifyhealth site>/CaregiverPortal/Login and give the Username and Password of the administrative account provided by Vivify.
Click Login.
Navigate to the Care Team menu item on the left-hand side of the screen.
Click + New User.
In the New User screen, provide the following information:
First Name: Test
Last Name: Clinician
User Name: TClinician1
Password: **********
Confirm Password: **********
Facilities: Vivify General
Sites: Default
Roles: Clinical Level 1, Clinical Level 2
Email Address: **********
Mobile Phone: *********
Click Save Changes.
Navigate to Patients in the left-hand menu bar.
Select the NCCoE, Patient record.
Under Care Team, click the notepad and pencil in the top right of the box.
In the Care Team window, select Clinician, Test and click Ok.
Log out of the platform.
Log in to the platform by using the Test Clinician credentials and click Login.
Click the NCCoE, Patient record.
Navigate to the Monitoring tab to review patient readings.
Based on the patient’s data, the clinician needs to consult the patient.
Click the ellipsis in the NCCoE, Patient menu above the green counter.
Select Call Patient.
In the Respond to Call Request screen, select Phone Call Now.
After the consultation, record the action items performed during the call.
In the Monitoring window, click Accept All under the Alerts tab to record intervention steps.
In the Select Intervention window, select the steps performed to address any patient alerts.
Click Accept.
Navigate to Notes to review recorded interventions or add other clinical notes
2.2 Security Capabilities
The following instruction and configuration steps depict how the NCCoE engineers and project collaborators implemented the provided cybersecurity tools to achieve the desired security capabilities identified in NIST SP 1800-30B, Section 4.4, Security Capabilities.
2.2.1 Risk Assessment Controls
Risk assessment controls align with the NIST Cybersecurity Framework’s ID.RA category. For this practice guide, the Tenable.sc solution was implemented as a component in an HDO’s risk assessment program. While Tenable.sc includes a broad functionality set, the project team leveraged Tenable.sc’s vulnerability scanning and management capabilities.
2.2.1.1 Tenable.sc
Tenable.sc is a vulnerability management solution. Tenable.sc provides a dashboard graphic user interface that displays the results from its vulnerability scanning and configuration scanning capabilities. Tenable.sc’s dashboard includes vulnerability scoring, enabling engineers to prioritize patching and remediation. The engineers used Tenable.sc to manage a Nessus scanner, which performed vulnerability scanning against HDO domain-hosted devices. While the Tenable.sc solution includes configuration-checking functionality, this practice guide uses the solution for vulnerability management.
System Requirements
Central Processing Unit (CPU): 4
Memory: 8 gigabytes (GB)
Storage: 250 GB
Operating System: CentOS 7
Network Adapter: virtual local area network (VLAN) 1348
Tenable.sc Installation
This section discusses installation of the Tenable.sc vulnerability management solution.
Import the Tenable.sc open virtual appliance or appliance (OVA) file to the virtual environment.
Assign the virtual machine (VM) to VLAN 1348.
Start the VM and document the associated internet protocol (IP) address.
Open a web browser that can talk to VLAN 1348 and navigate to the VM’s IP address.
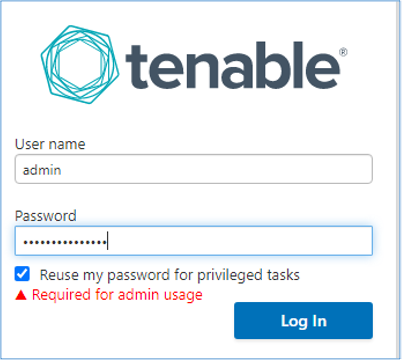
For the first login, use wizard as the Username and admin for the Password.
Tenable.sc prompts a pop-up window for creating a new admin username and password.
Repeat step 5 using the new username and password.
Username: admin
Password: **********
Check the box beside Reuse my password for privileged tasks.
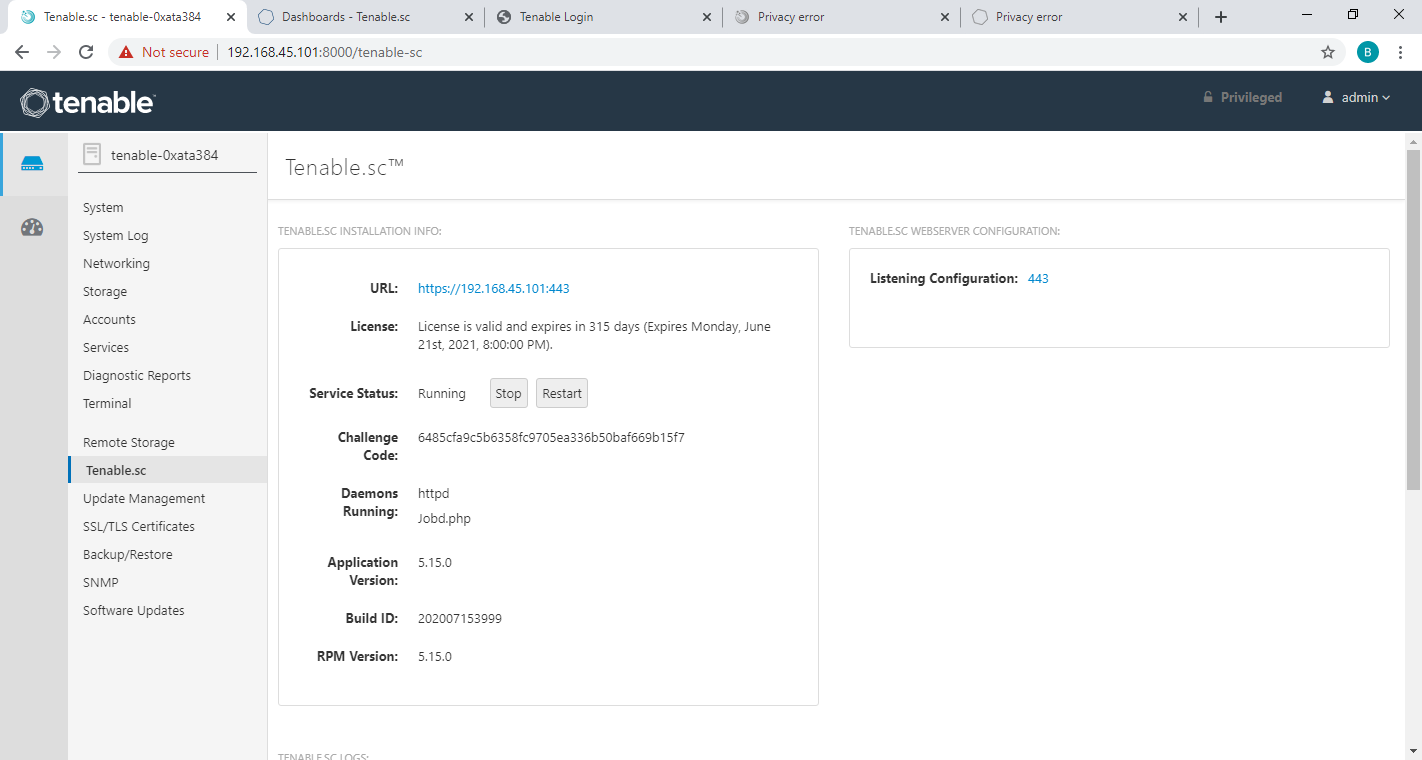
After logging in, the Tenable Management Console page displays.
Click the Tenable.sc menu option on the left side of the screen.
To access Tenable.sc, click the IP address next to the uniform resource locator (URL) field.
Log in to Tenable.sc by using the credentials created in previous steps and click Sign In.
Username: admin
Password: **********
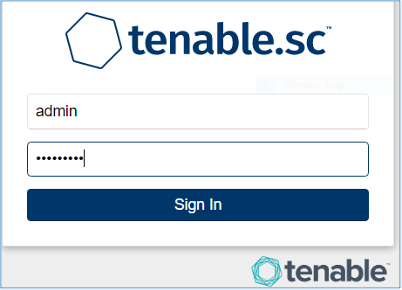
After signing in, Tenable.sc’s web page displays.
Navigate to the System drop-down list in the menu ribbon.
Click Configuration.
Under Tenable.sc License, click Upload next to License File.
Navigate to the storage location of the Tenable.sc license key obtained from a Tenable representative and select the key file.
Click OK.
Click Validate.
When Tenable.sc accepts the key, a green Valid label will display next to License File.
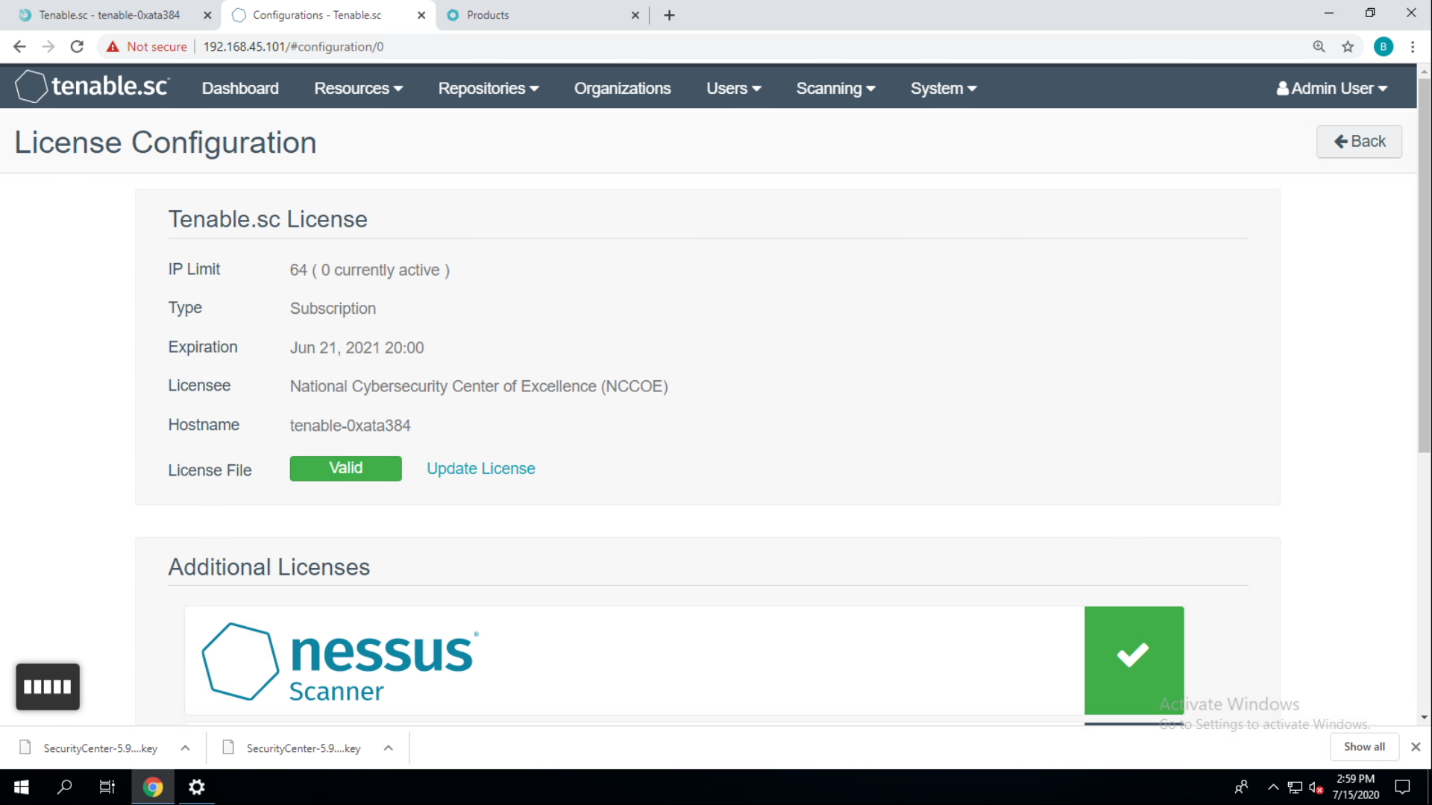
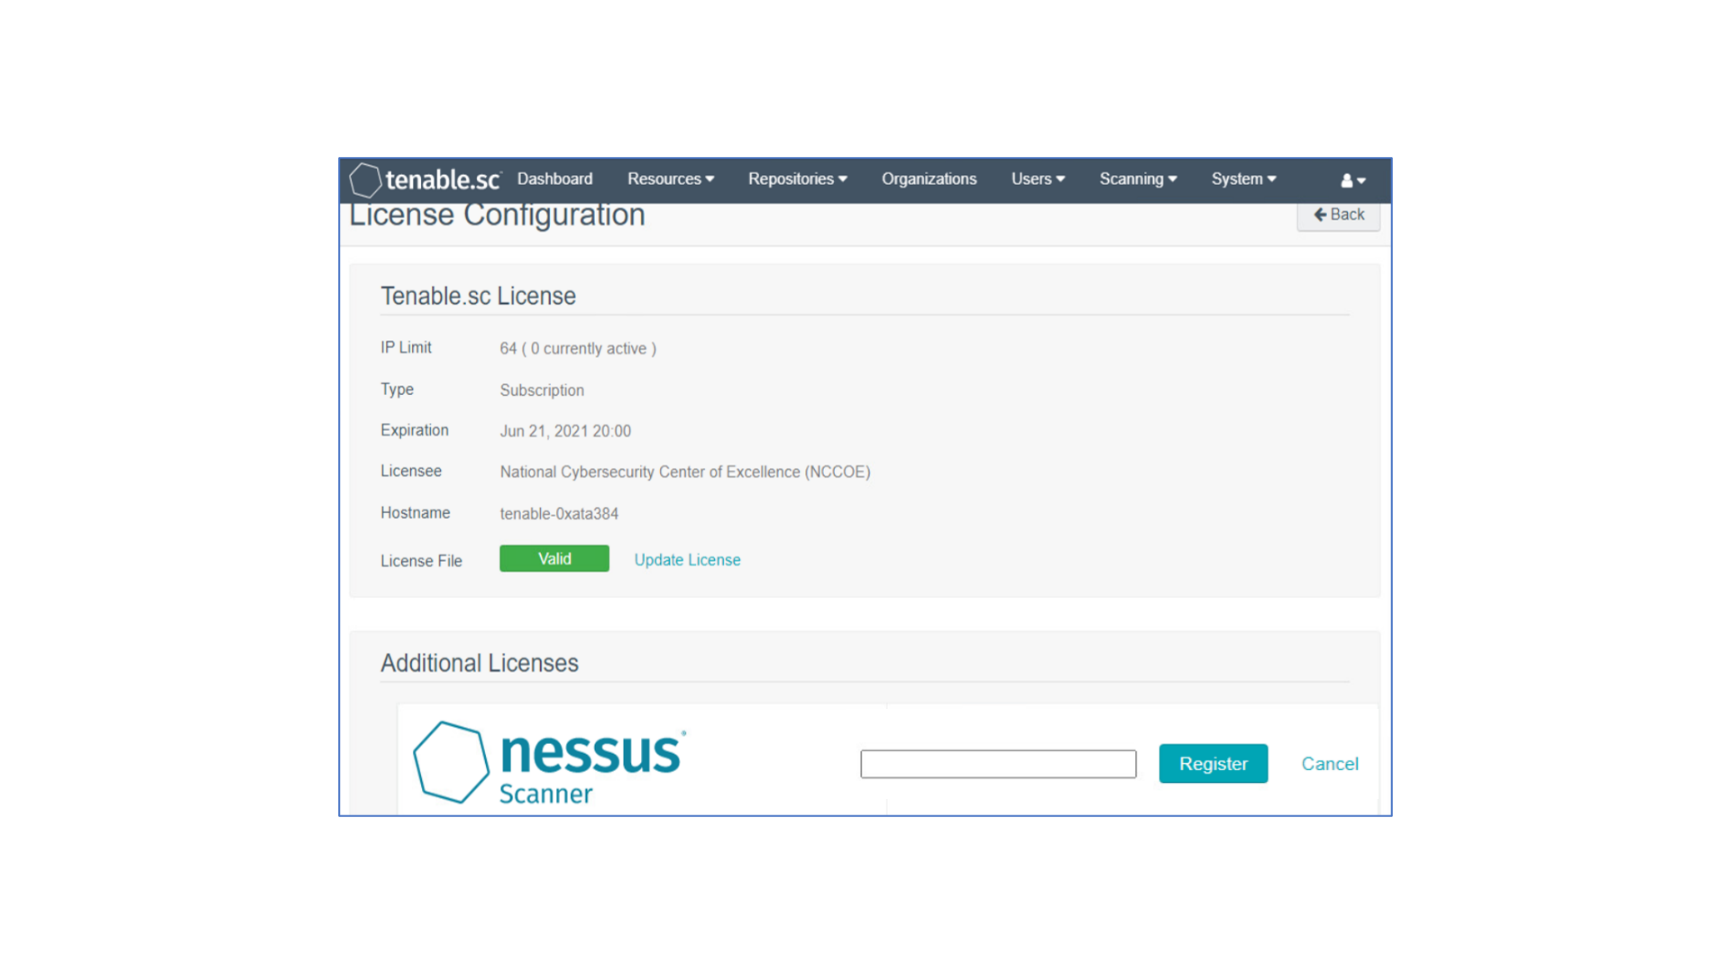
Under Additional Licenses, input the Nessus license key provided by a Tenable representative next to Nessus Scanner.
Click Register.
Tenable.sc Configuration
The project team leveraged support from Tenable engineers. Collectively, engineers installed Tenable.sc and validated license keys for Tenable.sc and Nessus. Engineers created Organization, Repository, User, Scanner, and Scan Zones instances for the HDO lab environment. The configuration steps are below.
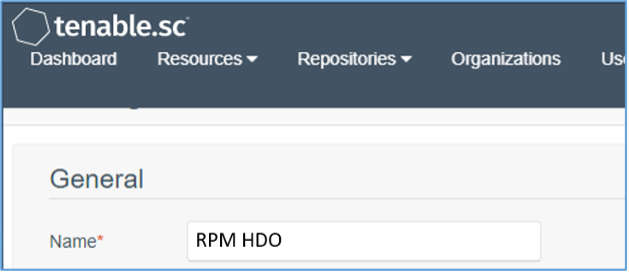
Add an Organization
Navigate to Organizations in the menu ribbon.
Click +Add in the top right corner of the screen. An Add Organization page will appear.
Name the Organization RPM HDO and leave the remaining fields as their default values.
Click Submit.
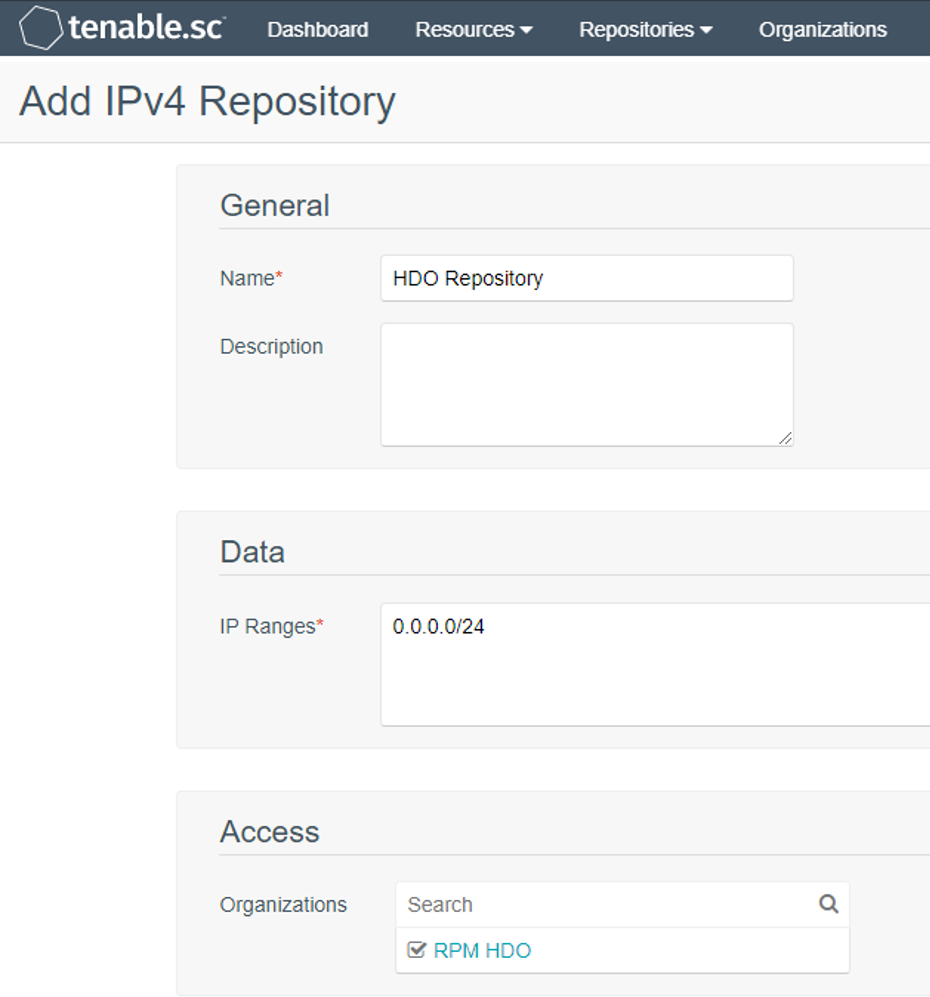
Add a Repository
Navigate to the Repositories drop-down list in the menu ribbon.
Click +Add in the top right corner of the screen. An Add Repository screen displays.
Under Local, click IPv4. An Add IPv4 Repository page displays. Provide the following information:
Name: HDO Repository
IP Ranges: 0.0.0.0/24
Organizations: RPM HDO
Click Submit.
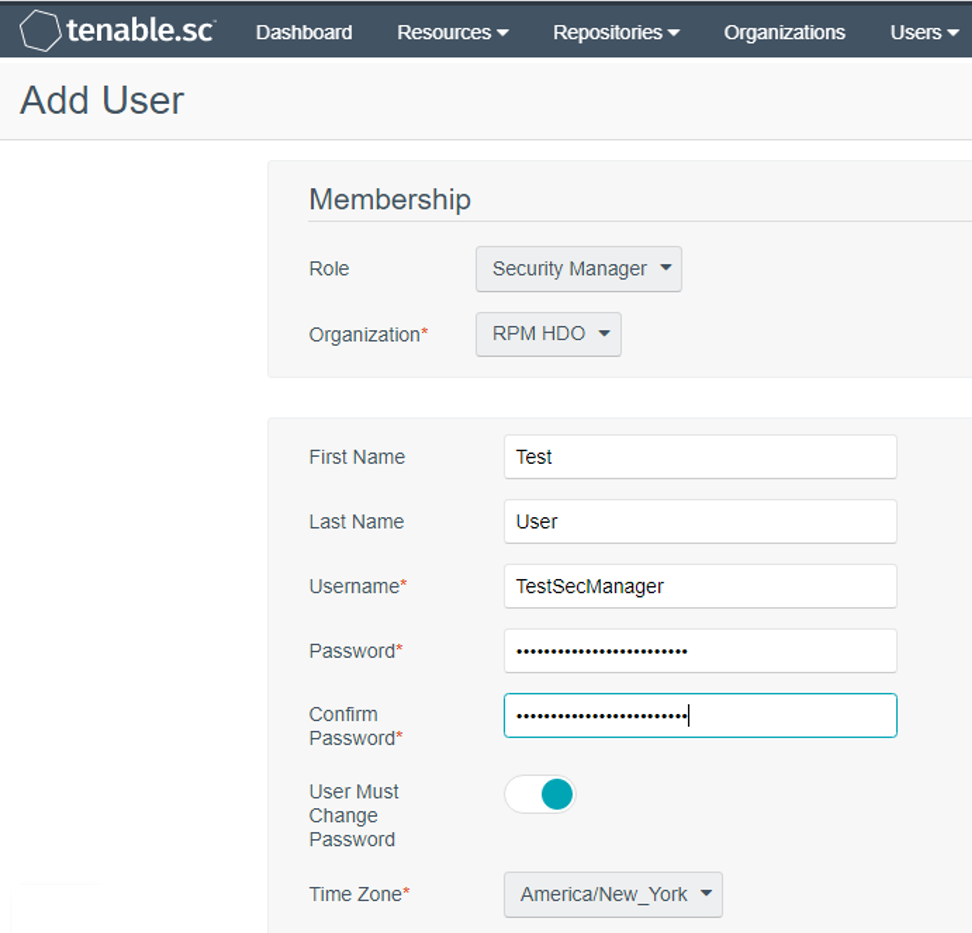
Add a User
Navigate to the Users drop-down list in the menu ribbon.
Select Users.
Click +Add in the top right corner. An Add User page displays. Provide the following information:
Role: Security Manager
Organization: RPM HDO
First Name: Test
Last Name: User
Username: TestSecManager
Password: **********
Confirm Password: **********
Enable User Must Change Password.
Time Zone: America/New York
Click Submit.
For the lab deployment of Tenable.sc, the engineers instantiated one Nessus scanner in the Security Services subnet that has access to every subnet in the HDO environment.
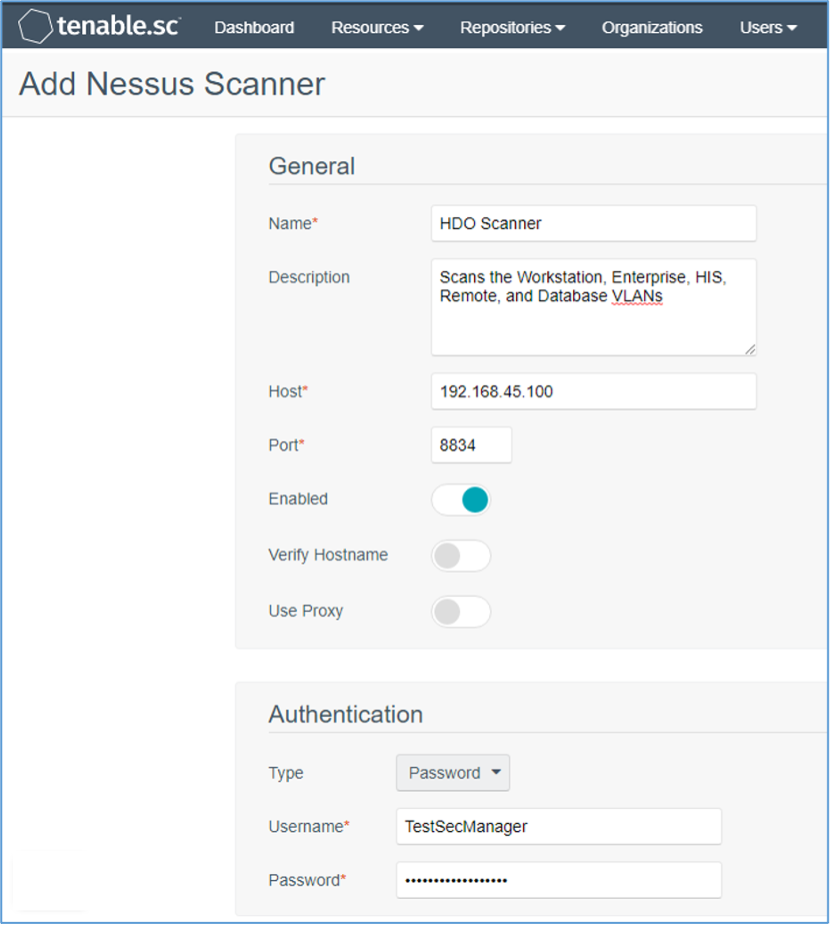
Add a Scanner
Navigate to the Resources drop-down list in the menu ribbon.
Select Nessus Scanners.
Click +Add in the top right corner. An Add Nessus Scanner page displays. Fill in the following information:
Name: HDO Scanner
Description: Scans the Workstation, Enterprise, HIS, Remote, and Database VLANs
Host: 192.168.45.100
Port: 8834
Enabled: on
Type: Password
Username: TestSecManager
Password: **********
Click Submit.
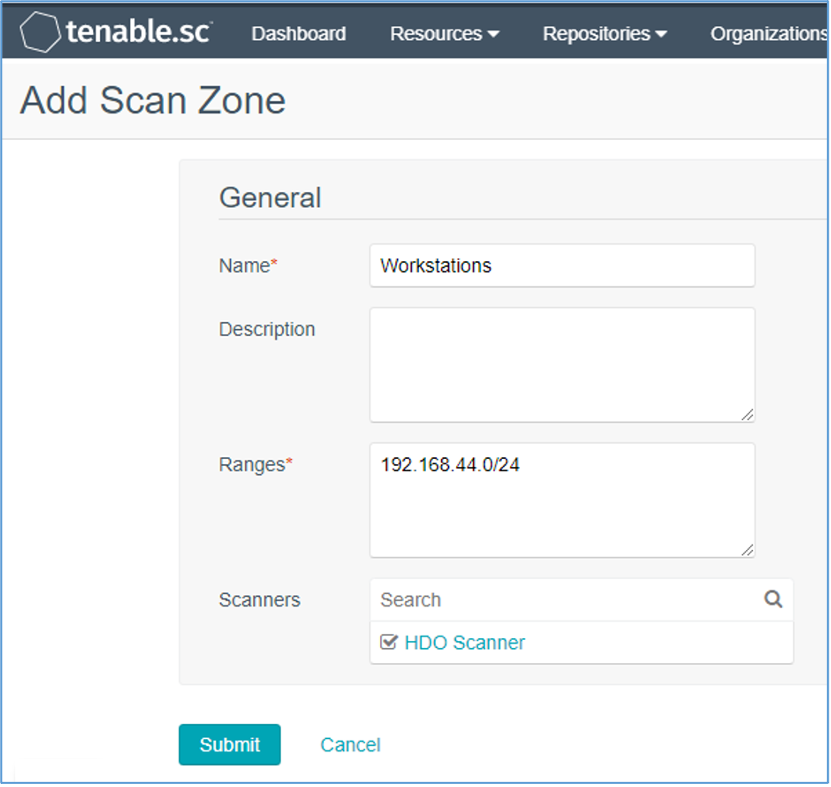
The engineers created a scan zone for each subnet established on the HDO network. The process to create a scan zone is the same for each subnet aside from the IP address range.
As an example, the steps for creating the Workstation scan zone are as follows:
Add a Scan Zone
Navigate to the Resources drop-down list in the menu ribbon.
Select Scan Zones.
Click +Add. An Add Scan Zone page will appear. Provide the following information:
Name: Workstations
Ranges: 192.168.44.0/24
Scanners: HDO Scanner
Click Submit.
Repeat steps in Add a Scan Zone section for each VLAN.
To fulfil the identified NIST Cybersecurity Framework Subcategory requirements, the engineers utilized Tenable’s host discovery and vulnerability scanning capabilities. The first goal was to identify the hosts on each of the HDO VLANs. Once Tenable identifies the assets, Tenable.sc executes a basic network scan to identify any vulnerabilities on these assets.
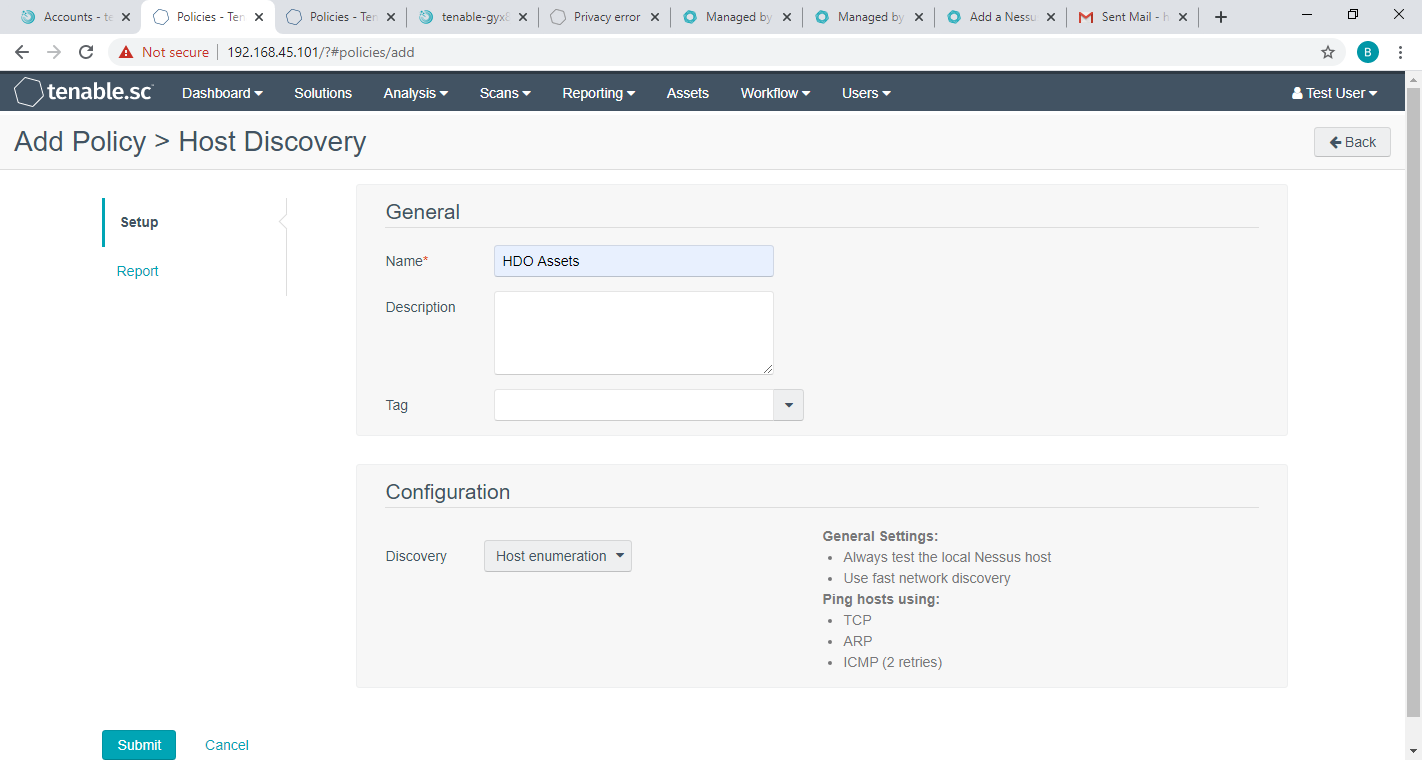
Create Scan Policies
Engineers created a Security Manager account in a previous step when adding users. Log in to Tenable.sc by using the Security Manager account.
Navigate to the Scans drop-down list in the menu ribbon.
Select Policies.
Click +Add in the top right corner.
Click Host Discovery in the Add Policy page. An Add Policy > Host Discovery page will appear. Provide the following information:
Name: HDO Assets
Discovery: Host enumeration
Leave the remaining options as their default values.
Click Submit.
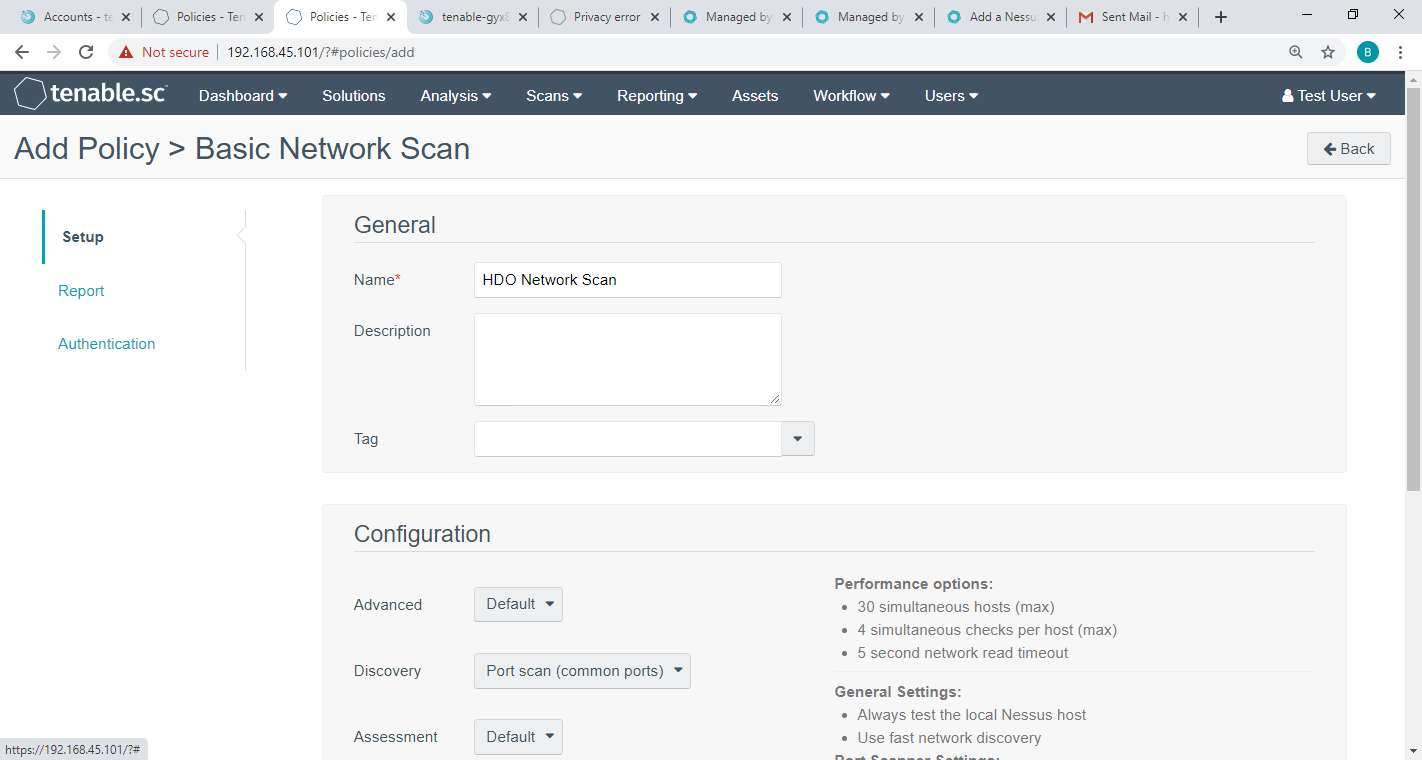
Click +Add in the top right corner.
Click Basic Network Scan in the Add Policy page. An Add Policy > Basic Network Scan page displays.
Name the scan HDO Network Scan and leave the remaining options to their default settings.
Click Submit.
Create Active Scans
Navigate to the Scans drop-down list in the menu ribbon.
Select Active Scans.
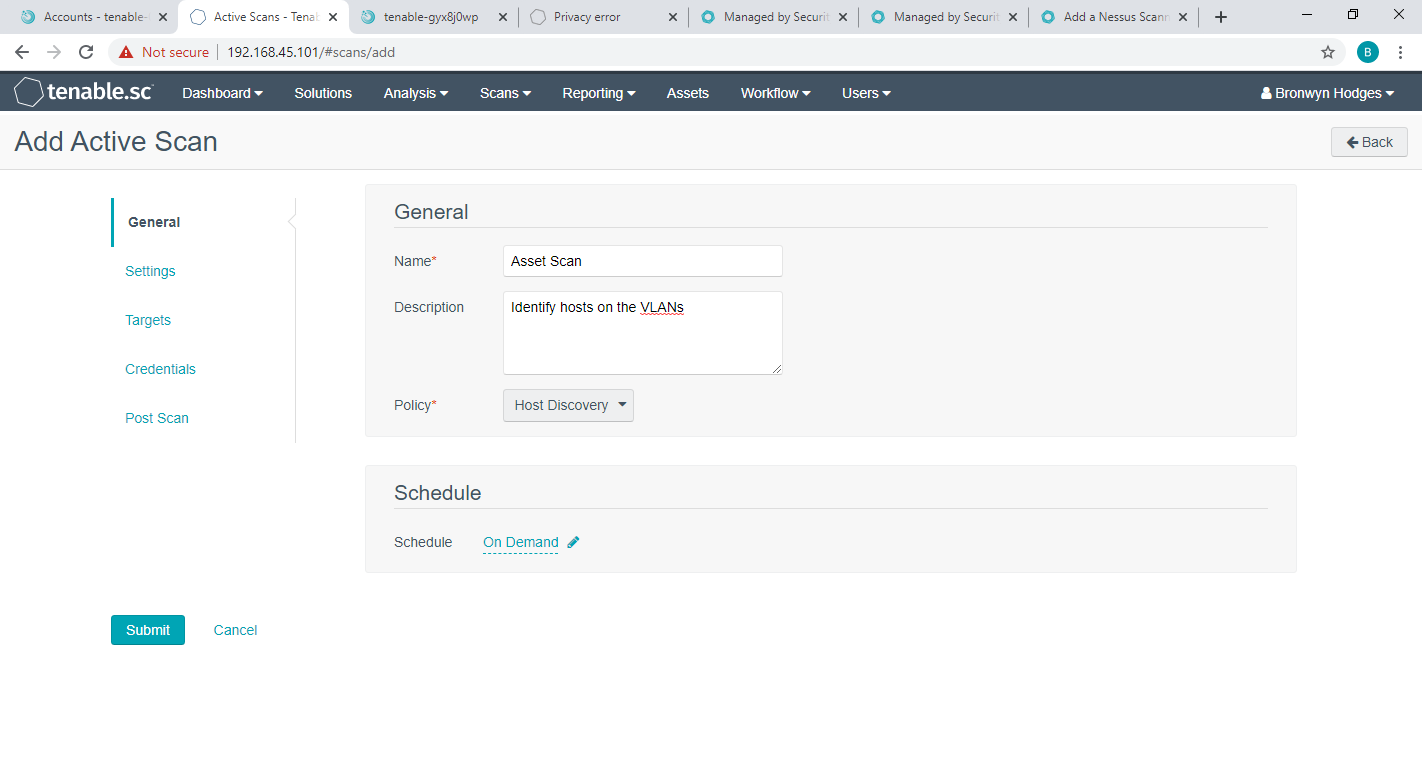
Click +Add in the top right corner. An Add Active Scan page will appear. Provide the following information for General and Target Type sections.
General
Name: Asset Scan
Description: Identify hosts on the VLANs
Policy: Host Discovery
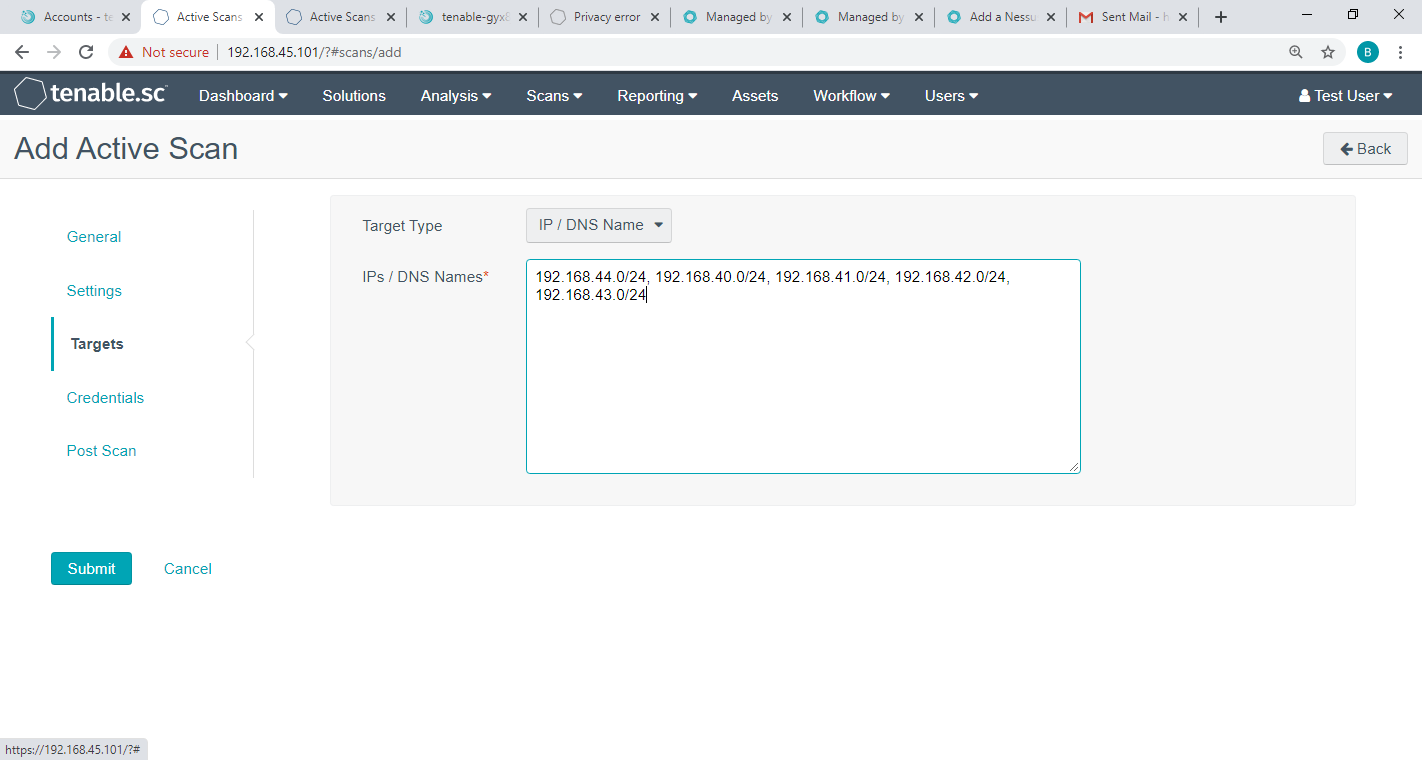
Targets
Target Type: IP/DNS Name
IPs/DNS Names: 192.168.44.0/24, 192.168.40.0/24, 192.168.41.0/24, 192.168.42.0/24, 192.168.43.0/24
Click Submit.
Repeat steps in Create Active Scans section for the Basic Network Scan policy. Keep the same value as defined for Active Scan except the following:
Name the scan HDO Network Scan.
Set Policy to HDO Network Scan.
After the engineers created and correlated the Policies and Active Scans to each other, they executed the scans.
Execute Active Scans
Navigate to the Scans drop-down list in the menu ribbon.
Select Active Scans.
Next to HDO Asset Scan click ▶.
Navigate to the Scan Results menu option shown at the top of the screen under the menu ribbon to see the status of the scan.
Click HDO Asset Scan to see the scan results.
Repeat the above steps for HDO Network Scan.
View Active Scan Results in the Dashboard
Navigate to the Dashboard drop-down list in the menu ribbon.
Select Dashboard.
In the top right, click Switch Dashboard.
Click Vulnerability Overview. A screen will appear that displays a graphical representation of the vulnerability results gathered during the HDO Host Scan and HDO Network Scan.
2.2.1.2 Nessus
Nessus is a vulnerability scanning engine that evaluates a host’s operating system and configuration to determine the presence of exploitable vulnerabilities. This project uses one Nessus scanner to scan each VLAN created in the HDO environment to identify hosts and the vulnerabilities associated with those hosts. Nessus sends the results back to Tenable.sc, which graphically represents the results in dashboards.
System Requirements
CPU: 4
Memory: 8 GB
Storage: 82 GB
Operating System: CentOS 7
Network Adapter: VLAN 1348
Nessus Installation
Import the OVA file to the virtual lab environment.
Assign the VM to VLAN 1348.
Start the VM and document the associated IP address.
Open a web browser that can talk to VLAN 1348 and navigate to the VM’s IP address.
Log in using wizard as the Username and admin for the Password.
Create a new admin username and password.
Log in using the new username and password.
Username: admin
Password: **********
Enable Reuse my password for privileged tasks.
Click Tenable.sc on the left side of the screen.
To access Tenable.sc, click the IP address next to the URL field.
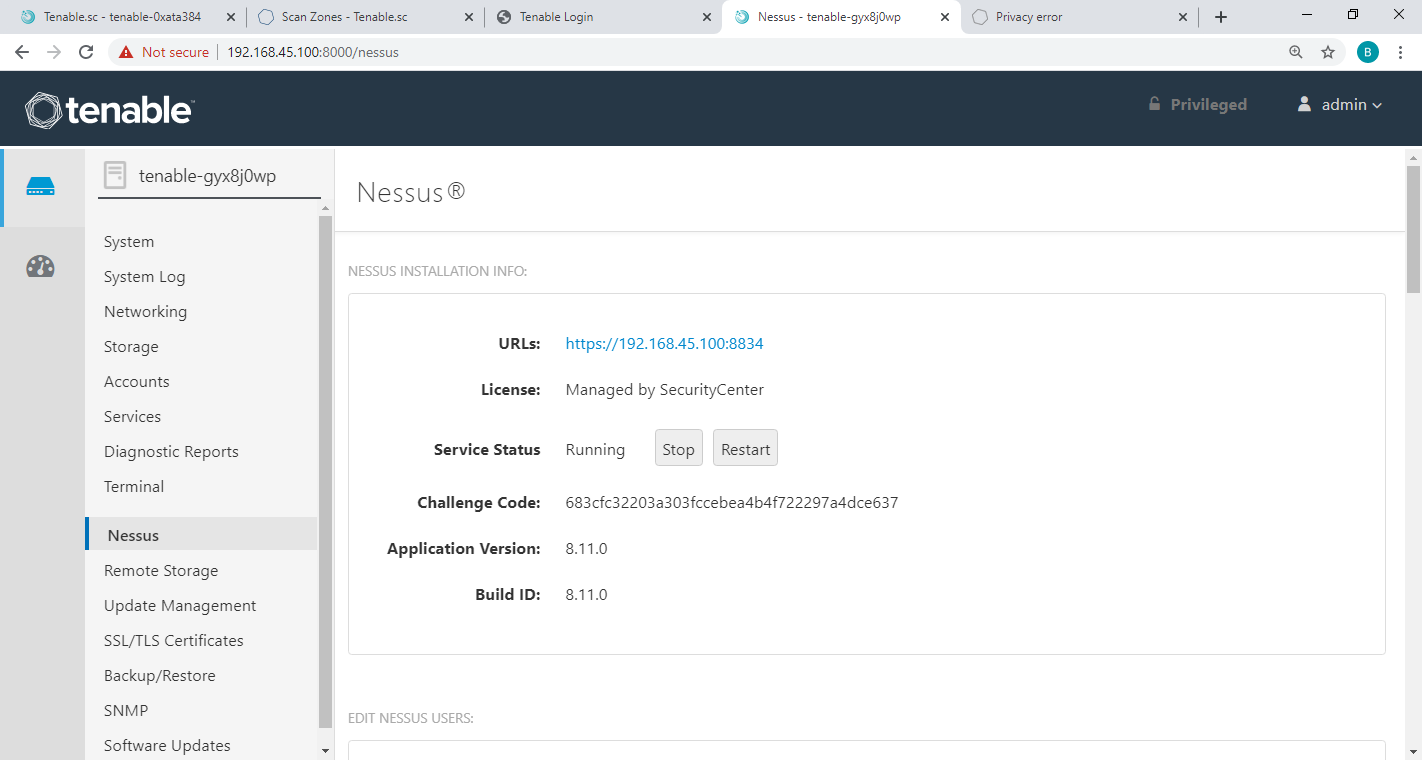
Nessus Configuration
The engineers utilized Tenable.sc to manage Nessus. To configure Nessus as managed by Tenable.sc, follow Tenable’s Managed by Tenable.sc guide [C3].
2.2.2 Identity Management, Authentication, and Access Control
Identity management, authentication, and access control align with the NIST Cybersecurity Framework PR.AC category. The engineers implemented capabilities in the HDO to address this control category. First, they implemented Microsoft Active Directory (AD), then installed a domain controller to establish an HDO domain. Next, the engineers implemented Cisco Firepower as part of its network core infrastructure. They used Cisco Firepower to build VLANs that aligned to network zones. Cisco Firepower also was configured to provide other network services. Details on installation are included in the following sections.
2.2.2.1 Domain Controller
The engineers installed a Windows Server domain controller within the HDO to manage AD and local domain name system (DNS) for the enterprise. The following section details how the engineers installed the services.
Domain Controller Appliance Information
CPU: 4
Random Access Memory (RAM): 8 GB
Storage: 120 GB (Thin Provision)
Network Adapter 1: VLAN 1327
Operating System: Microsoft Windows Server 2019 Datacenter
Domain Controller Appliance Installation Guide
Install the appliance according to the instructions detailed in Microsoft’s Install Active Directory Domain Services (Level 100) documentation [C4].
Verify Domain Controller Installation
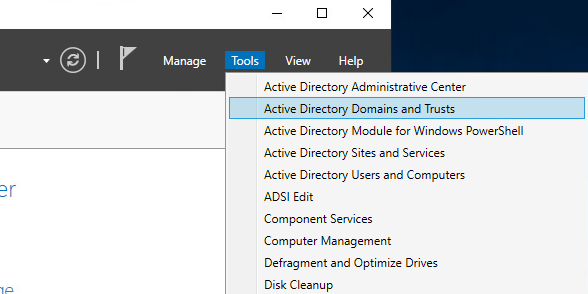
Launch Server Manager.
Click Tools > Active Directory Domains and Trusts.
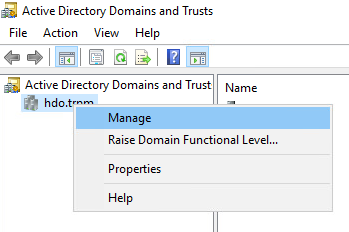
Right-click hdo.trpm.
Click Manage.
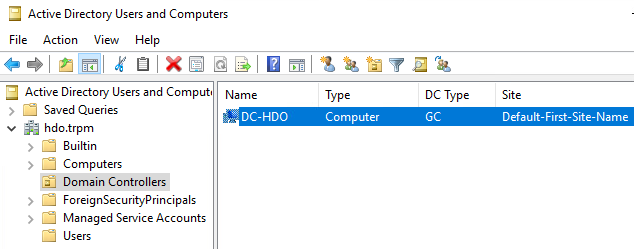
Click hdo.trpm > Domain Controllers.
Check that the Domain Controllers directory lists the new domain controller.
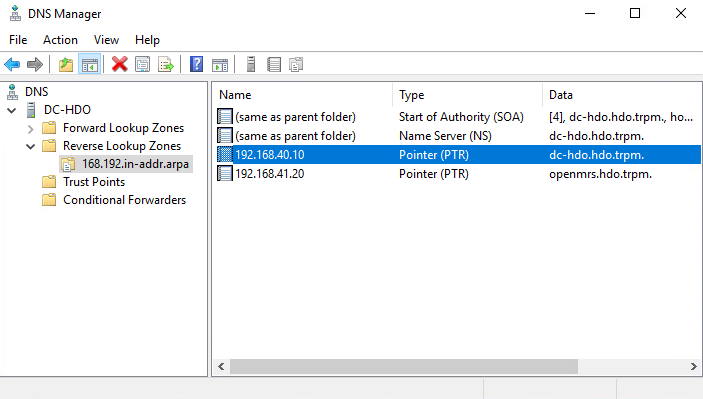
Configure Local DNS
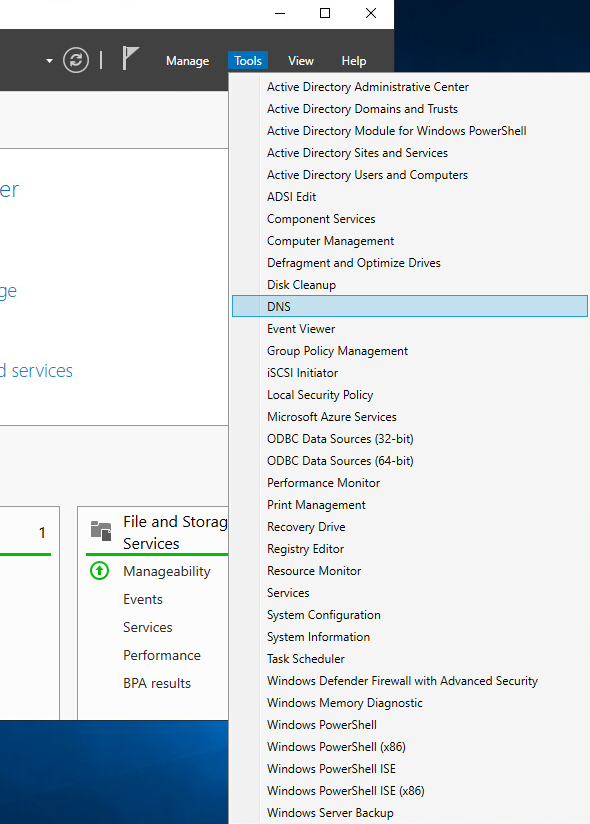
Launch Server Manager.
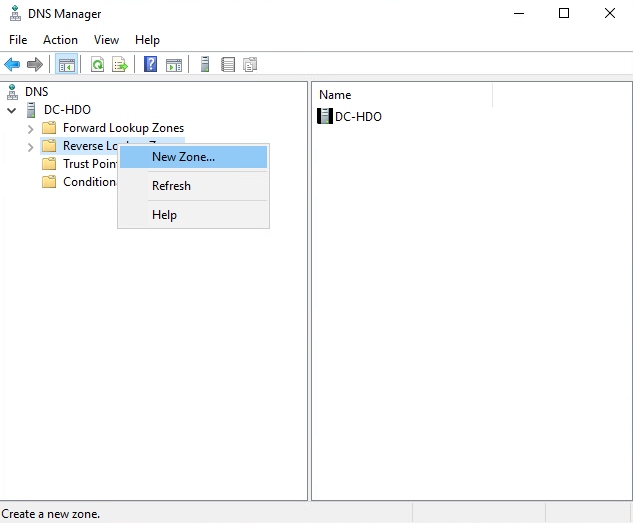
Click Tools > DNS.
Click the arrow symbol for DC-HDO.
Right-click Reverse Lookup Zones.
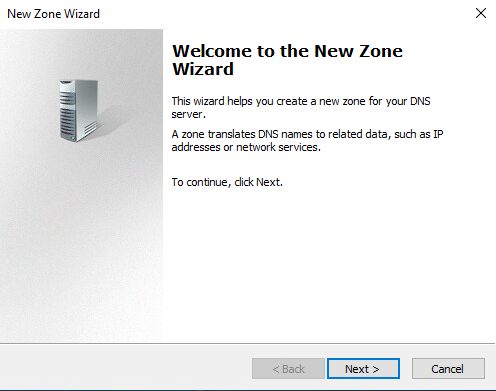
Click New Zone…. The New Zone Wizard displays.
Click Next >.
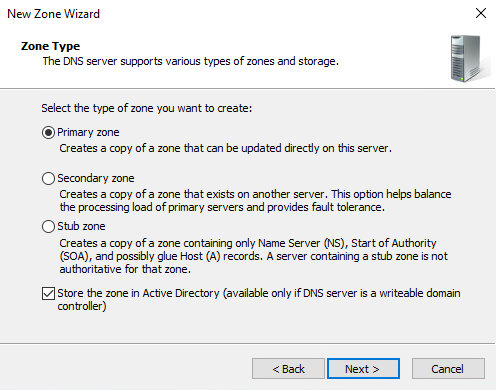
Click Primary zone.
Check Store the zone in Active Directory.
Click Next >.
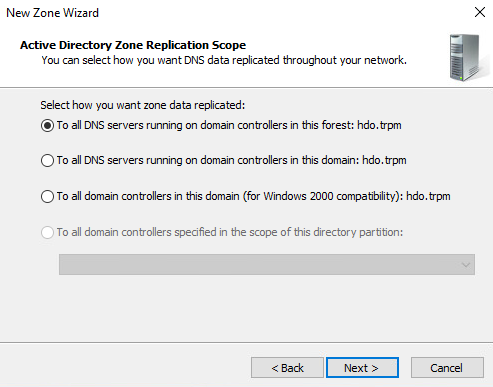
Check To all DNS servers running on domain controllers in this forest: hdo.trpm.
Click Next >.
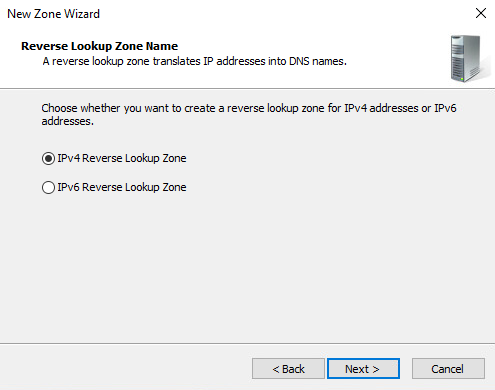
Check IPv4 Reverse Lookup Zone.
Click Next >.
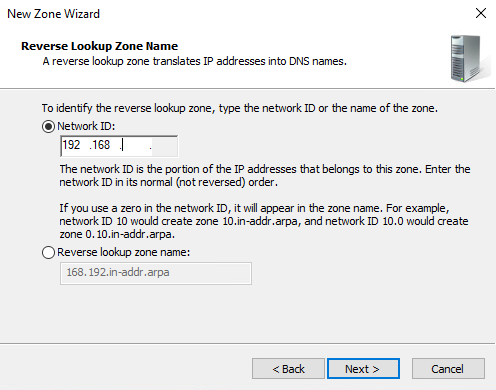
Check Network ID.
Under Network ID, type 192.168.
Click Next >.
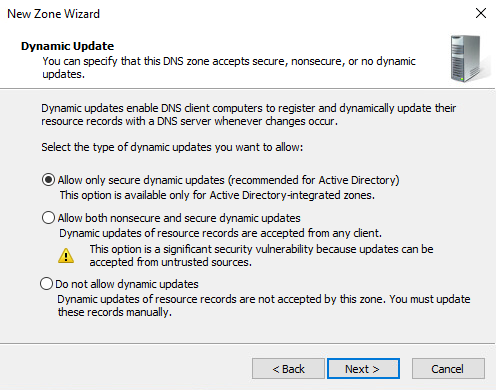
Check Allow only secure dynamic updates.
Click Next >.
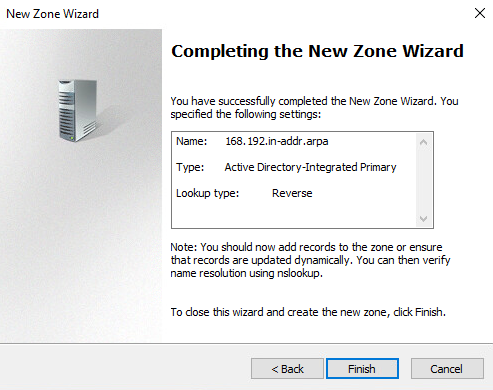
Click Finish.
Click the arrow symbol for Reverse Lookup Zones.
Right-click 168.192.in-addr.arpa.
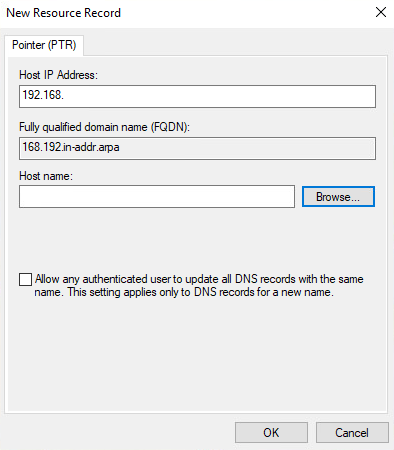
Click New Pointer (PTR)….
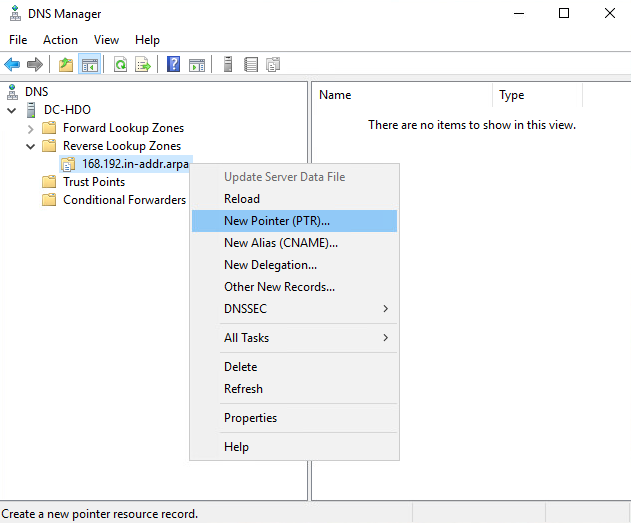
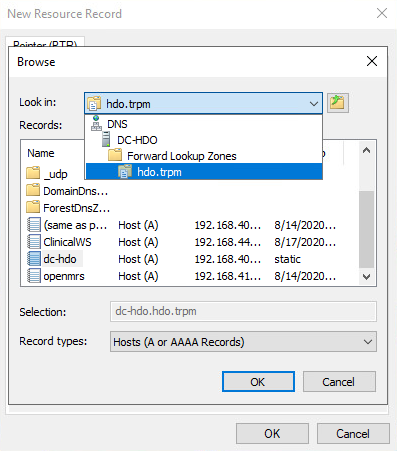
Under Host name, click Browse….
Under Look in, select hdo.trpm.
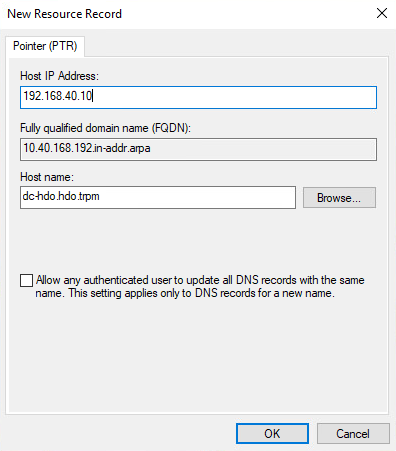
Under Records, select dc-hdo.
Click OK.
Click OK.
2.2.2.2 Cisco Firepower
Cisco Firepower consists of two primary components: Cisco Firepower Management Center and Cisco Firepower Threat Defense (FTD). Cisco Firepower provides firewall, intrusion prevention, and other networking services. This project used Cisco Firepower to implement VLAN network segmentation, network traffic filtering, internal and external routing, applying an access control policy, and Dynamic Host Configuration Protocol (DHCP). Engineers deployed Cisco Firepower as a core component for the lab’s network infrastructure.
Cisco Firepower Management Center (FMC) Appliance Information
CPU: 4
RAM: 8 GB
Storage: 250 GB (Thick Provision)
Network Adapter 1: VLAN 1327
Operating System: Cisco Fire Linux 6.4.0
Cisco Firepower Management Center Installation Guide
Install the appliance according to the instructions detailed in the Cisco Firepower Management Center Virtual Getting Started Guide [C5].
Cisco FTD Appliance Information
CPU: 8
RAM: 16 GB
Storage: 48.5 GB (Thick Provision)
Network Adapter 1: VLAN 1327
Network Adapter 2: VLAN 1327
Network Adapter 3: VLAN 1316
Network Adapter 4: VLAN 1327
Network Adapter 5: VLAN 1328
Network Adapter 6: VLAN 1329
Network Adapter 7: VLAN 1330
Network Adapter 8: VLAN 1347
Network Adapter 9: VLAN 1348
Operating System: Cisco Fire Linux 6.4.0
Cisco FTD Installation Guide
Install the appliance according to the instructions detailed in the Cisco Firepower Threat Defense Virtual for VMware Getting Started Guide in the Deploy the Firepower Threat Defense Virtual chapter [C6].
Configure FMC Management of FTD
The Cisco Firepower Threat Defense Virtual for VMware Getting Started Guide’s Managing the Firepower Threat Defense Virtual with the Firepower Management Center (FMC) chapter covers how we registered the FTD appliance with the FMC [C7].
Once the FTD successfully registers with the FMC, it will appear under Devices > Device Management in the FMC interface.
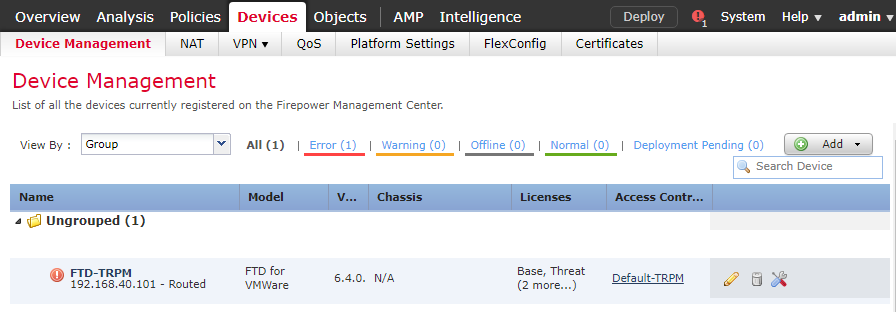
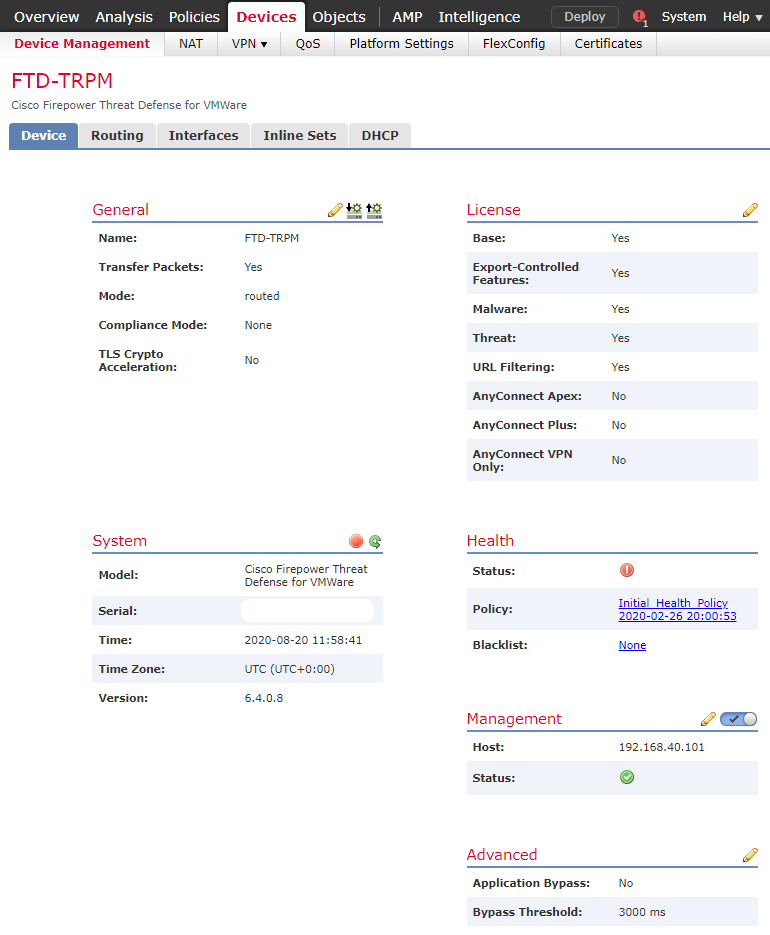
From the Device Management section, the default routes, interfaces, and DHCP settings can be configured. To view general information for the FTD appliance, navigate to Devices > Device Management > FTD-TRPM > Device.
Configure Cisco FTD Interfaces for the RPM Architecture
By default, each of the interfaces is defined as GigabitEthernet and is denoted as 0 through 6.
From Devices > Device Management > FTD-TRPM > Device, click Interfaces.
On the Cisco FTD Interfaces window, an Edit icon appears on the far right. The first GigabitEthernet interface configured is GigabitEthernet0/0. Click the Edit icon to configure the GigabitEthernet interface.

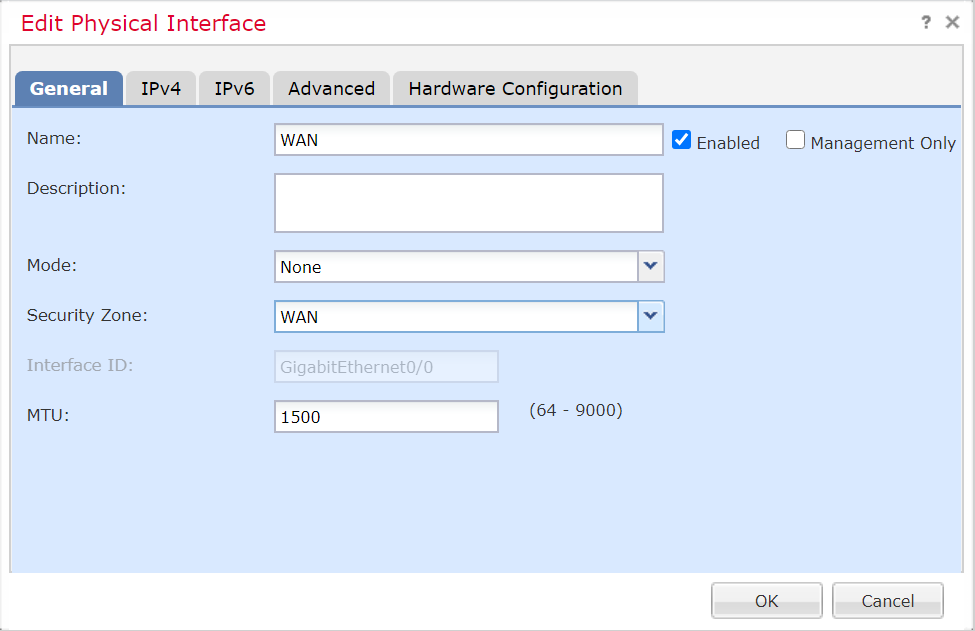
The Edit Physical Interface group box displays. Under the General tab, enter WAN in the Name field.
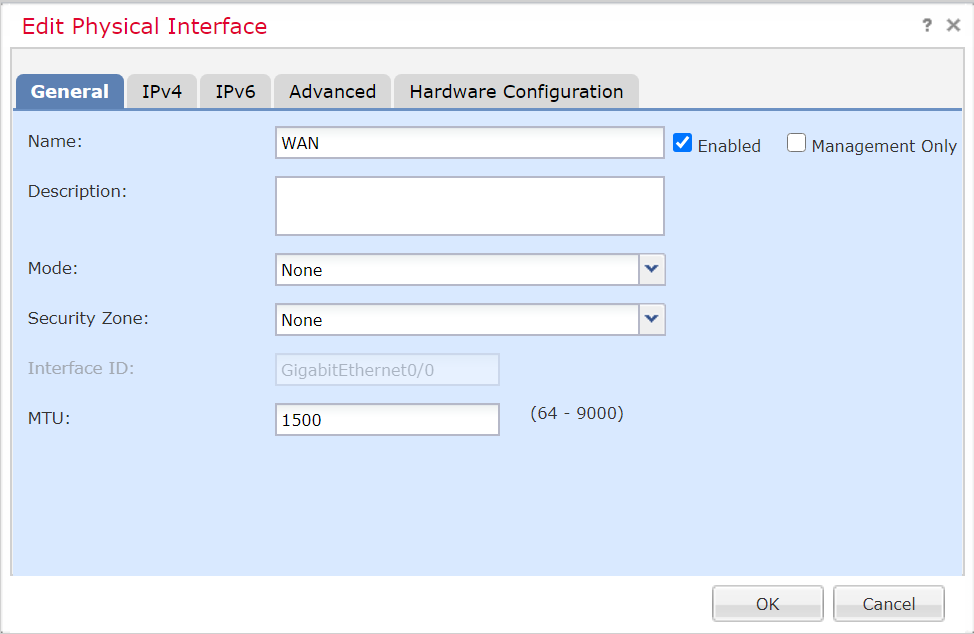
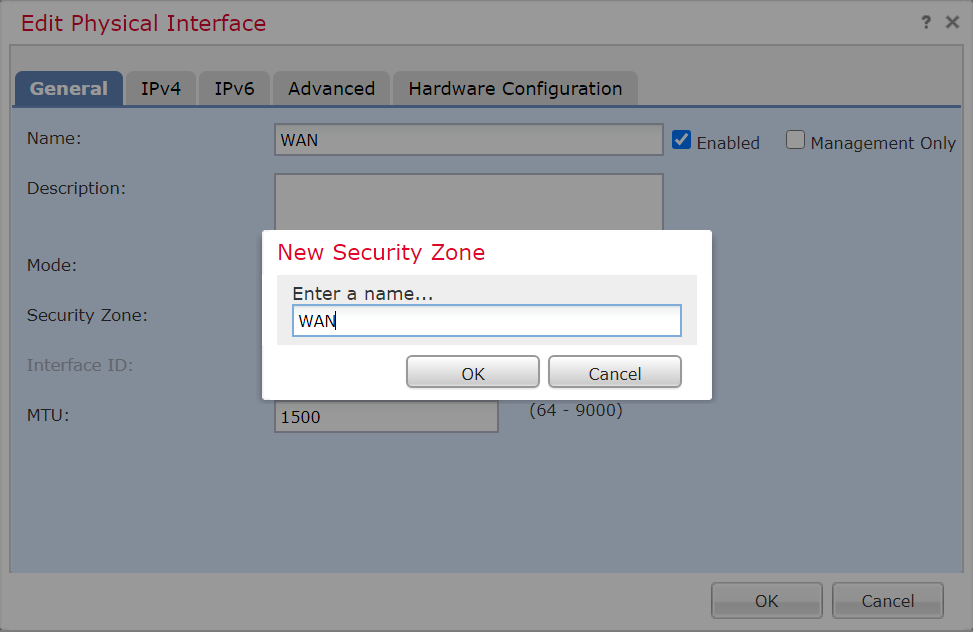
Under Security Zone, click the drop-down arrow and select New….
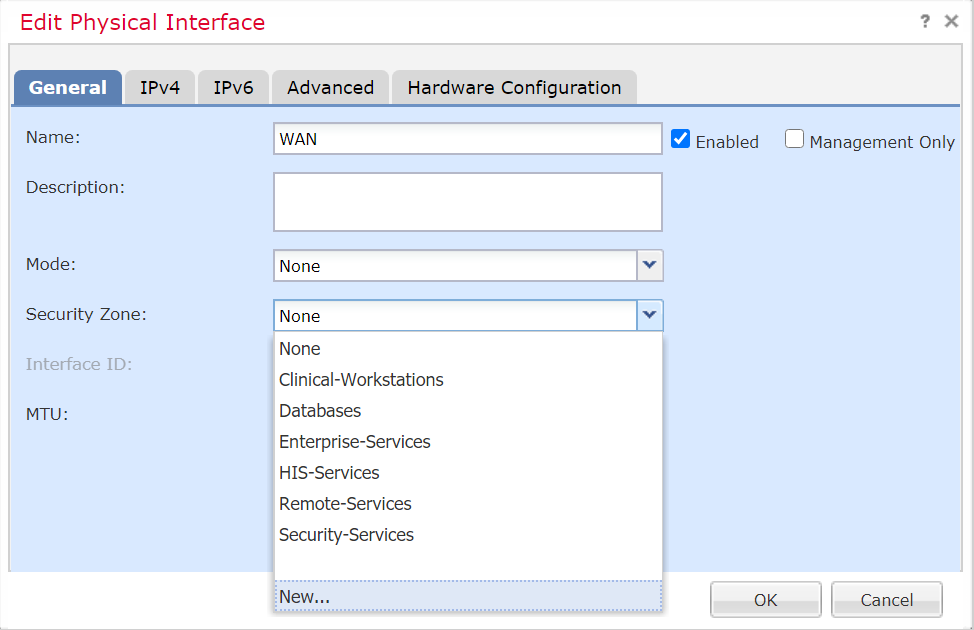
The New Security Zone pop-up box appears. Enter WAN in the Enter a name… field.
Click OK.
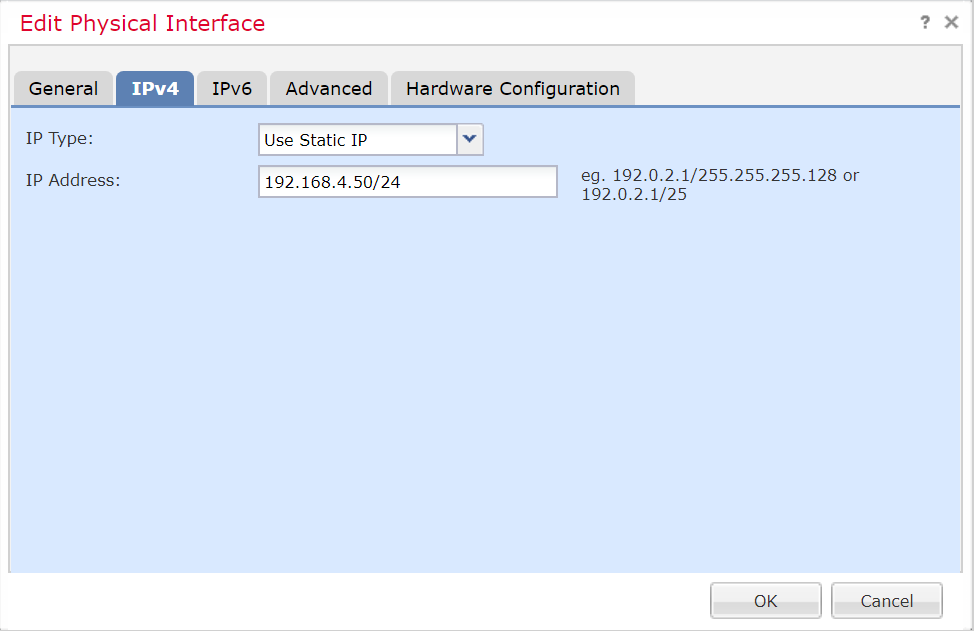
On the Edit Physical Interface page group box, click the IPv4 tab.
Fill out the following information:
IP Type: Use Static IP
IP Address: 192.168.4.50/24
Click OK.
Configure each of the other GigabitEthernet interfaces following the same pattern described above, populating the respective IP addresses that correspond to the appropriate VLAN. Values for each VLAN are described below:
GigabitEthernet0/0 (VLAN 1316)
Name: WAN
Security Zone: WAN
IP Address: 192.168.4.50/24
GigabitEthernet0/1 (VLAN 1327)
Name: Enterprise-Services
Security Zone: Enterprise-Services
IP Address: 192.168.40.1/24
GigabitEthernet0/2 (VLAN 1328)
Name: HIS-Services
Security Zone: HIS-Services
IP Address: 192.168.41.1/24
GigabitEthernet0/3 (VLAN 1329)
Name: Remote-Services
Security Zone: Remote-Services
IP Address: 192.168.42.1/24
GigabitEthernet0/4 (VLAN 1330)
Name: Databases
Security Zone: Databases
IP Address: 192.168.43.1/24
GigabitEthernet0/5 (VLAN 1347)
Name: Clinical-Workstations
Security Zone: Clinical-Workstations
IP Address: 192.168.44.1/24
GigabitEthernet0/6 (VLAN 1348)
Name: Security-Services
Security Zone: Security-Services
IP Address: 192.168.45.1/24
Click Save.
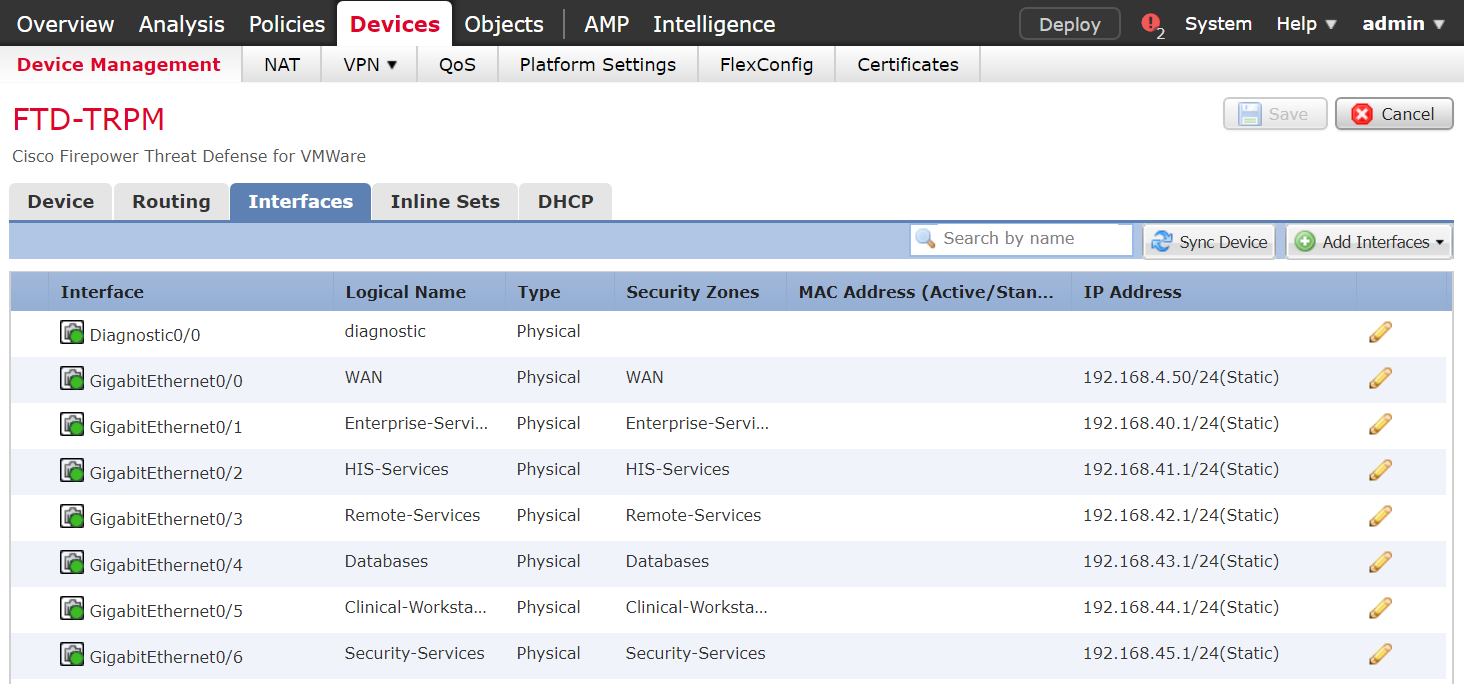
Click Deploy. Verify that the interfaces have been configured properly. Selecting the Devices tab, the Device Management screen displays the individual interfaces, assigned logical names, type of interface, security zone labeling, and assigned IP address network that corresponds to the VLANs that are assigned per security zone.
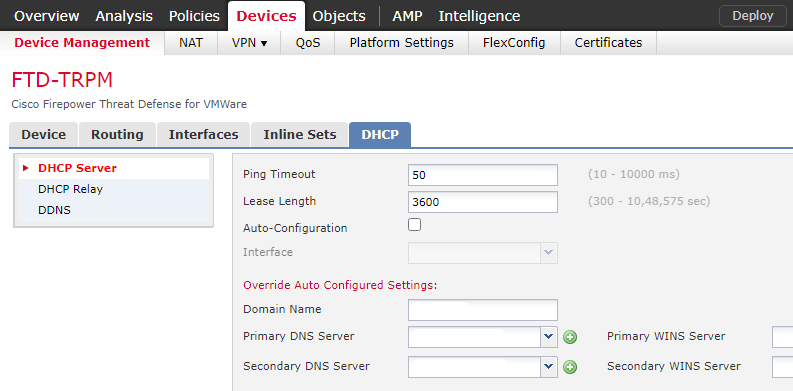
Configure Cisco FTD DHCP
From Devices > Device Management > FTD-TRPM > Interfaces, click DHCP.
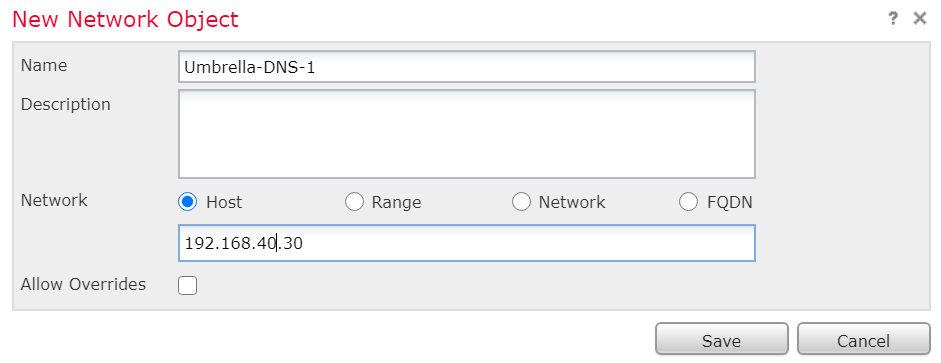
Click the plus symbol next to Primary DNS Server.
The New Network Object pop-up window appears. Fill out the following information:
Name: Umbrella-DNS-1
Network (Host): 192.168.40.30
Click Save.
Click the plus symbol next to Secondary DNS Server.
The New Network Object pop-up window appears. Fill out the following information:
Name: Umbrella-DNS-2
Network (Host): 192.168.40.31
Under Domain Name, add hdo.trpm.
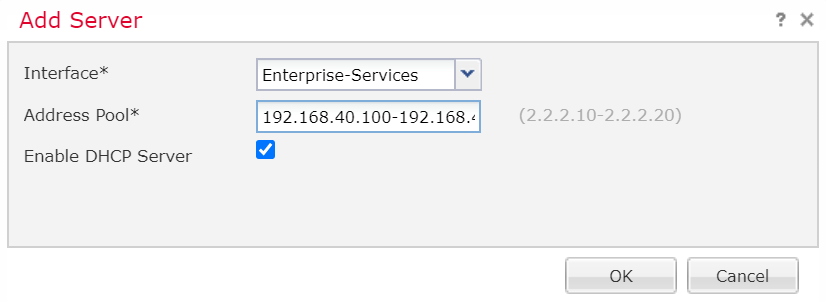
Click Add Server.
The Add Server pop-up window appears. Fill out the following information:
Interface: Enterprise-Services
Address Pool: 192.168.40.100-192.168.40.254
Enable DHCP Server: checked
Click OK.
Add additional servers by following the same pattern described above, populating the respective Interface and Address Pool, and check the Enable DHCP Server that corresponds to the appropriate server. Values for each server are described below:
Interface: Enterprise-Services
Address Pool: 192.168.40.100-192.168.40.254
Enable DHCP Server: checked
Interface: HIS-Services
Address Pool: 192.168.41.100-192.168.41.254
Enable DHCP Server: checked
Interface: Remote-Services
Address Pool: 192.168.42.100-192.168.42.254
Enable DHCP Server: checked
Interface: Databases
Address Pool: 192.168.43.100-192.168.43.254
Enable DHCP Server: checked
Interface: Clinical-Workstations
Address Pool: 192.168.44.100-192.168.44.254
Enable DHCP Server: checked
Interface: Security-Services
Address Pool: 192.168.45.100-192.168.45.254
Enable DHCP Server: checked
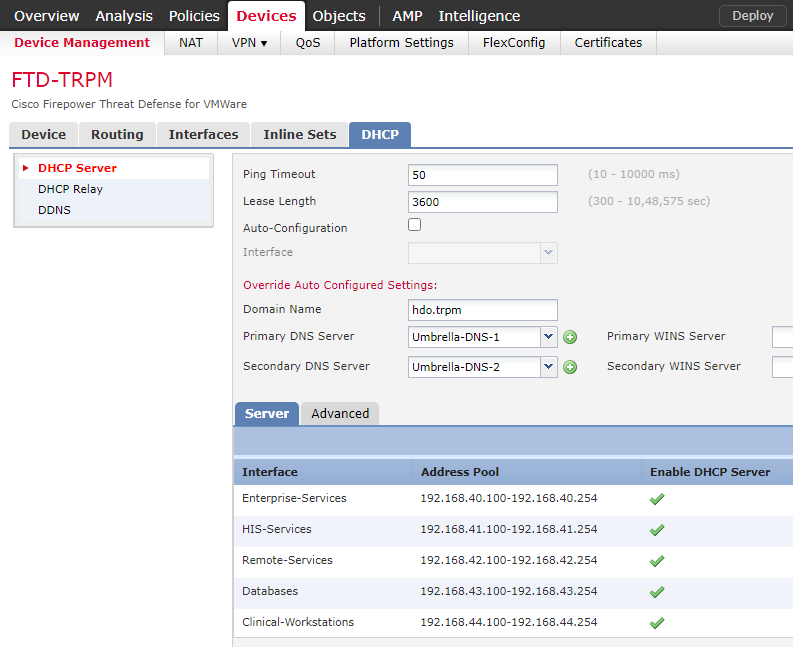
Click Save.
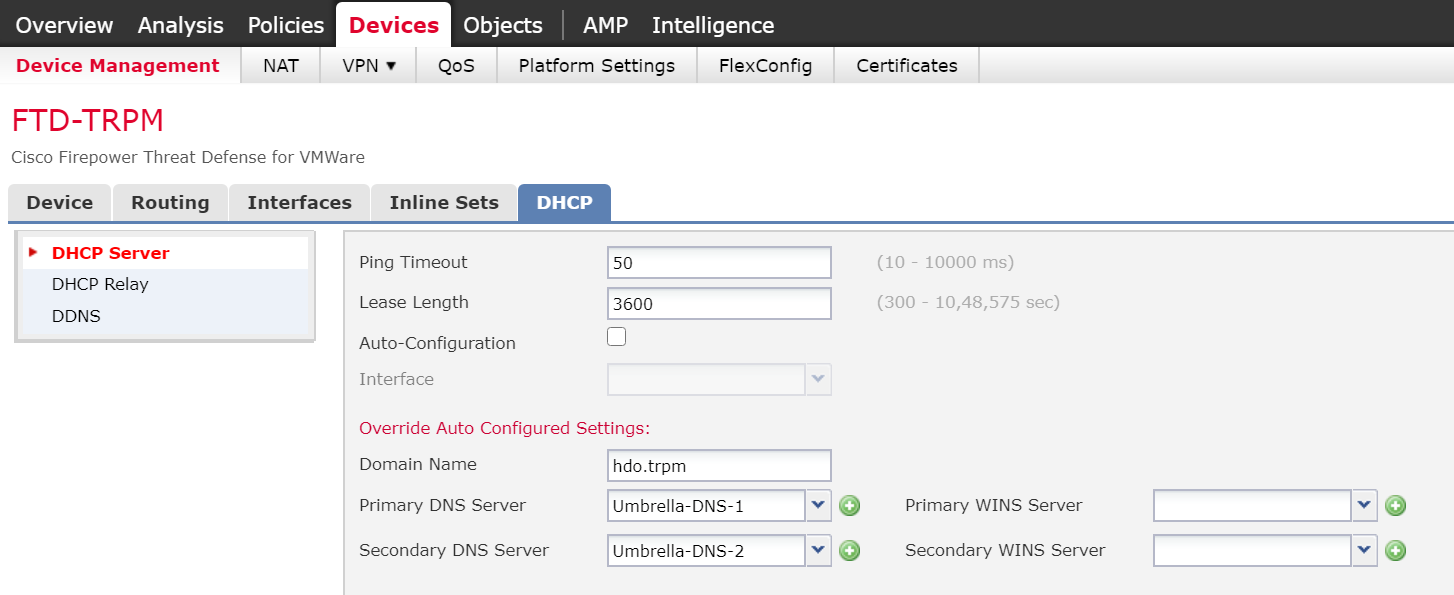
Click Deploy. Verify that the DHCP servers have been configured properly. Select the Devices tab and review the DHCP server configuration settings. Values for Ping Timeout and Lease Length correspond to default values that were not altered. The Domain Name is set to hdo.trpm, with values that were set for the primary and secondary DNS servers. Below the DNS server settings, a Server tab displays the DHCP address pool that corresponds to each security zone. Under the Interface heading, view each security zone label that aligns to the assigned Address Pool and review that the Enable DHCP Server setting appears as a green check mark.
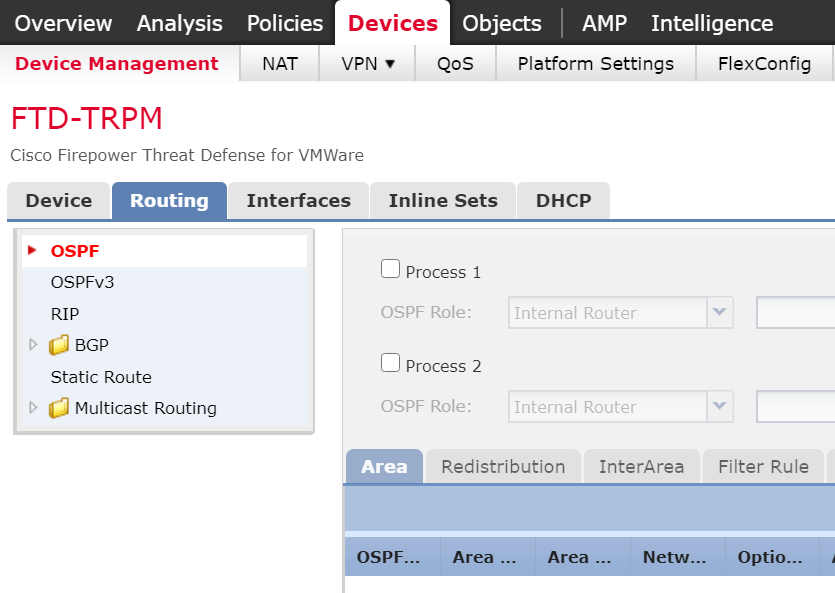
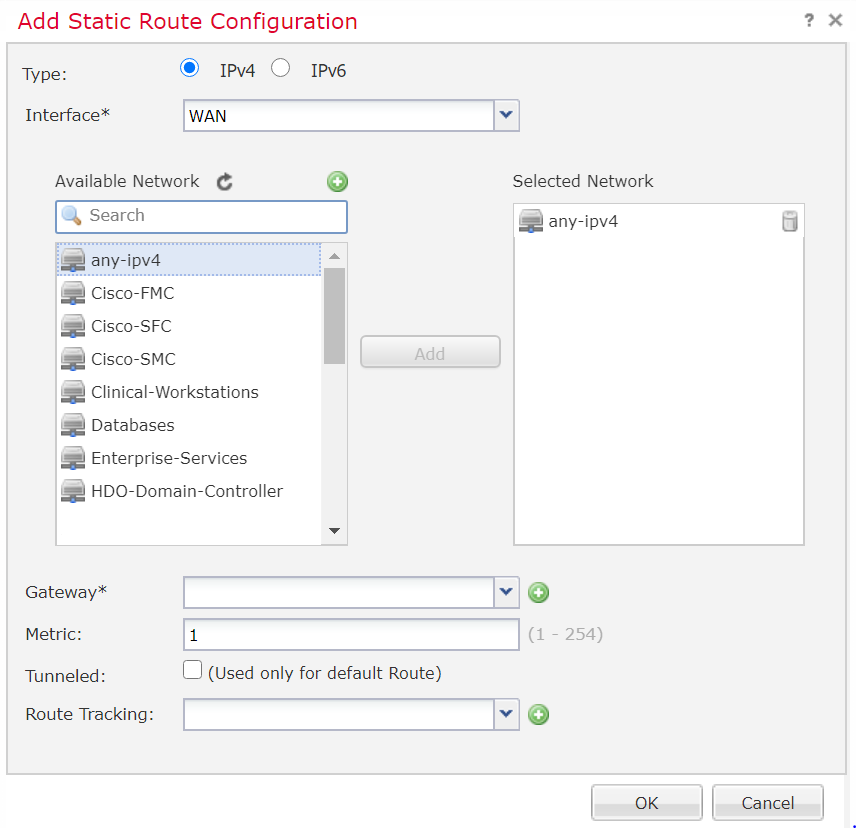
Configure Cisco FTD Static Route
From Devices > Device Management > FTD-TRPM > DHCP, click Routing.
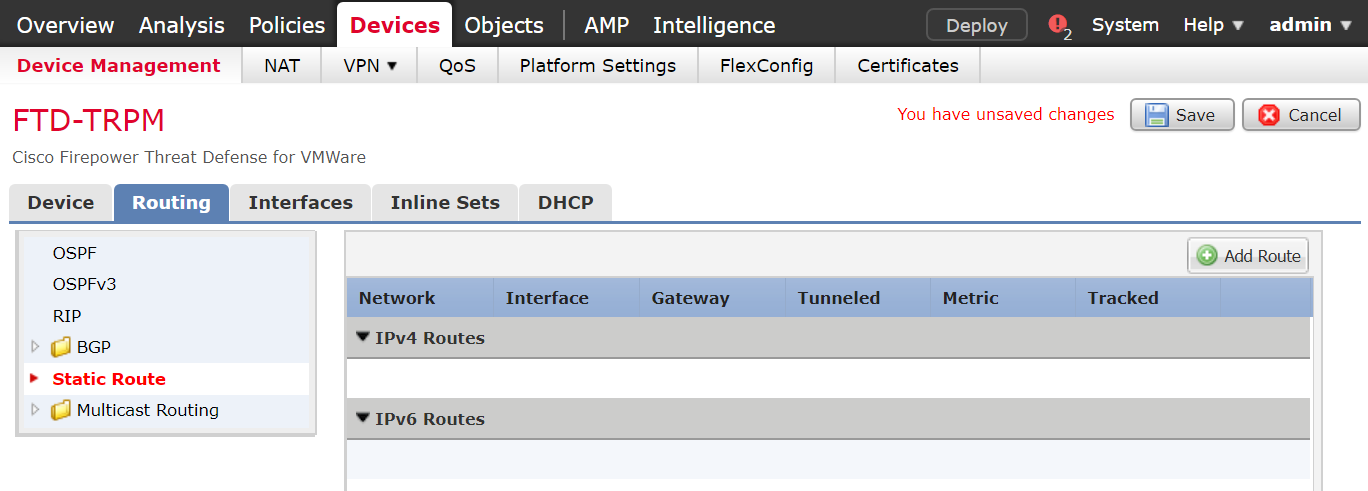
Click Static Route.
Click Add Route.
The Add Static Route Configuration pop-up window appears. Fill out the following information:
Interface: WAN
Selected Network: any-ipv4
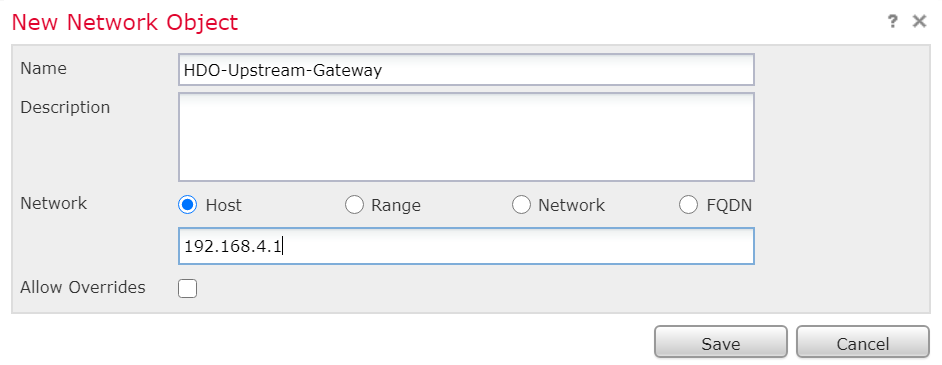
Click the plus symbol next to Gateway.
The New Network Object pop-up window appears. Fill out the following information:
Name: HDO-Upstream-Gateway
Network (Host): 192.168.4.1
Click Save.
Click OK.
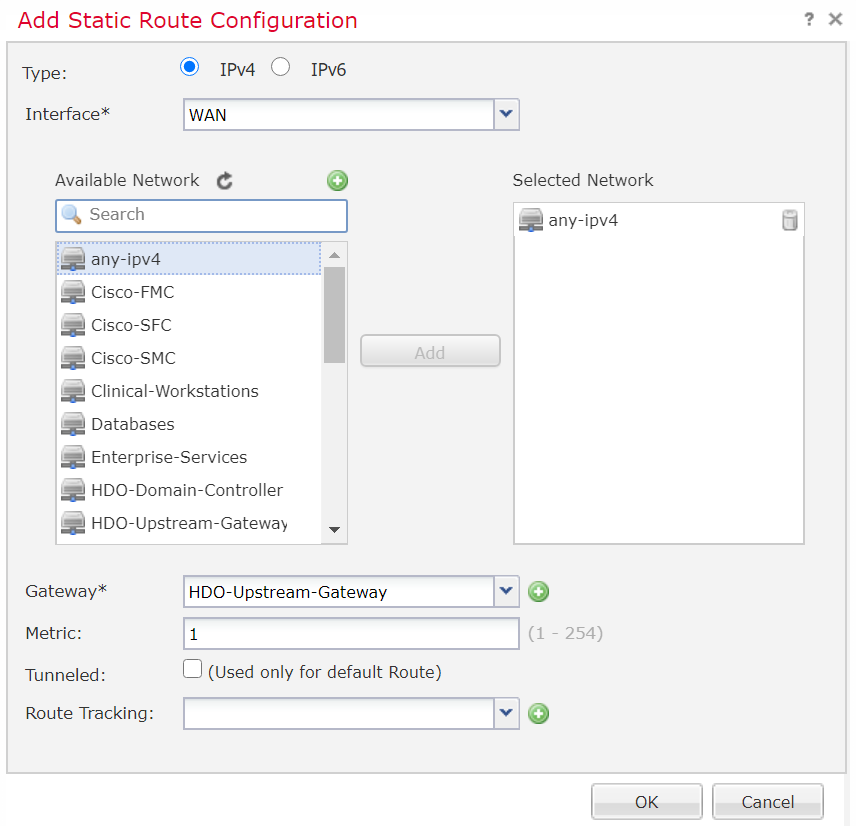
Click Save.
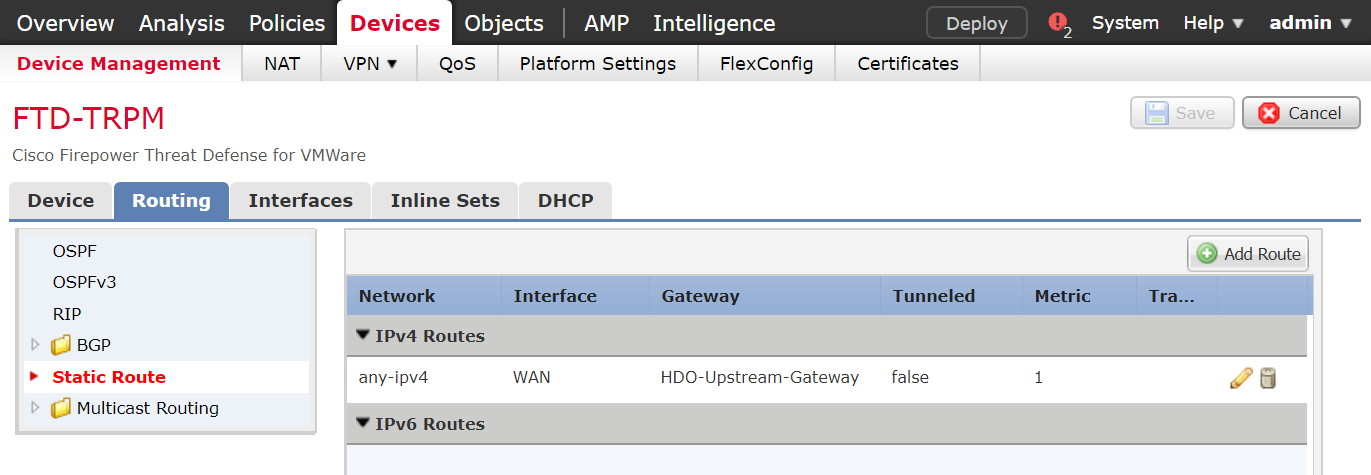
Click Deploy. Verify that the static route has been set correctly. From Devices, when selecting the Routing tab, the Static Route will indicate the network routing settings. The screen displays the static route settings in a table format that includes values for Network, Interface, Gateway, Tunneled, and Metric. The static route applies to the IP addressing that has been specified, where network traffic traverses the interface. Note the Gateway value. The Tunneled and Metric values display the default value.
Configure Cisco FTD Network Address Translation (NAT)
Click Devices > NAT.
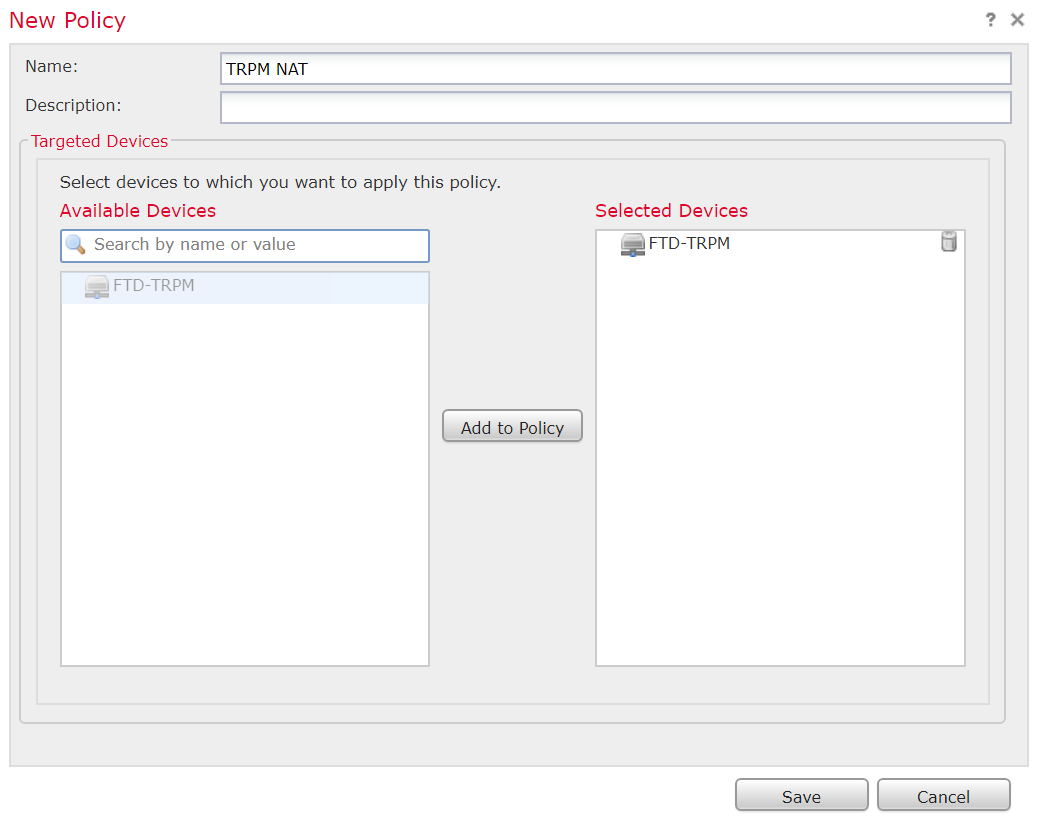
Click New Policy > Threat Defense NAT.
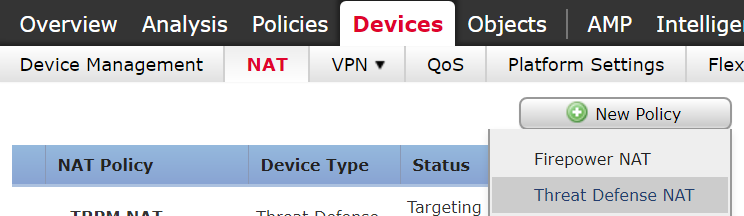
- The New Policy pop-up window appears. Fill out the following
information:
Name: TRPM NAT
Selected Devices: FTD-TRPM
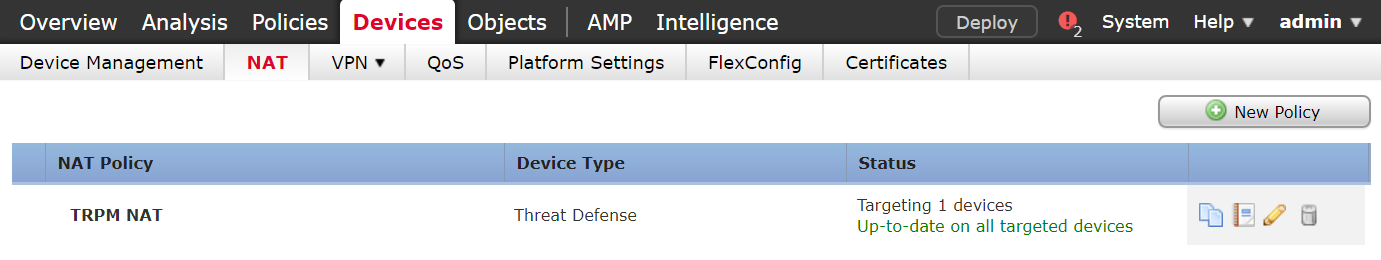
Click Save.
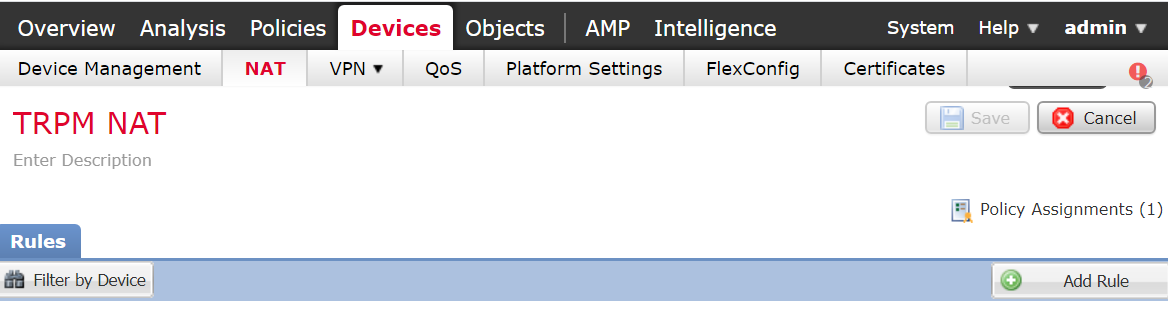
Click the edit symbol for TRPM NAT.
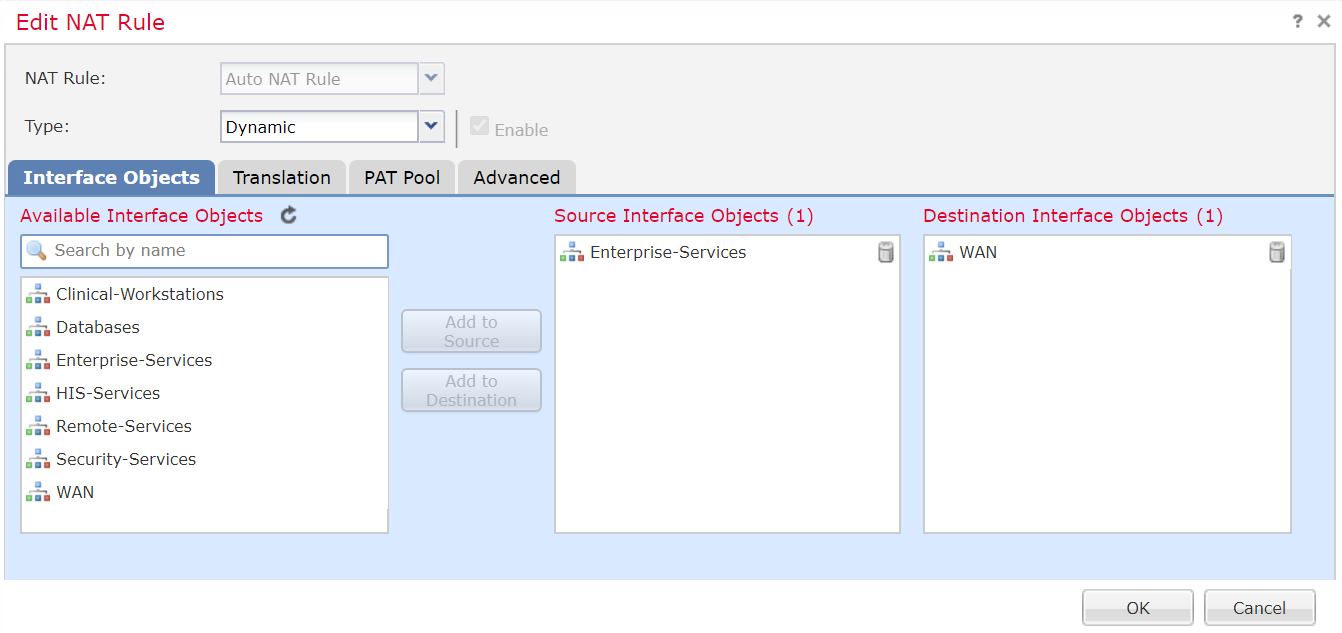
Click Add Rule.
The Edit NAT Rule pop-up window appears. Under Interface Objects, fill out the following information:
NAT Rule: Auto NAT Rule
Type: Dynamic
Source Interface Objects: Enterprise-Services
Destination Interface Objects: WAN
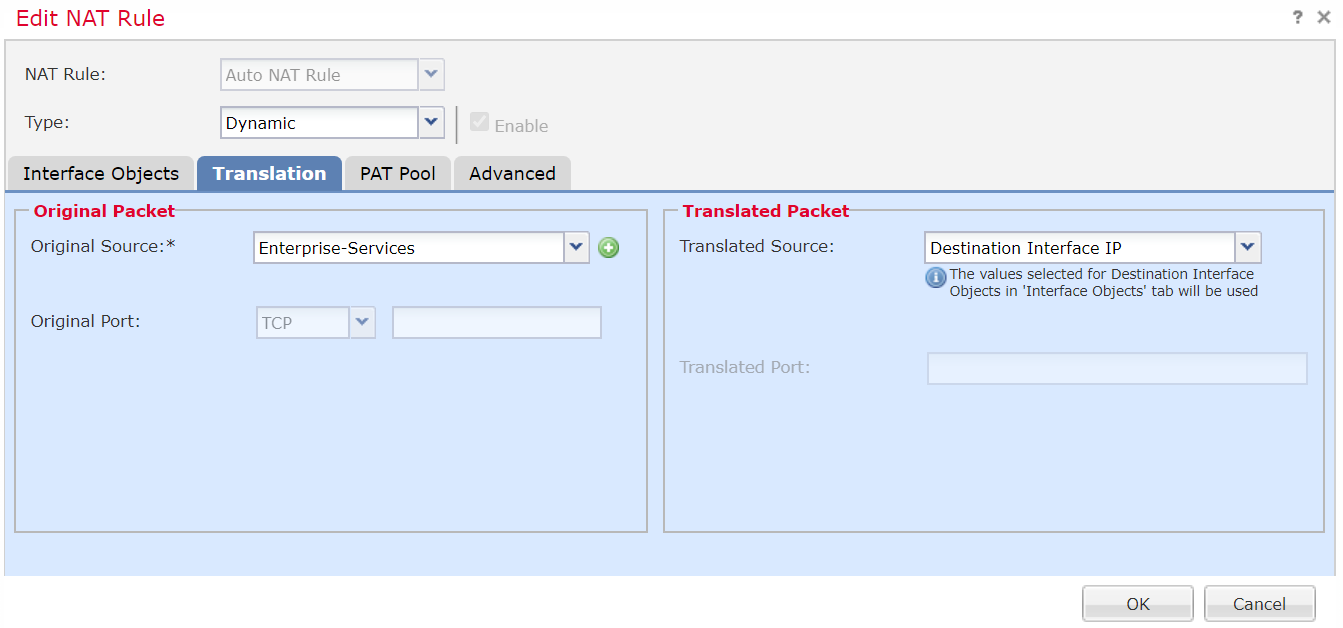
Click Translation.
Under Translation, fill out the following information:
Original Source: Enterprise-Services
Translated Source: Destination Interface IP
Click OK.
Create additional rules following the same pattern described above, populating the respective information for each rule. Values for each rule are described below:
HIS-Services
NAT Rule: Auto NAT Rule
Type: Dynamic
Source Interface Objects: HIS-Services
Destination Interface Objects: WAN
Original Source: HIS-Services
Translated Source: Destination Interface IP
Remote-Services
NAT Rule: Auto NAT Rule
Type: Dynamic
Source Interface Objects: Remote-Services
Destination Interface Objects: WAN
Original Source: Remote-Services
Translated Source: Destination Interface IP
Databases
NAT Rule: Auto NAT Rule
Type: Dynamic
Source Interface Objects: Databases
Destination Interface Objects: WAN
Original Source: Databases
Translated Source: Destination Interface IP
Clinical-Workstations
NAT Rule: Auto NAT Rule
Type: Dynamic
Source Interface Objects: Clinical-Workstations
Destination Interface Objects: WAN
Original Source: Clinical-Workstations
Translated Source: Destination Interface IP
Security-Services
NAT Rule: Auto NAT Rule
Type: Dynamic
Source Interface Objects: Security-Services
Destination Interface Objects: WAN
Original Source: Security-Services
Translated Source: Destination Interface IP
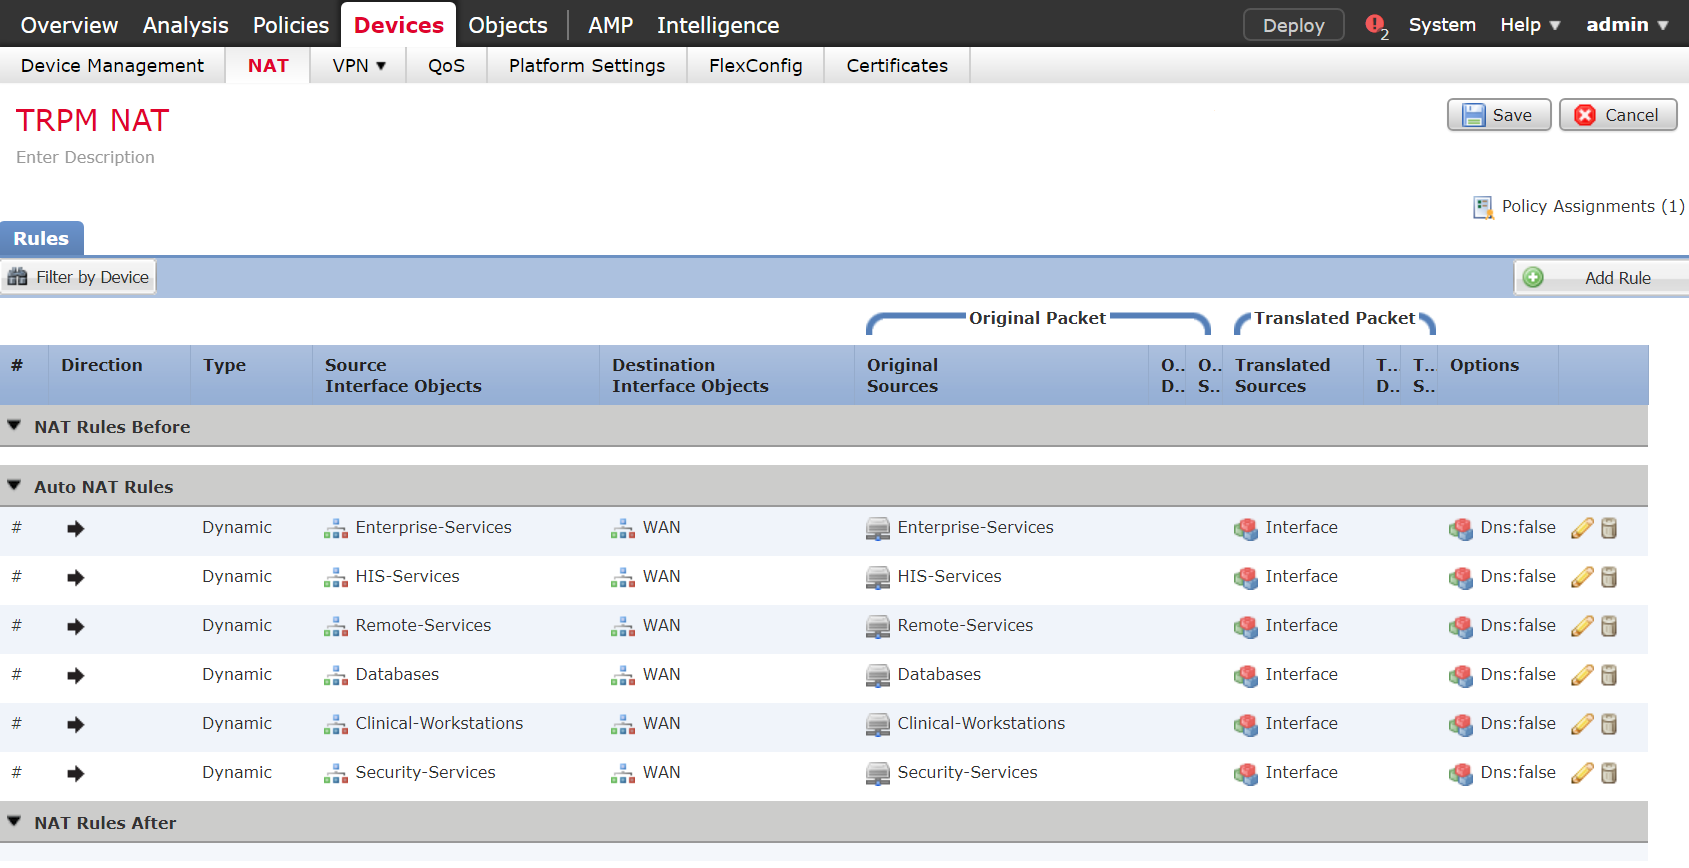
Click Save.
Click Deploy. Verify the NAT settings through the Devices screen. The NAT rules are displayed in a table format. The table includes values for Direction of the NAT displayed as a directional arrow, the NAT Type, the Source Interface Objects (i.e., the security zone IP networks), the Destination Interface Objects, the Original Sources (i.e., these addresses correspond to the IP network from where the network traffic originates), the Translated Sources, and Options. The settings indicate that IP addresses from the configured security zones are translated behind the Interface IP address.
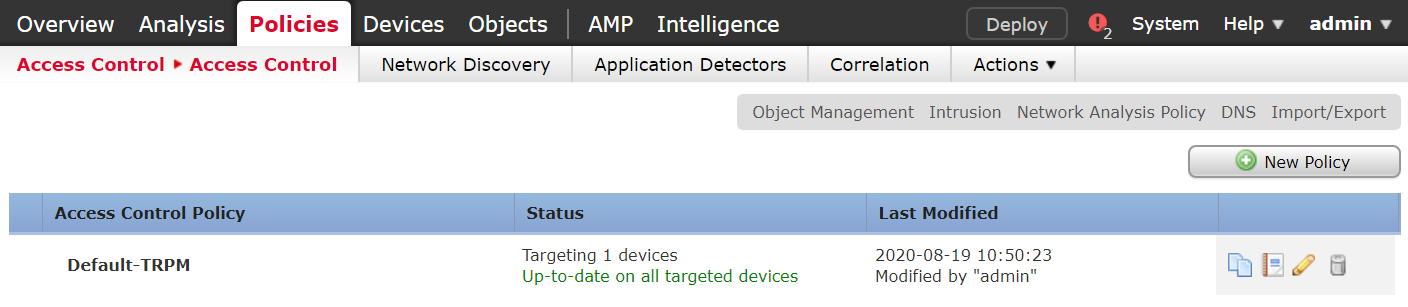
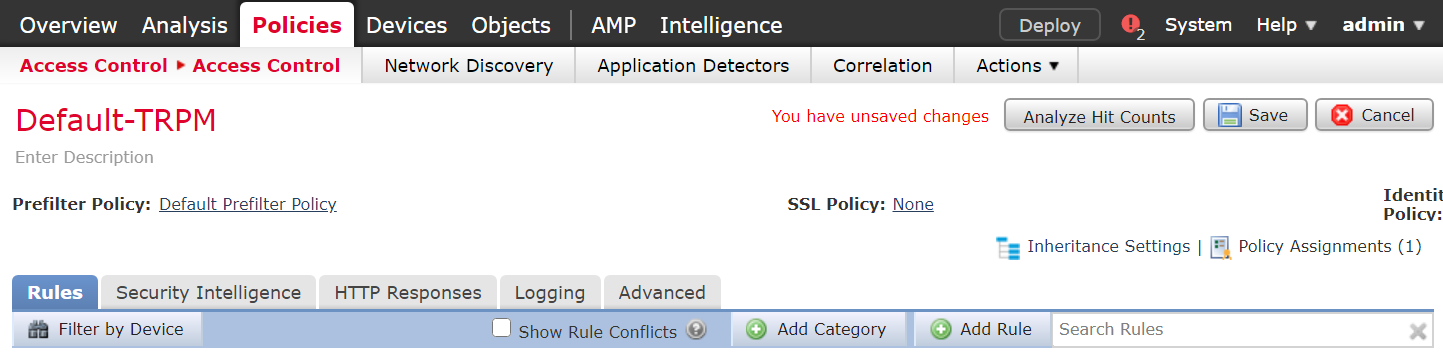
Configure Cisco FTD Access Control Policy
Click Polices > Access Control > Access Control.
Click the edit symbol for Default-TRPM.
Click Add Category.
Fill out the following information:
Name: Security Services
Insert: into Mandatory
Click OK.
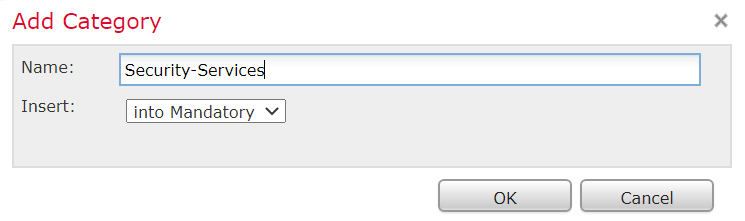
Repeat the previous steps of Add Category section for each network segment in the architecture.
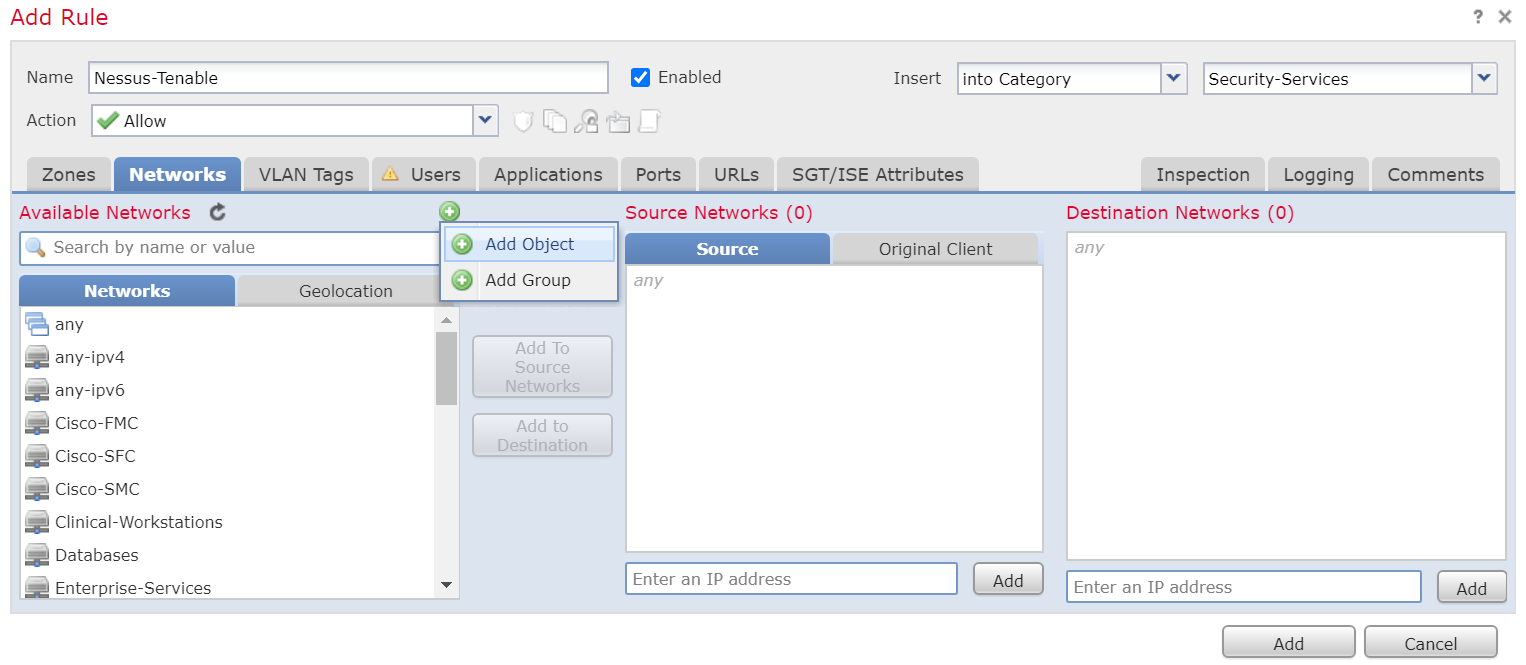
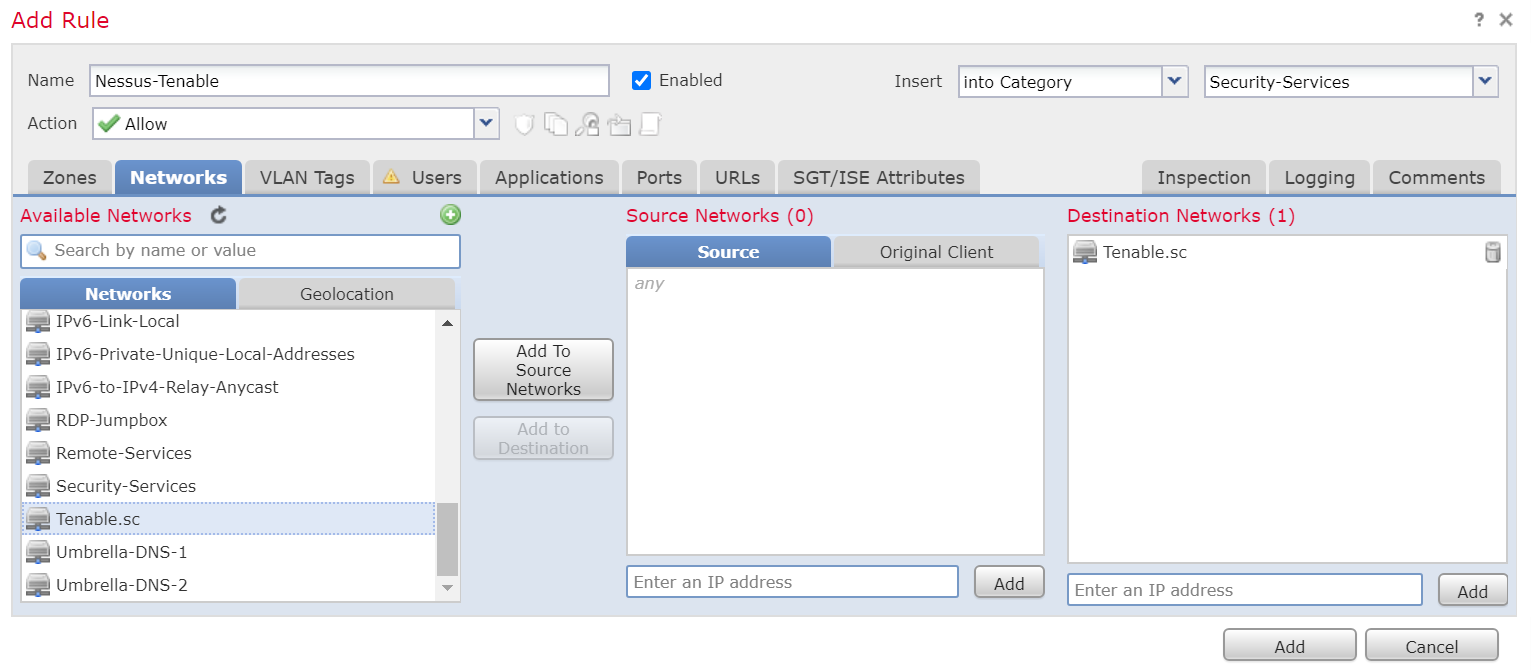
Click Add Rule.
When the Add Rule screen appears, fill out the following information:
Name: Nessus-Tenable
Action: Allow
Insert: into Category, Security Services
- Under Networks, click the plus symbol next to
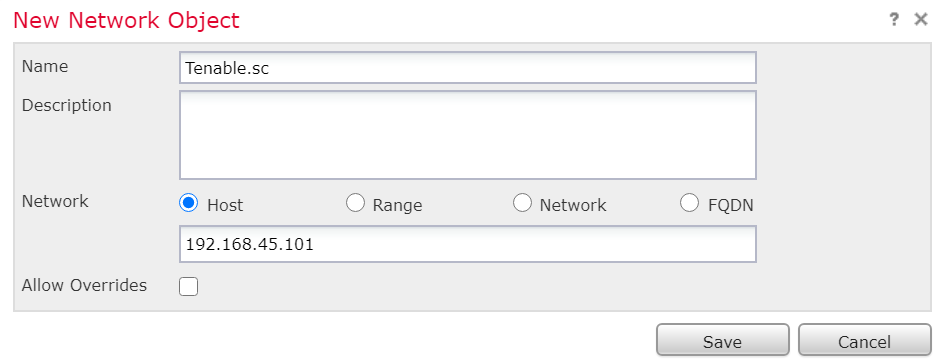
Available Networks and select Add Object.
When the New Network Object pop-up window appears, fill out the following information:
Name: Tenable.sc
Network (Host): 192.168.45.101
Click Save.
In the Add Rule screen, under the Networks tab, set Destination Networks to Tenable.sc.
Click Ports.
In the Add Rule screen, under the Ports tab, set Selected Destination Ports to 8834.
Click Add.
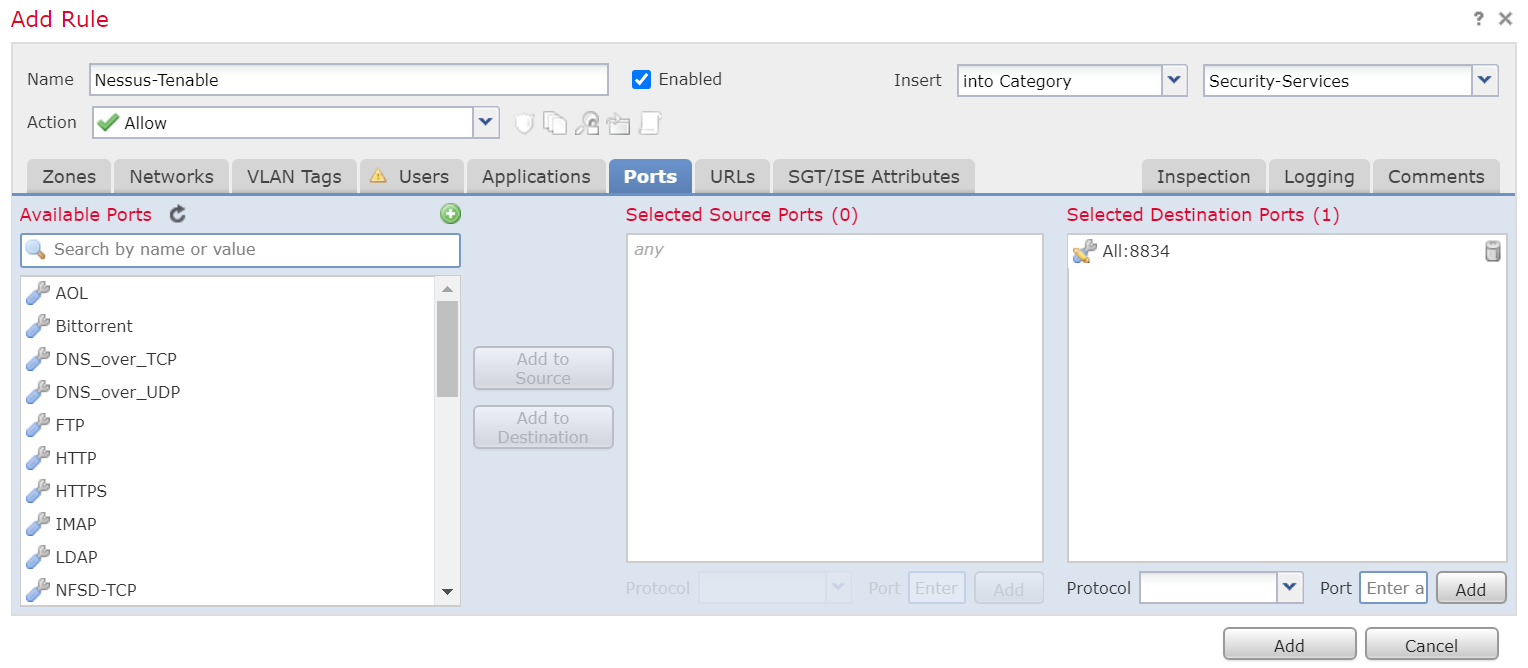
Repeat the previous steps for any network requirement rules if necessary.
Click Save.
Click Deploy.
2.2.3 Security Continuous Monitoring
The project team implemented a set of tools that included Cisco Stealthwatch, Cisco Umbrella, and LogRhythm to address security continuous monitoring. This practice guide uses Cisco Stealthwatch for NetFlow analysis. Cisco Umbrella is a service used for DNS-layer monitoring. The LogRhythm tools aggregate log file information from across the HDO infrastructure and allow behavioral analytics.
2.2.4 Cisco Stealthwatch
Cisco Stealthwatch provides network visibility and analysis through network telemetry. This project integrates Cisco Stealthwatch with Cisco Firepower, sending NetFlow directly from the Cisco FTD appliance to a Stealthwatch Flow Collector (SFC) for analysis.
Cisco Stealthwatch Management Center (SMC) Appliance Information
CPU: 4
RAM: 16 GB
Storage: 200 GB (Thick Provision)
Network Adapter 1: VLAN 1348
Operating System: Linux
Cisco SMC Appliance Installation Guide
Install the appliance according to the instructions detailed in the Cisco Stealthwatch Installation and Configuration Guide 7.1 [C8].
Cisco SFC Appliance Information
CPU: 4
RAM: 16 GB
Storage: 300 GB (Thick Provision)
Network Adapter 1: VLAN 1348
Operating System: Linux
Cisco SFC Appliance Installation Guide
Install the appliance according to the instructions detailed in the Cisco Stealthwatch Installation and Configuration Guide 7.1 [C8].
Accept the default port value 2055 for NetFlow.
Configure Cisco FTD NetFlow for Cisco SFC
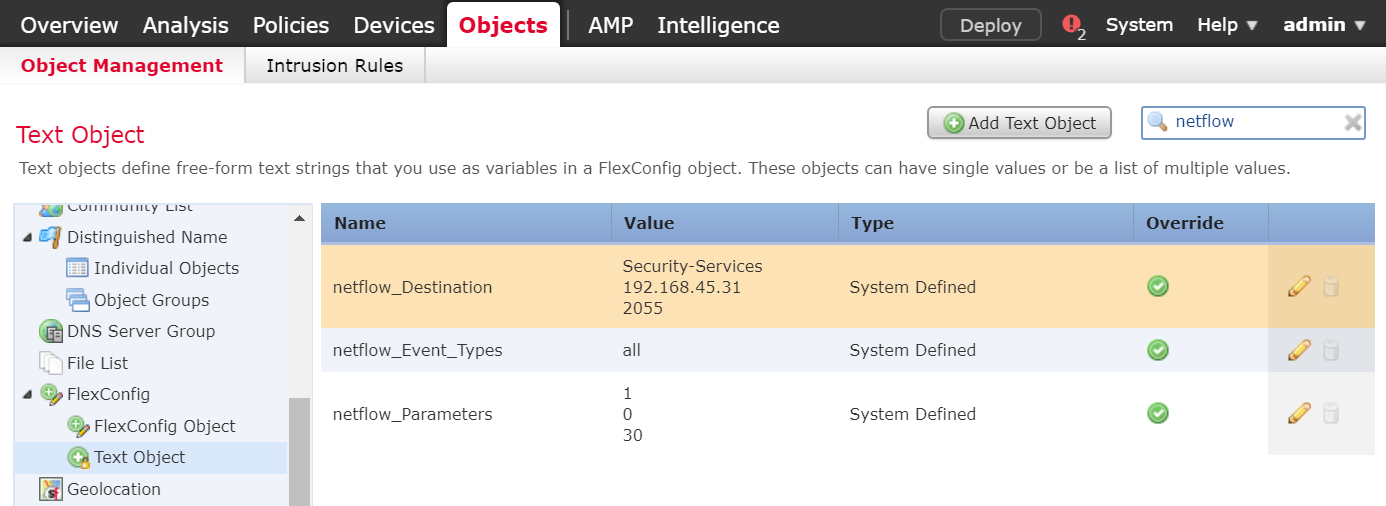
Click Objects > Object Management > FlexConfig > Text Object.
In the search box, type
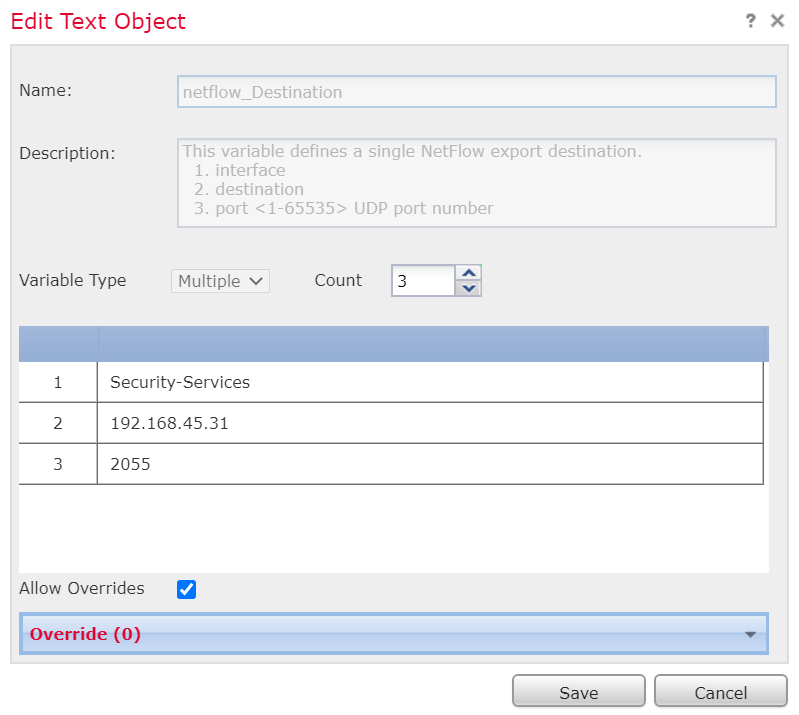
netflow.Click the edit symbol for netflow_Destination.
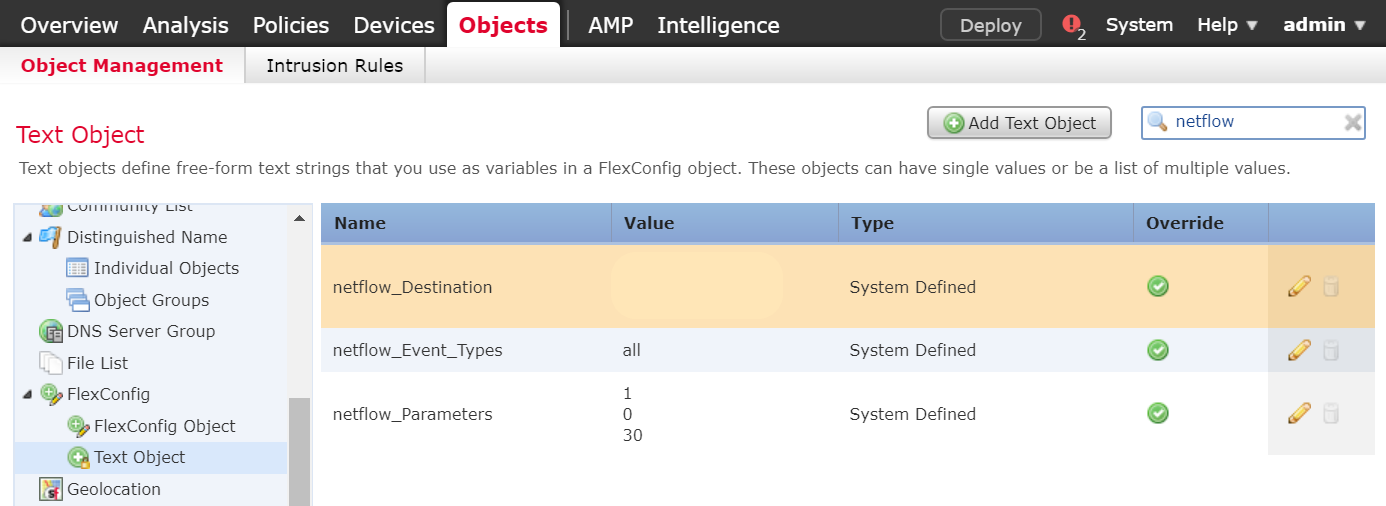
When the Edit Text Object pop-up window appears, fill out the following information:
Count: 3
1: Security Services
2: 192.168.45.31
3: 2055
Allow Overrides: checked
Click Save.
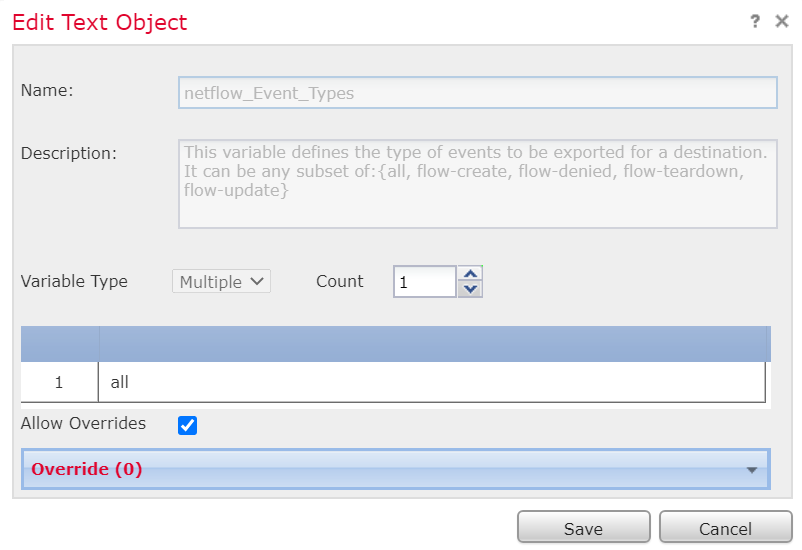
Click the edit symbol for netflow_Event_Types.
When the Edit Text Object pop-up window appears, fill out the following information:
Count: 1
1: All
Allow Overrides: checked
Click Save.
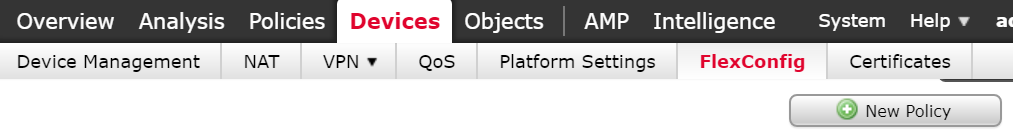
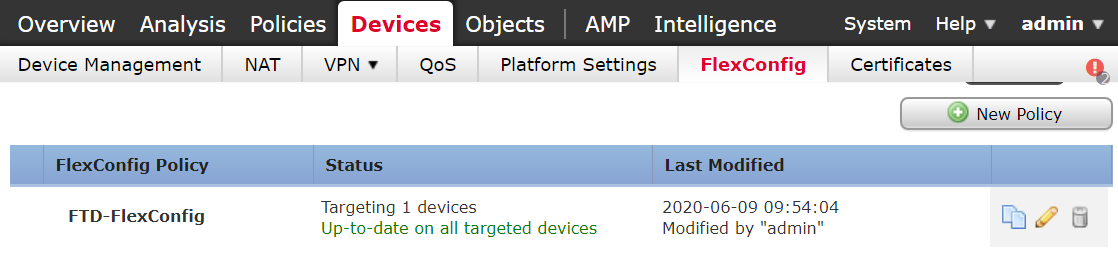
Click Devices > FlexConfig.
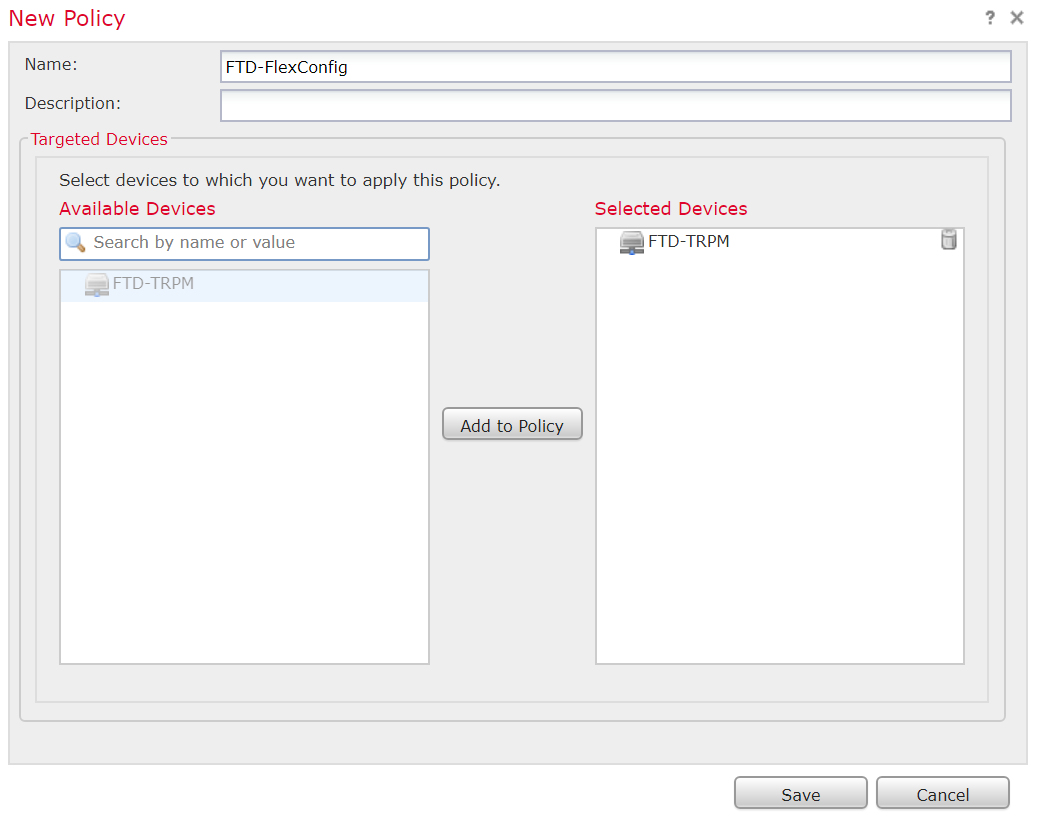
Click New Policy.
When the New Policy screen appears, fill out the following information:
Name: FTD-FlexConfig
Selected Devices: FTD-TRPM
Click Save.
Click the edit symbol for FTD-FlexConfig.
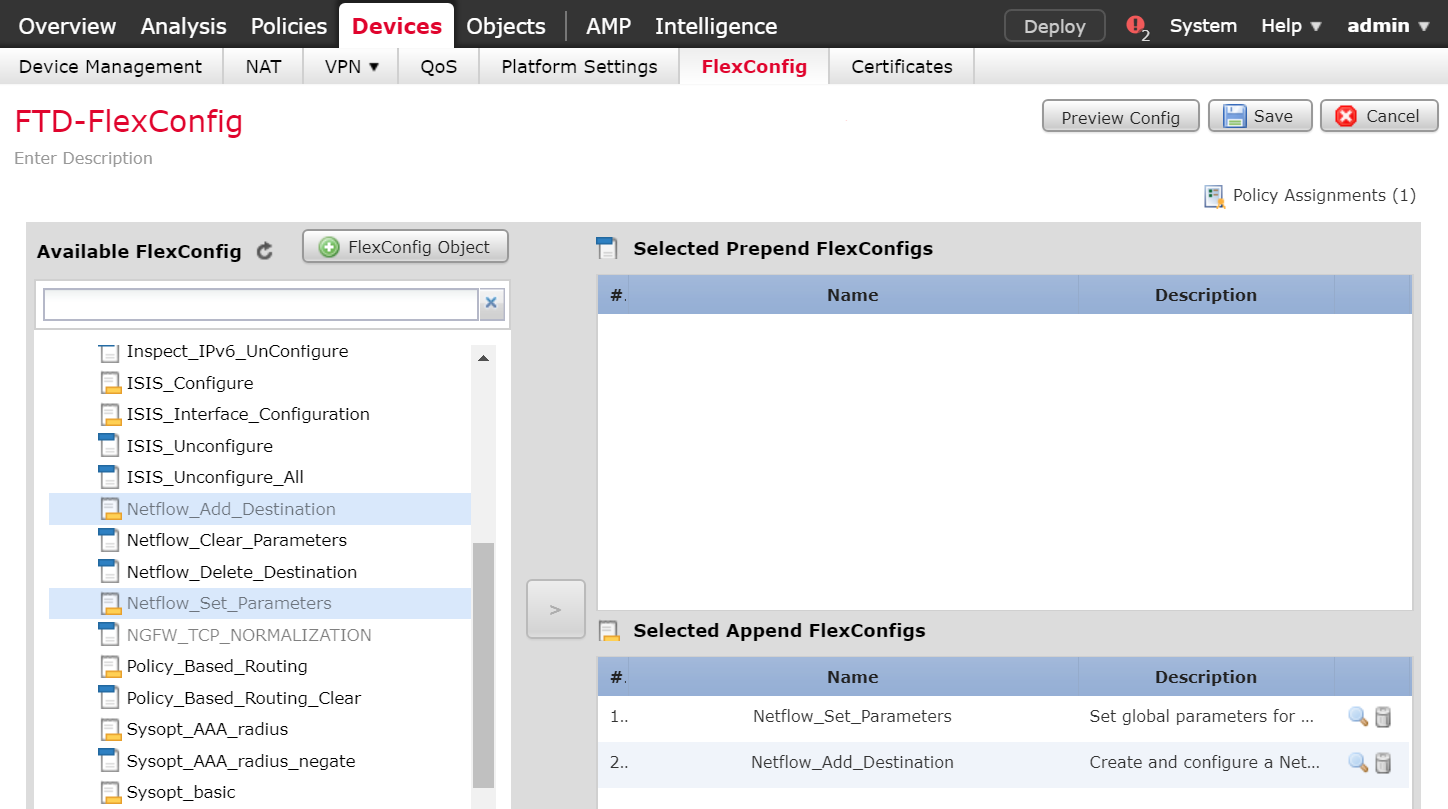
Under the Devices tab, select Netflow_Add_Destination and Netflow_Set_Parameters.
Click the right-arrow symbol to move the selections to the Selected Append FlexConfigs section.
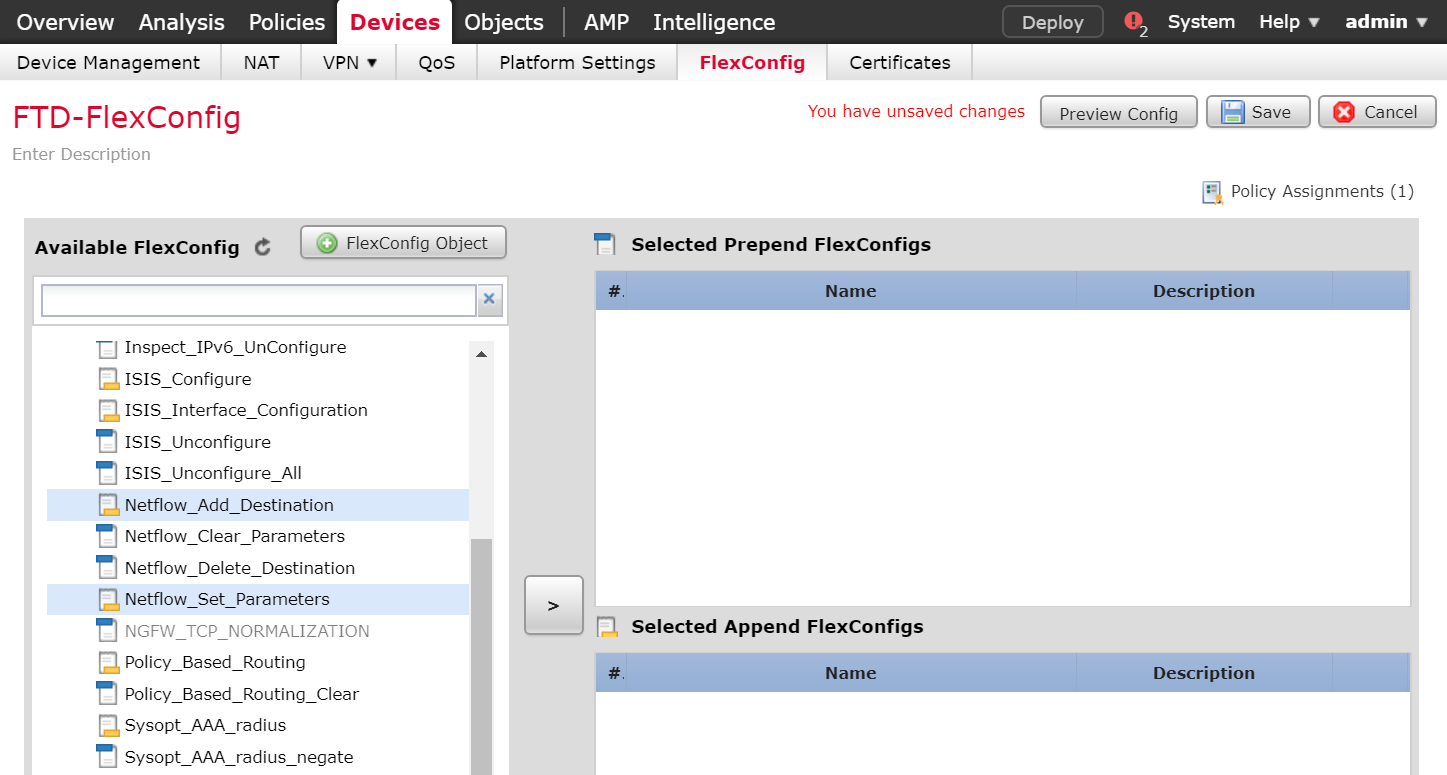
Click Save.
Click Deploy. From the Devices screen, verify the FlexConfig settings. Select the FlexConfig tab. The NetFlow configurations appear in the lower right of the screen as a table. Under Selected Append FlexConfigs, the table includes columns labeled # that corresponds to the number of configurations that have been made: Name and Description.
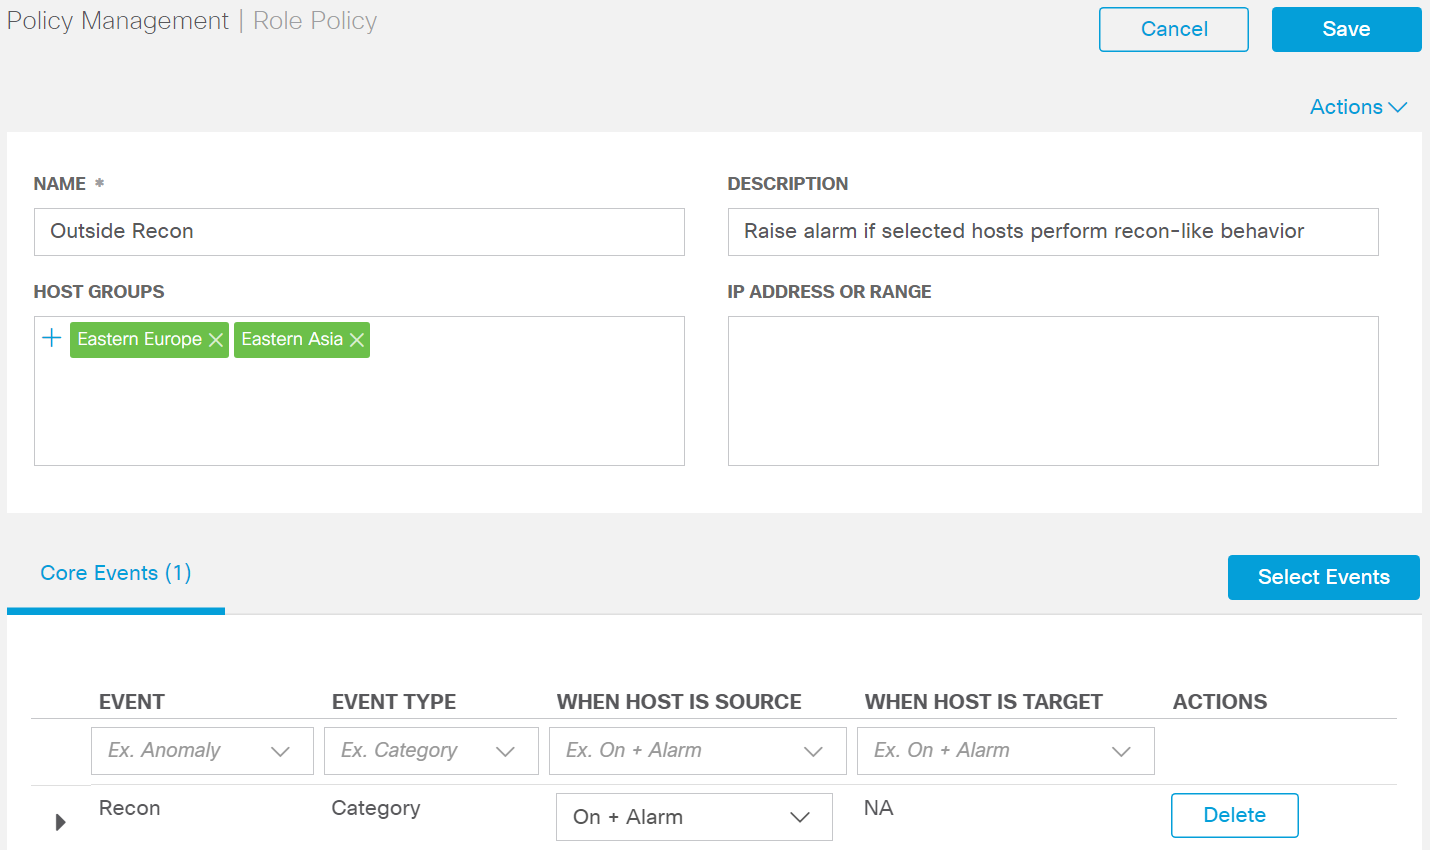
Create a Custom Policy Management Rule
Click Configure > Policy Management.
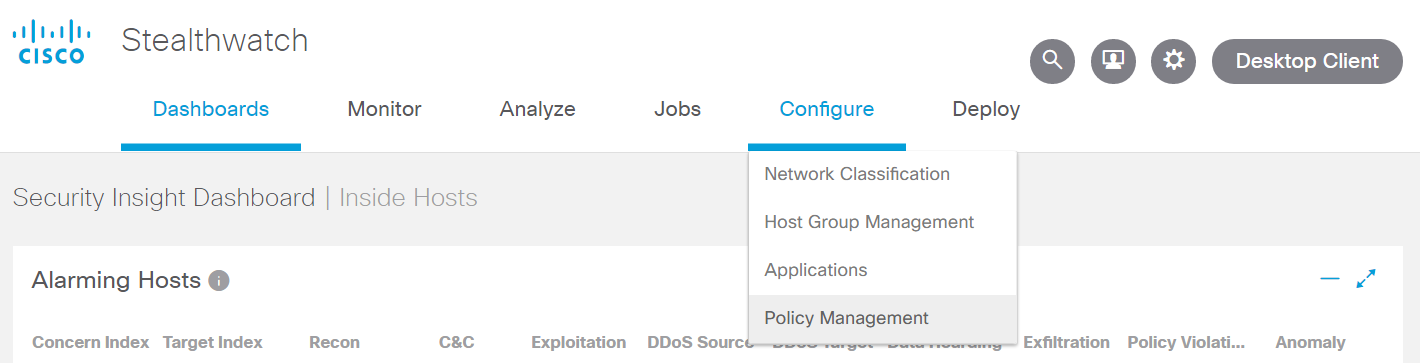
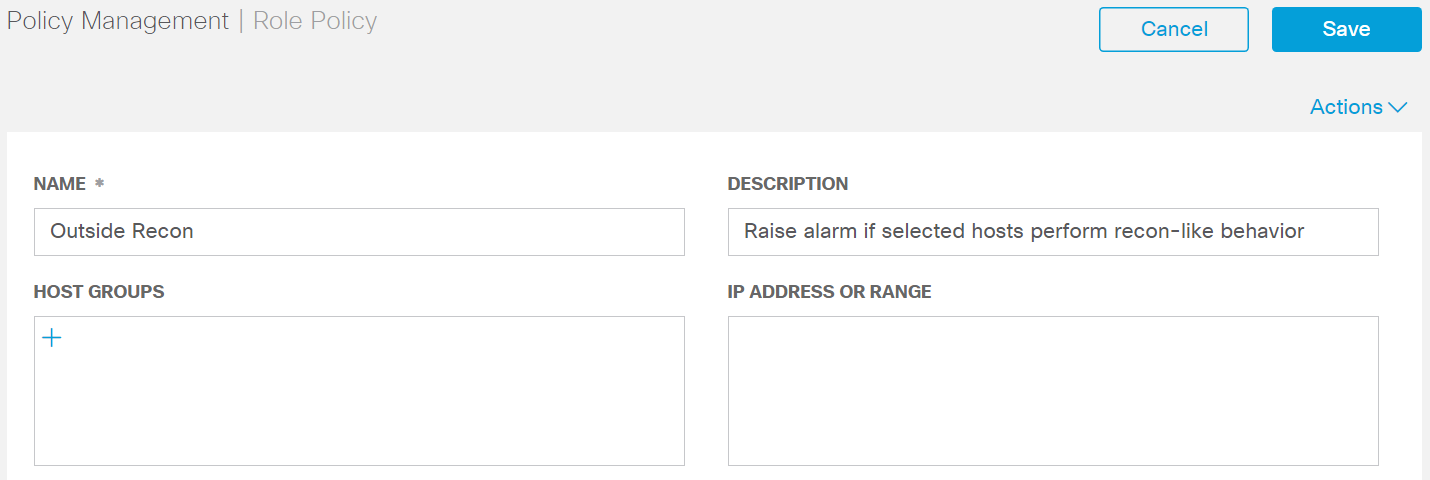
Click Create New Policy > Role Policy.
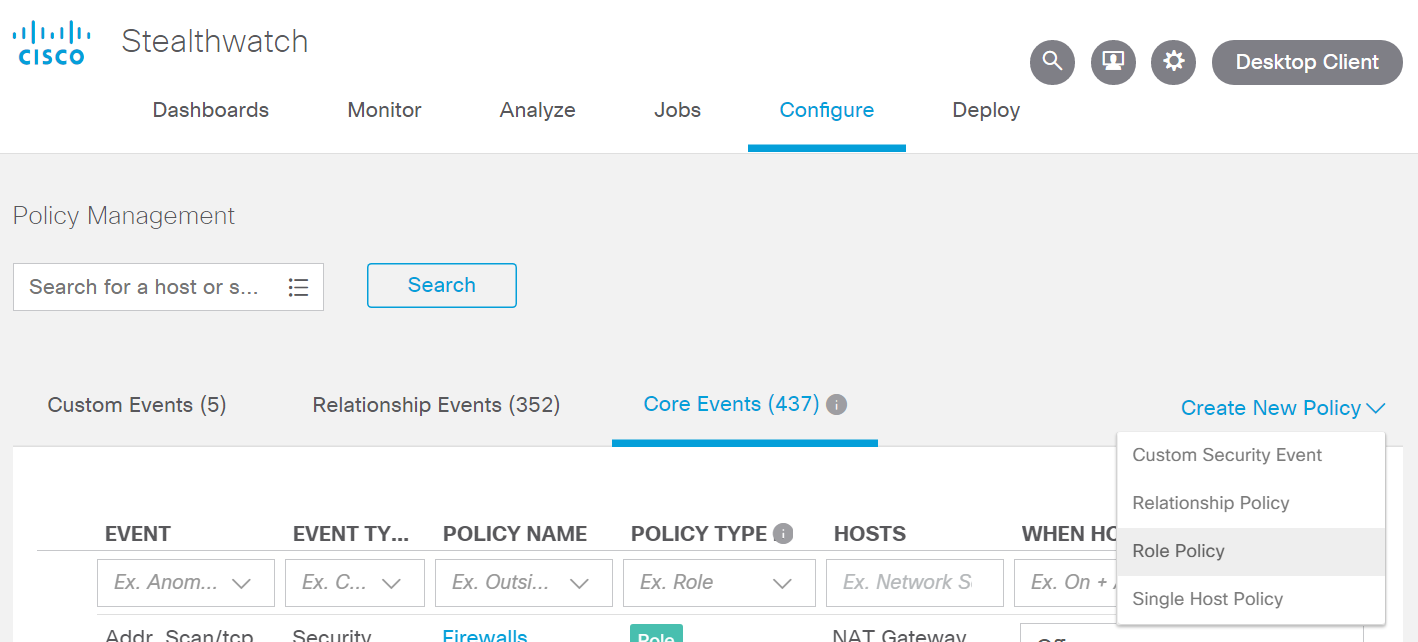
Give the policy a name and description.
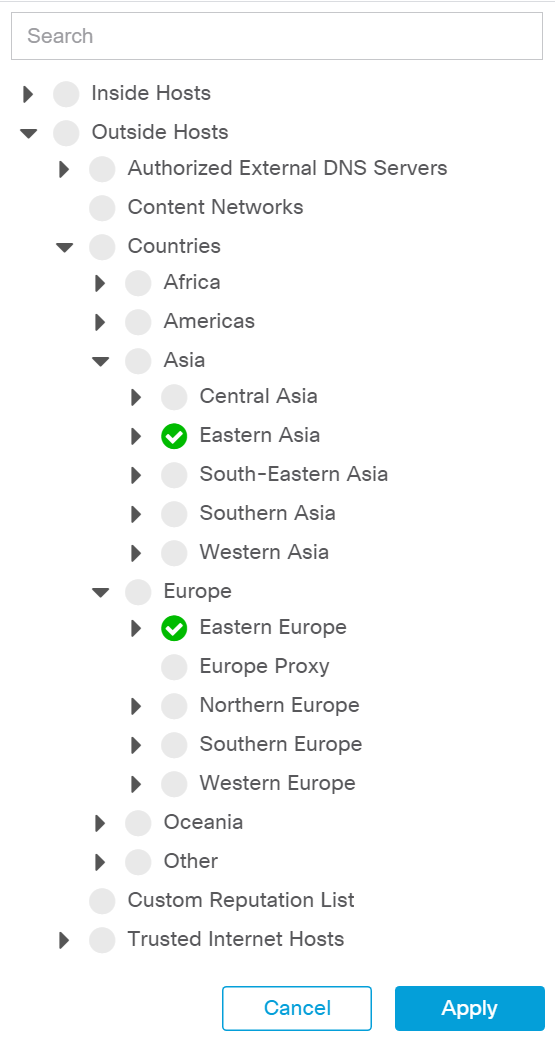
Under Host Groups, click the plus symbol.
Under Outside Hosts, select Eastern Asia and Eastern Europe.
Click Apply.
Under Core Events, click Select Events.
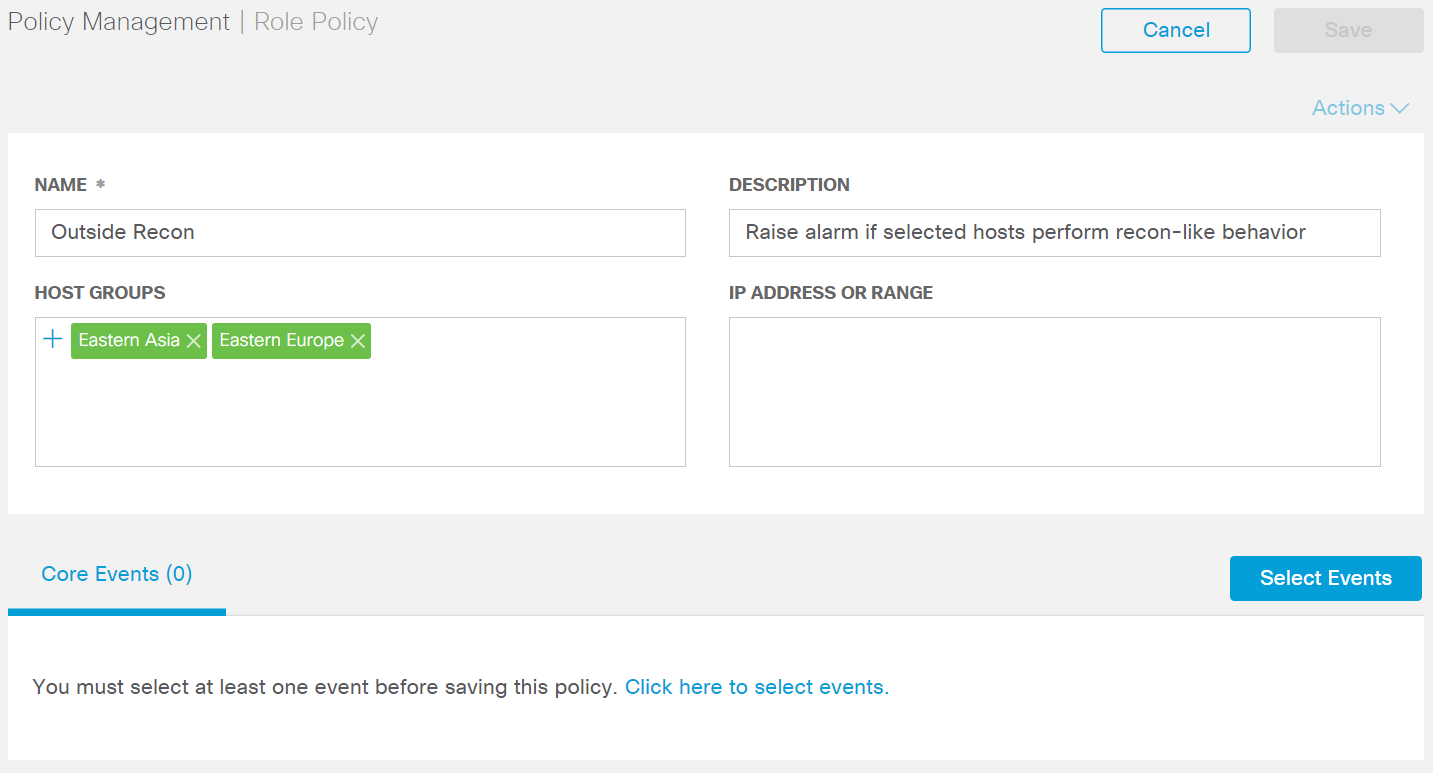
Select Recon.
Click Apply.
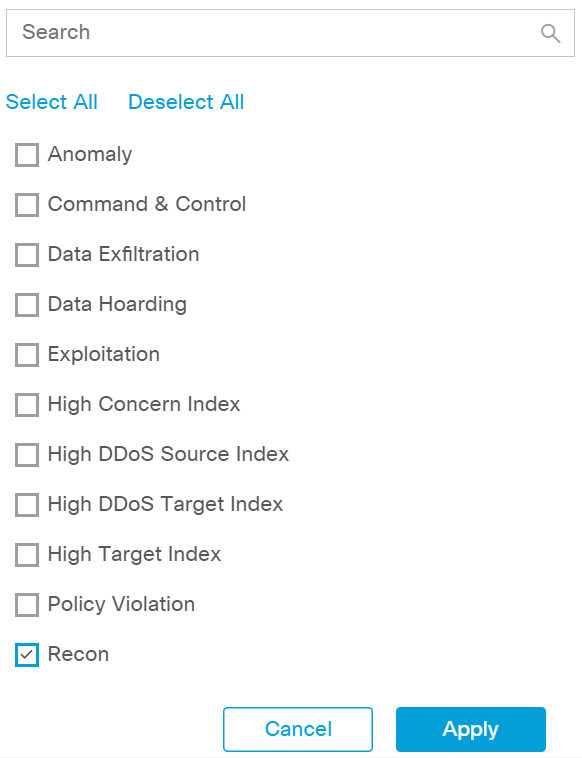
Under Core Events > Recon > When Host is Source, select On + Alarm.
Click the expand arrow next to Recon.
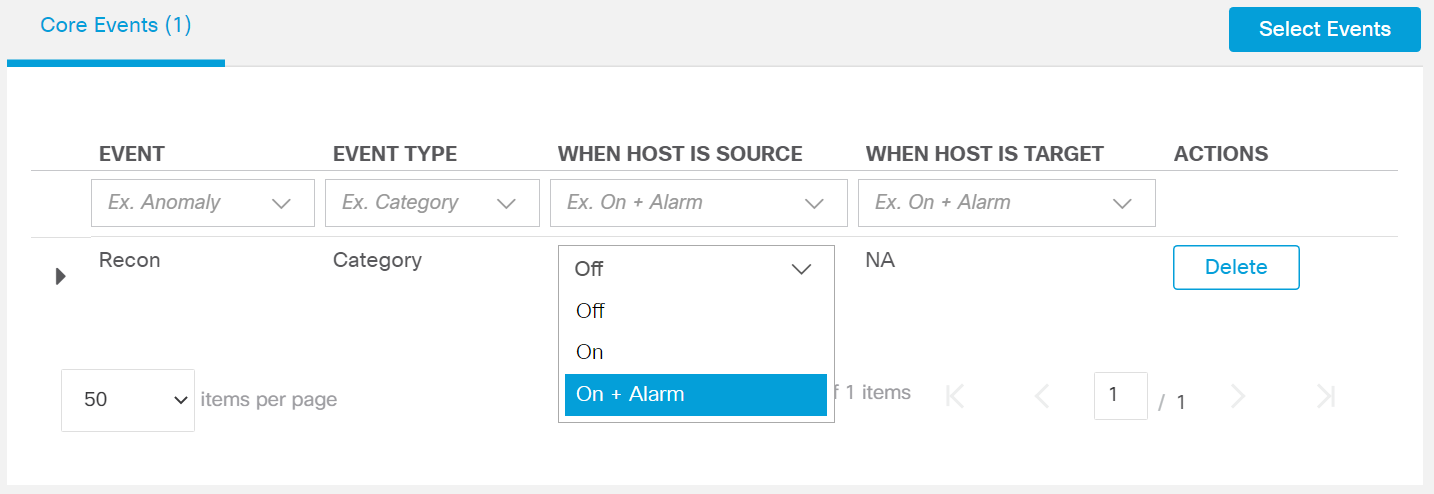
Select Behavioral and Threshold.
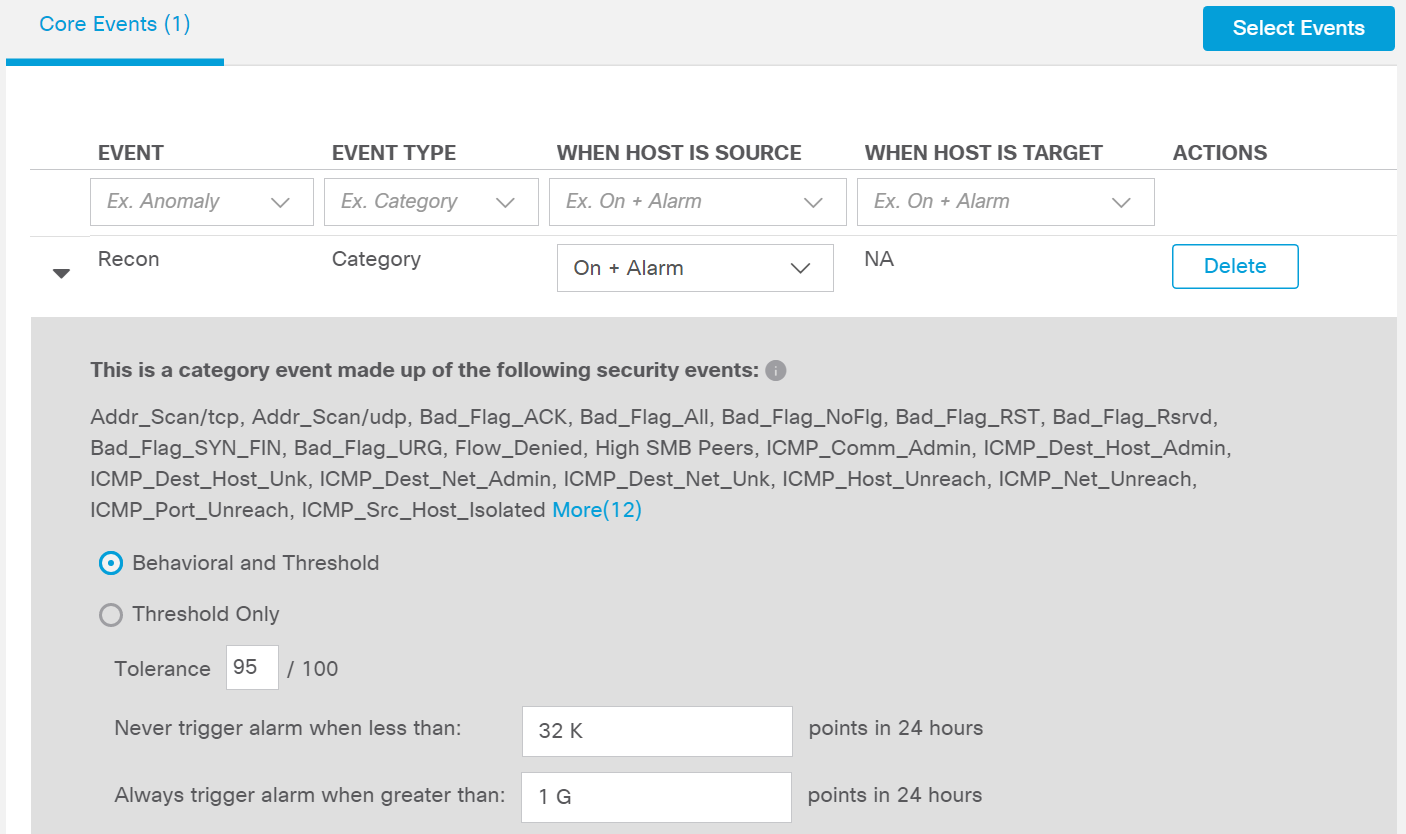
Click Save.
2.2.4.1 Cisco Umbrella
Cisco Umbrella is a cloud service that provides protection through DNS-layer security. Engineers deployed two Umbrella virtual appliances in the HDO to provide DNS routing and protection from malicious web services.
Cisco Umbrella Forwarder Appliance Information
CPU: 1
RAM: 0.5 GB
Storage: 6.5 GB (Thick Provision)
Network Adapter 1: VLAN 1327
Operating System: Linux
Cisco Umbrella Forwarder Appliance Installation Guide
Install the appliance according to the instructions detailed in Cisco’s Deploy VAs in VMware guidance [C9].
Create an Umbrella Site
Click Deployments > Configuration > Sites and Active Directory.
Click Settings.
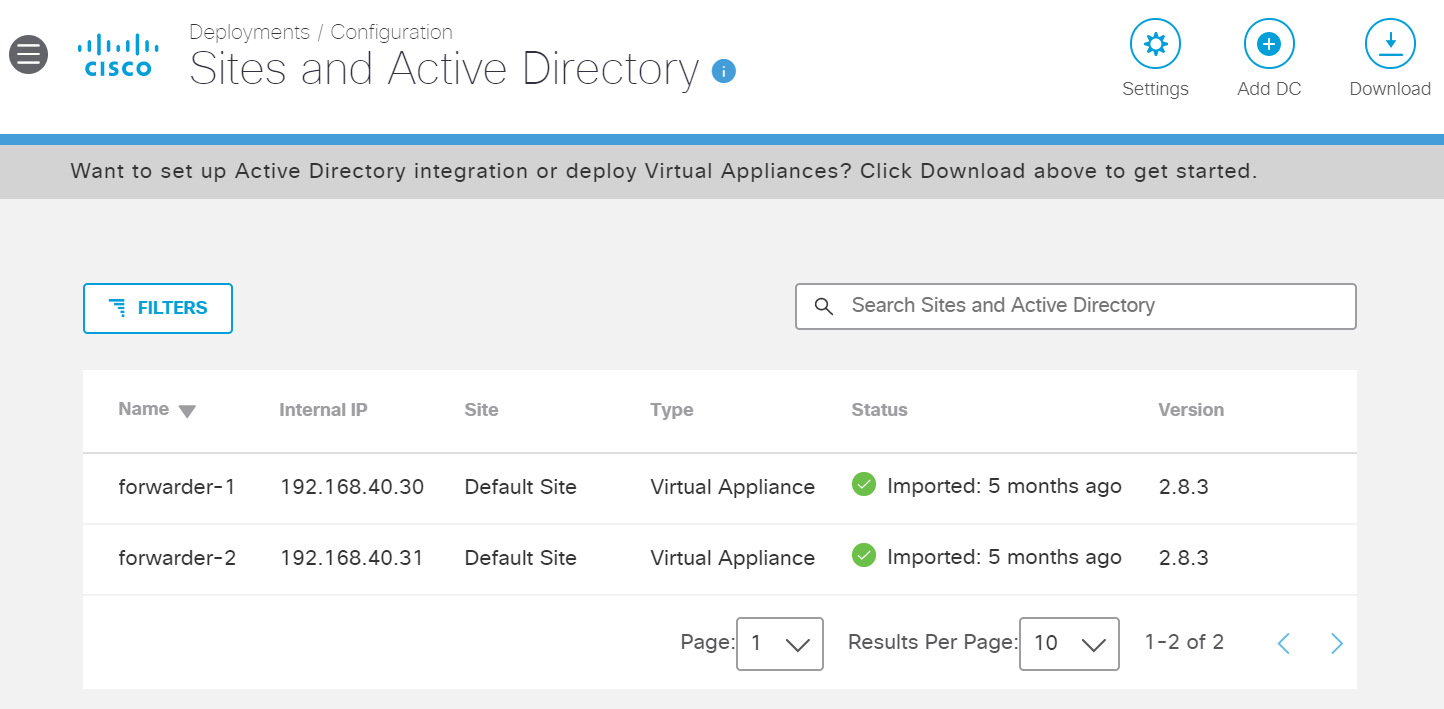
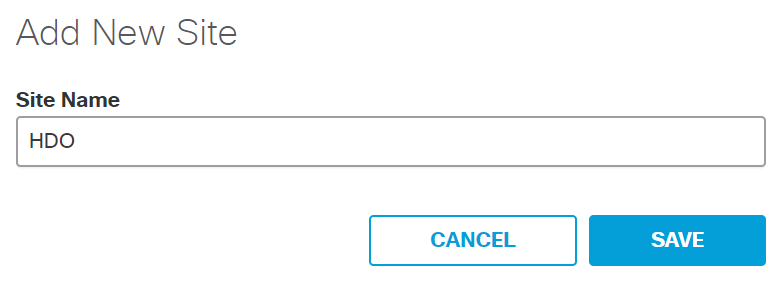
Click Add New Site.
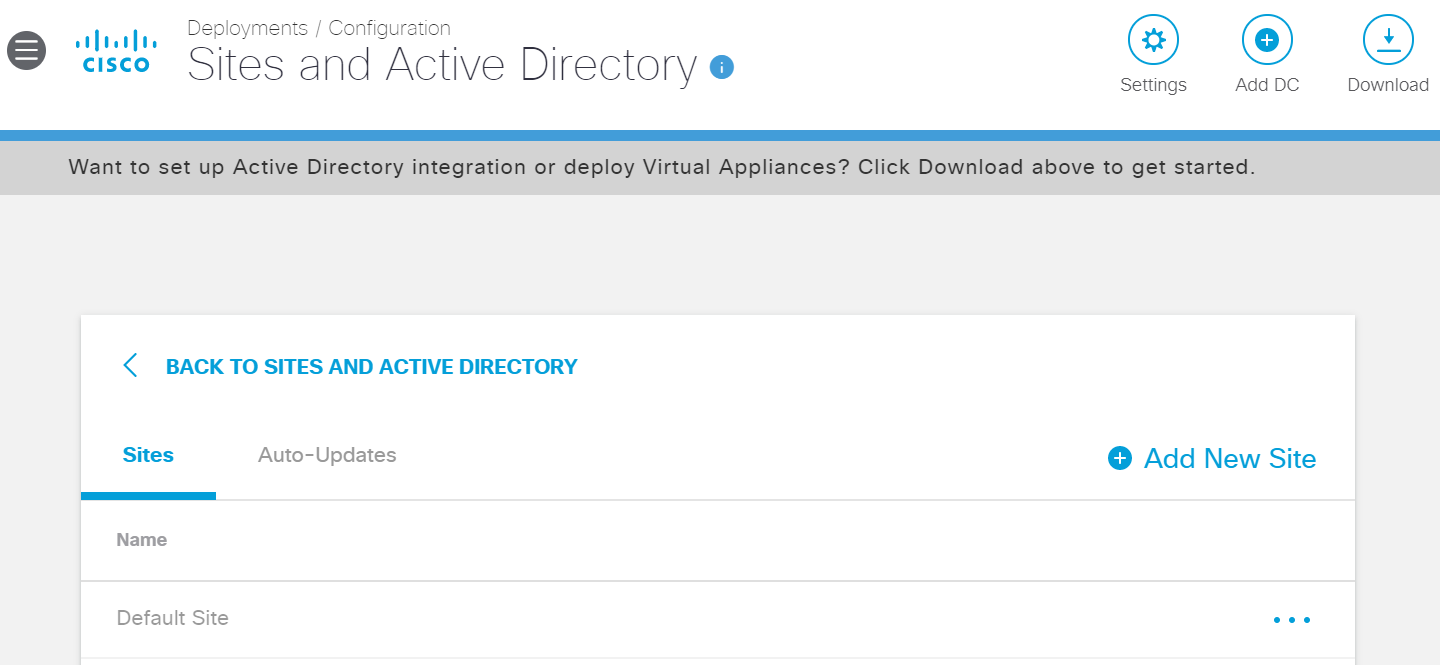
In the Add New Site pop-up window, set Name to HDO.
Click Save.
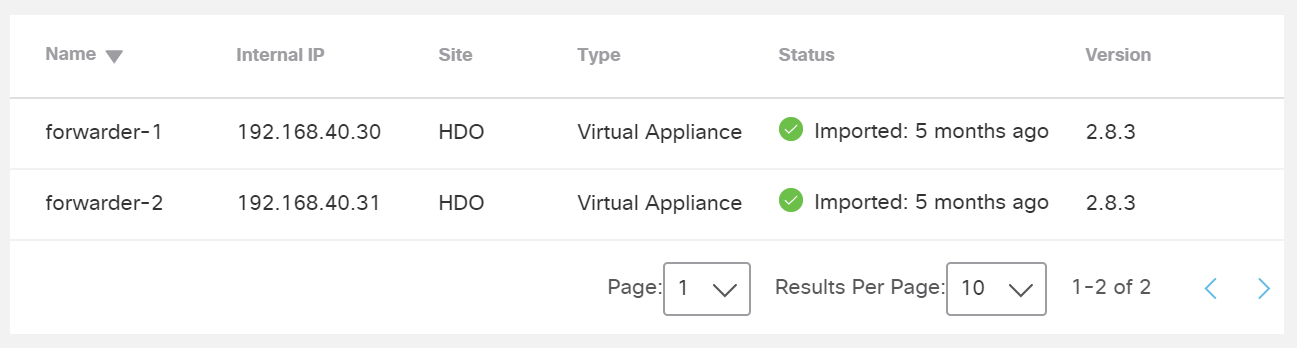
Click Deployments > Configuration > Sites and Active Directory.
Click the edit symbol for the Site of forwarder-1.
Under Site, select HDO.
Click Save.
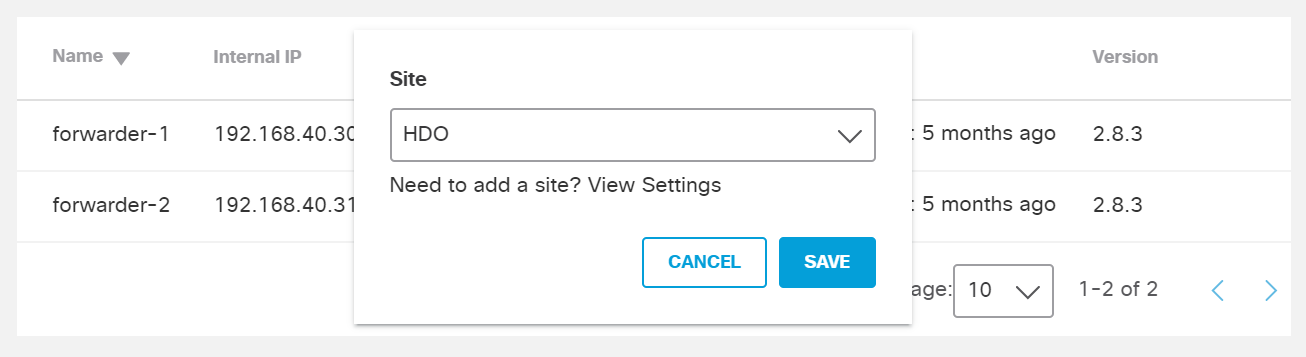
Repeat the previous steps for forwarder-2.
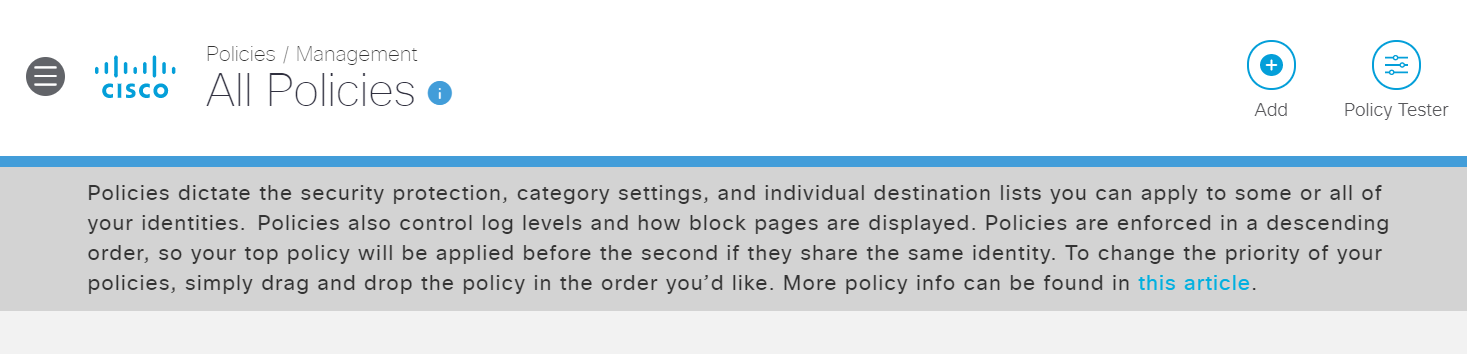
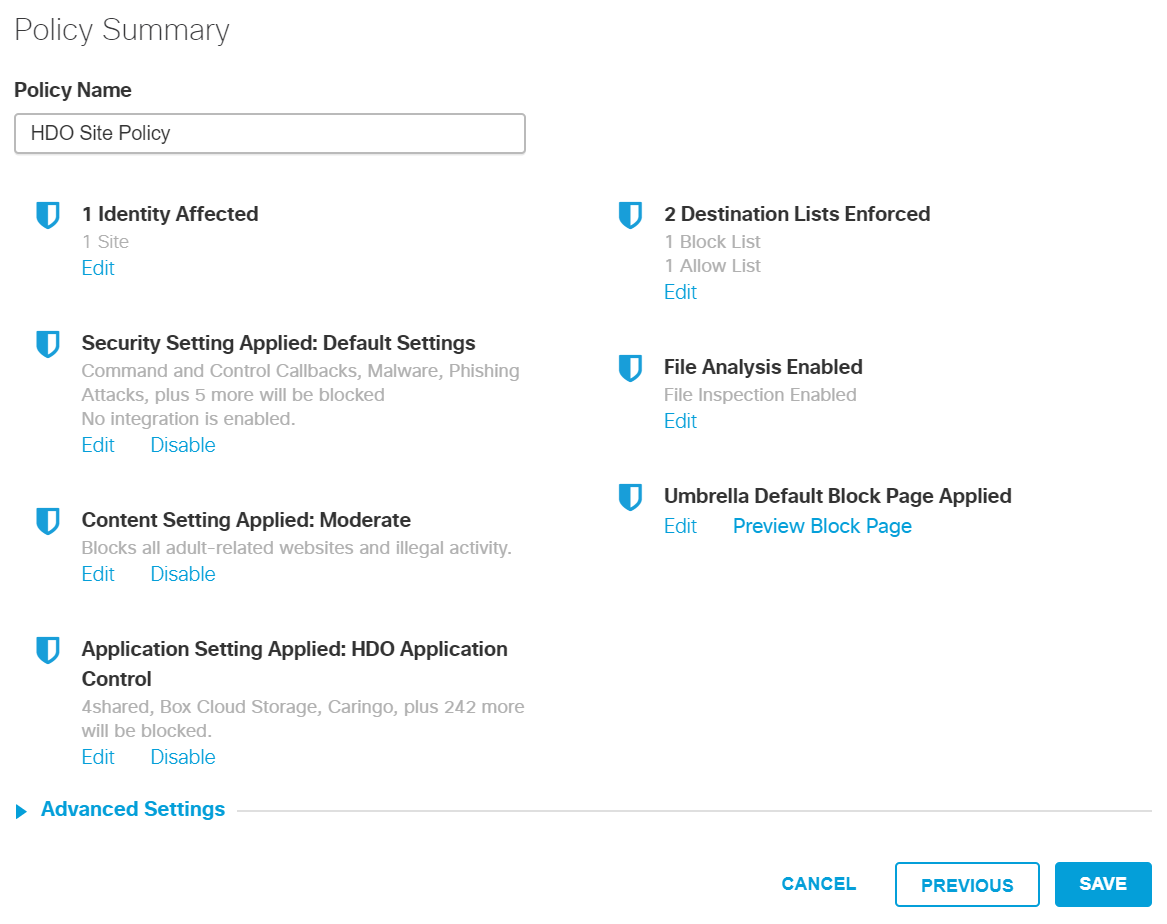
Configure an Umbrella Policy
Click Policies > Management > All Policies.
Click Add.
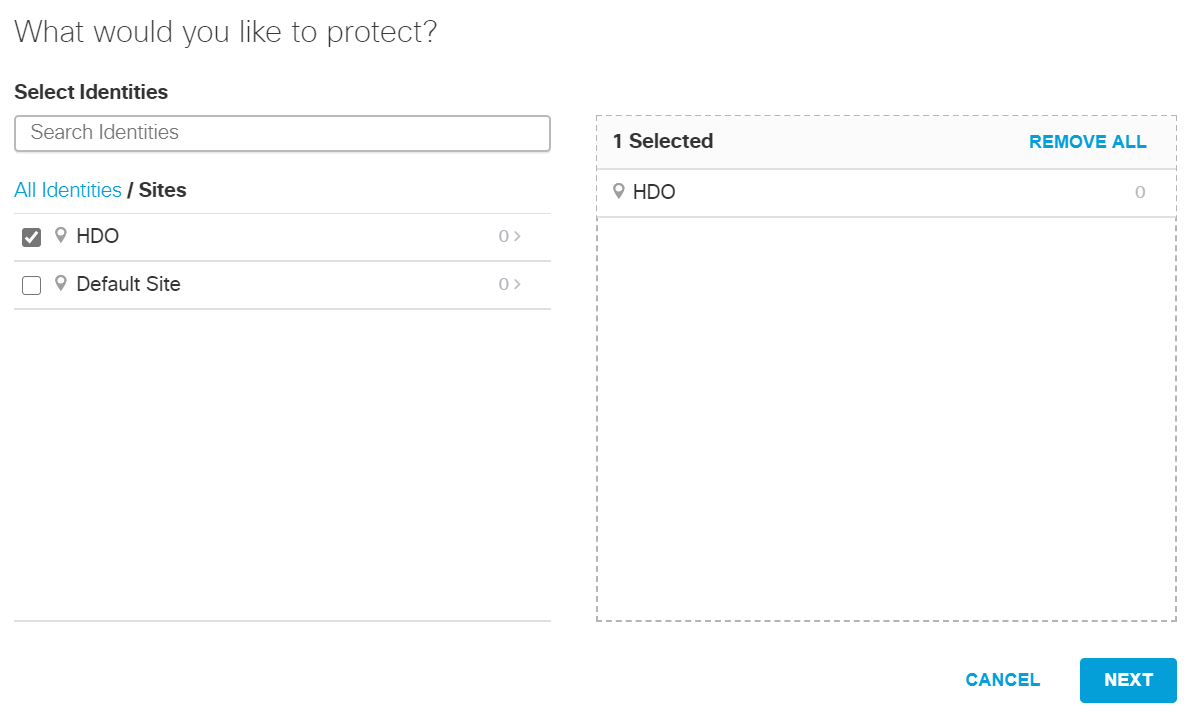
Expand the Sites identity.
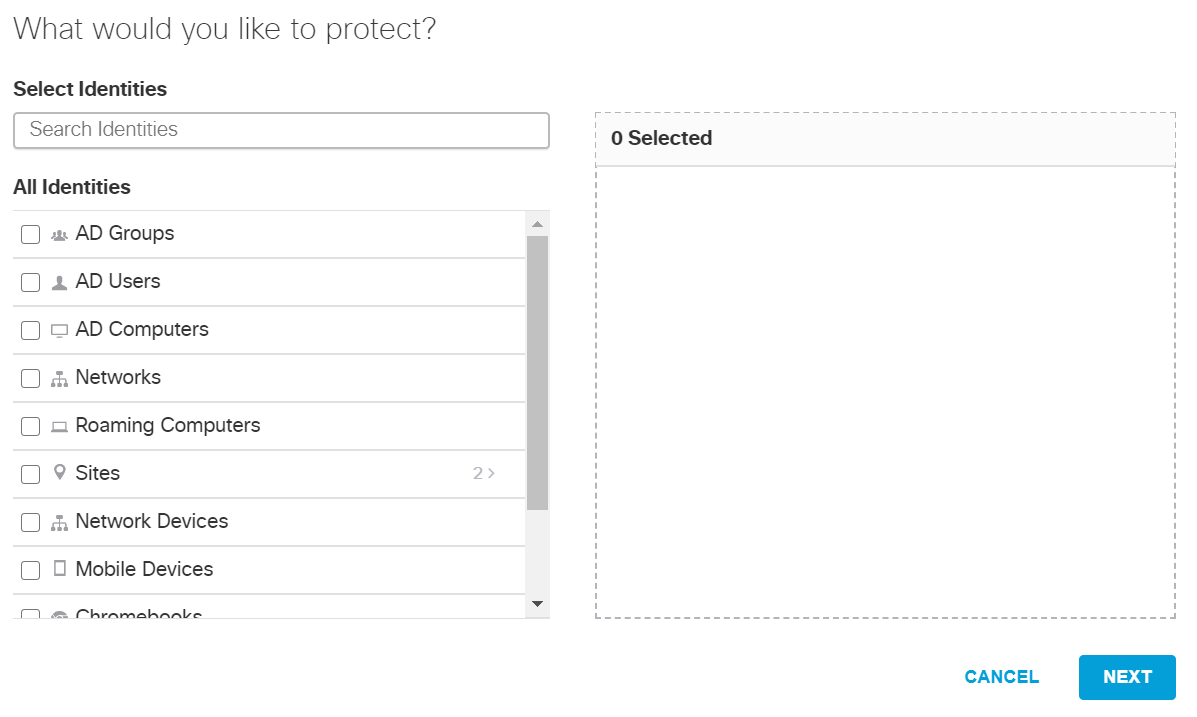
Select HDO.
Click Next.
Click Next.
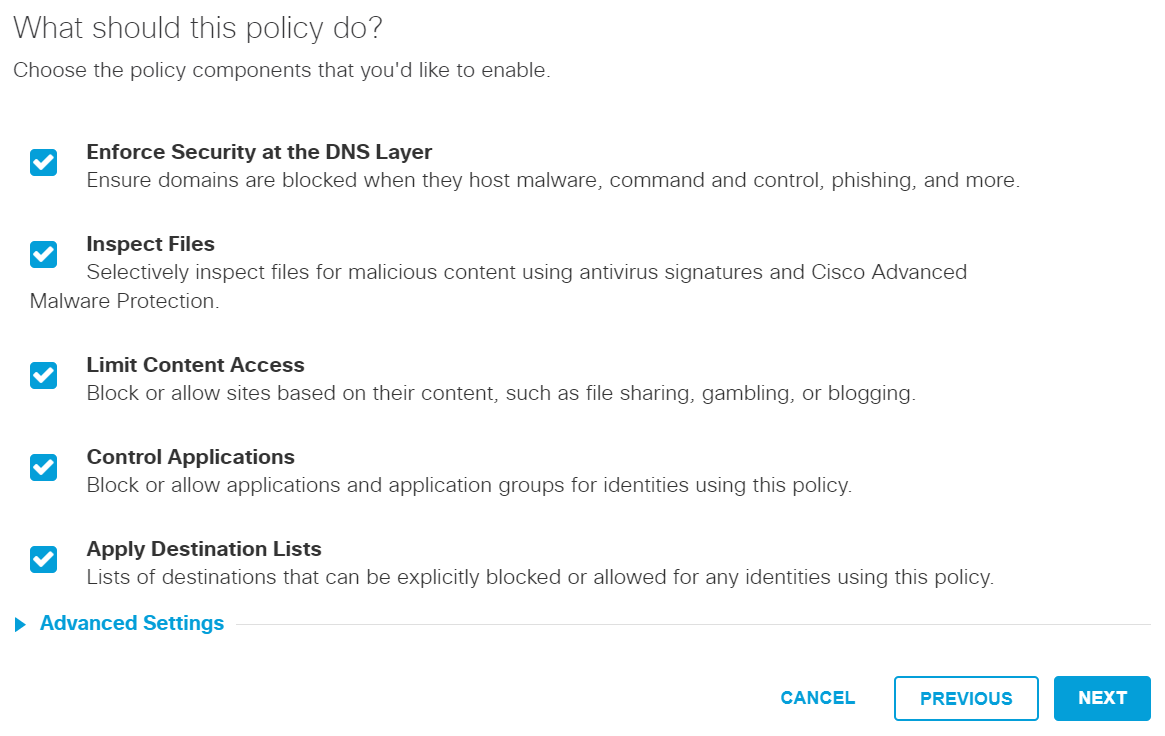
Click Next.
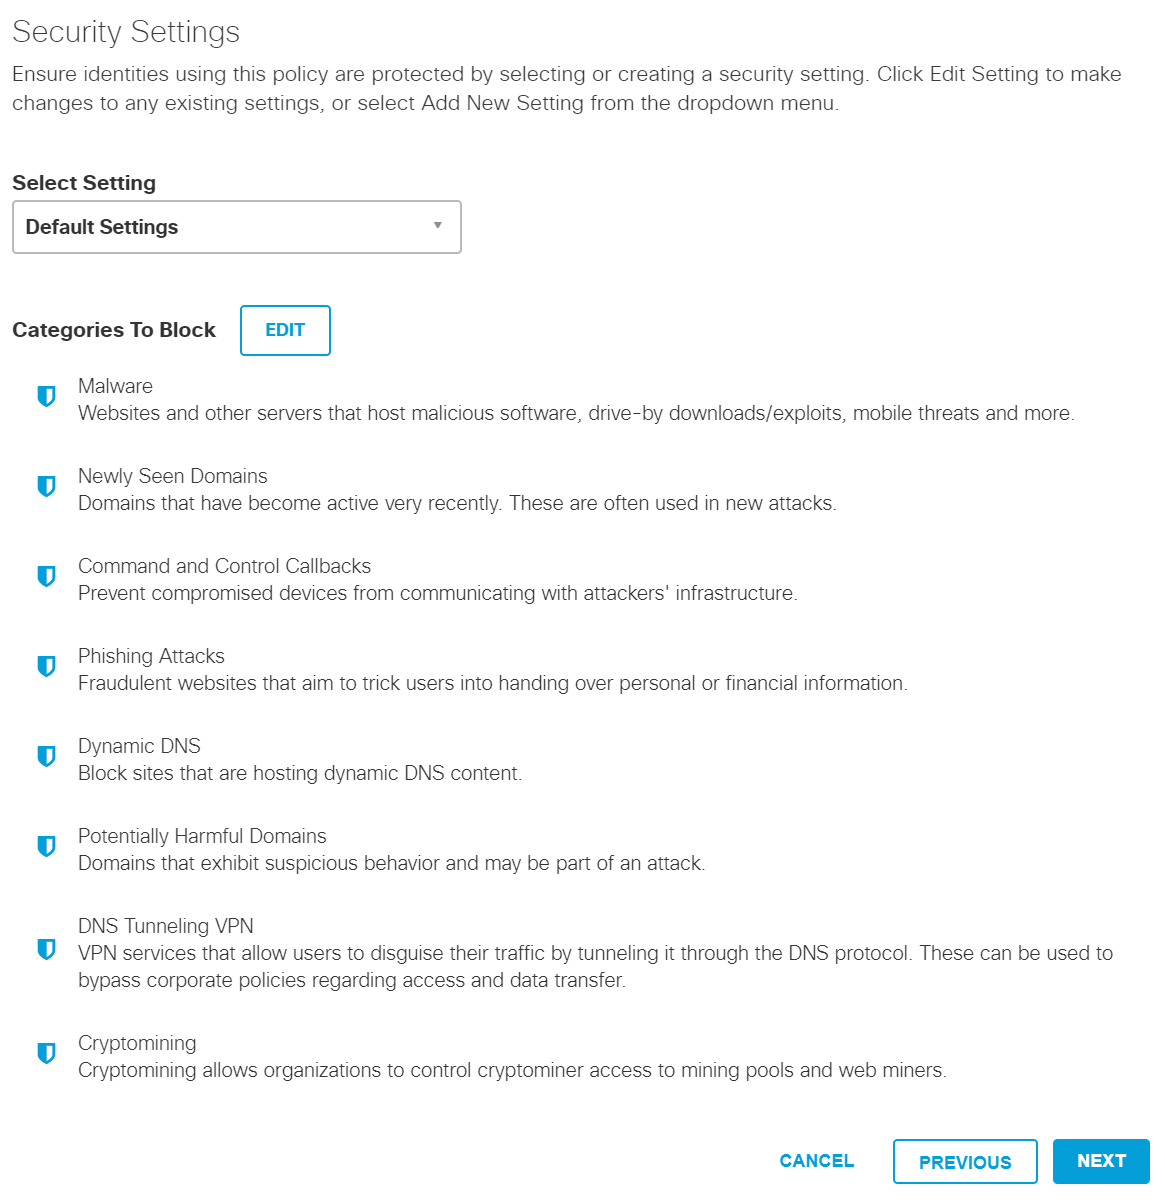
Select Moderate.
Click Next.
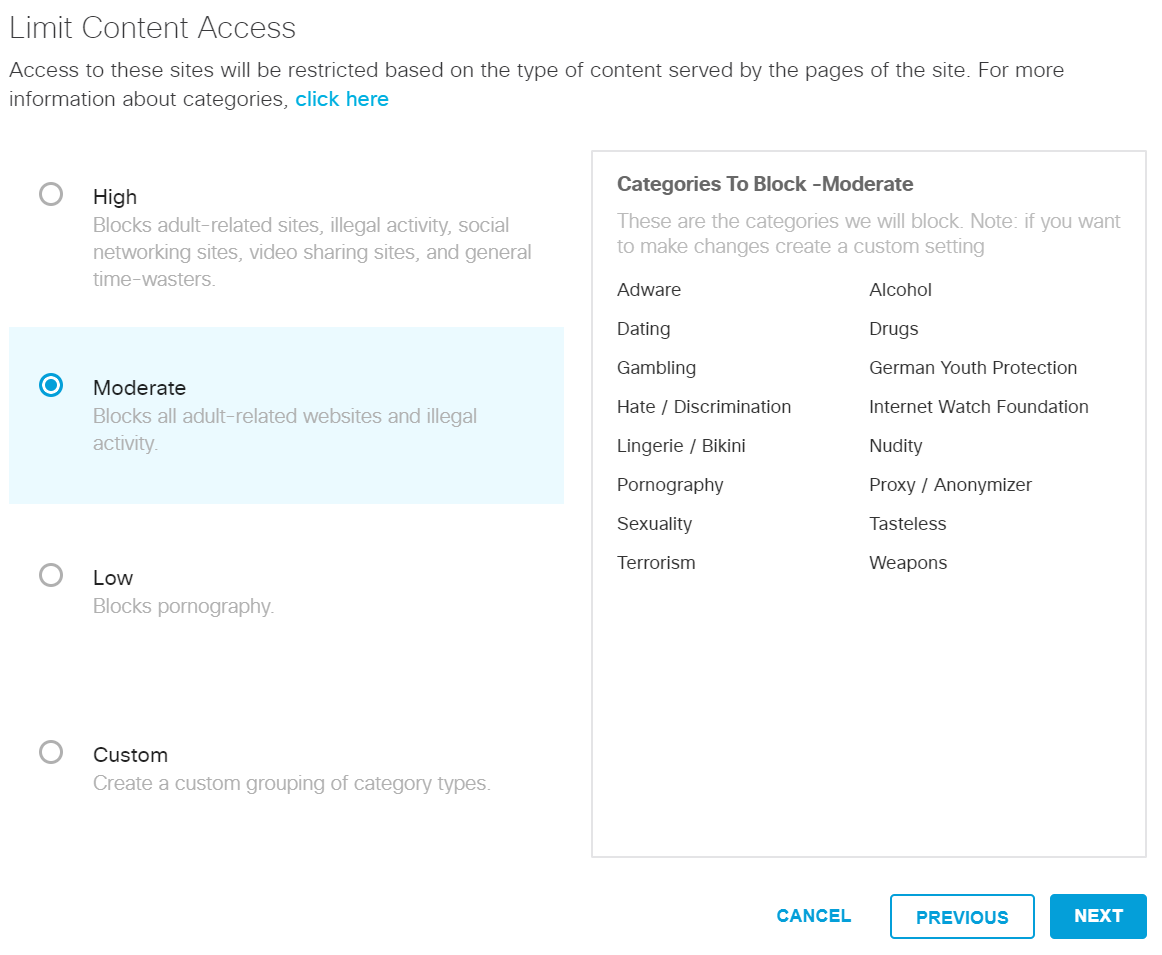
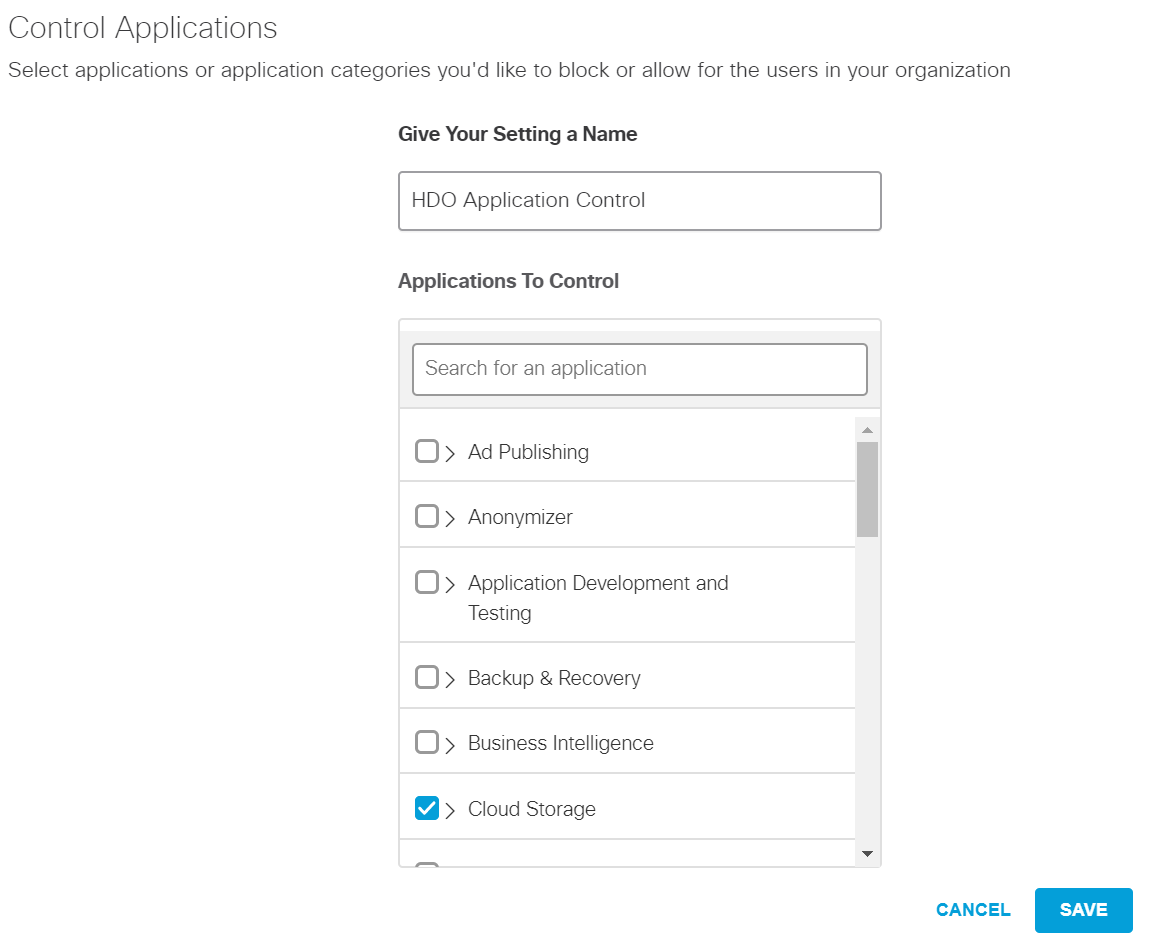
Under Application Settings, use the drop-down menu to select Create New Setting.
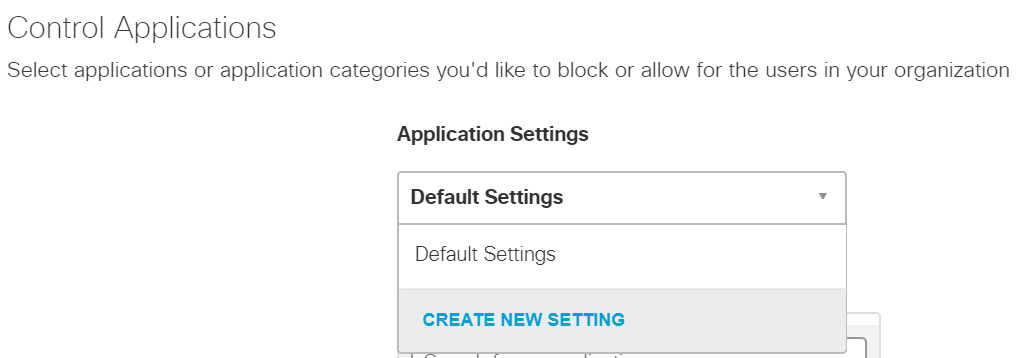
Under the Control Applications screen, fill out the following information:
Name: HDO Application Control
Applications to Control: Cloud Storage
Click Save.
Click Next.

Click Next.
Click Next.
Click Next.
In the Policy Summary screen, set the Name to HDO Site Policy.
Click Save.
Configure Windows Domain Controller as the Local DNS Provider
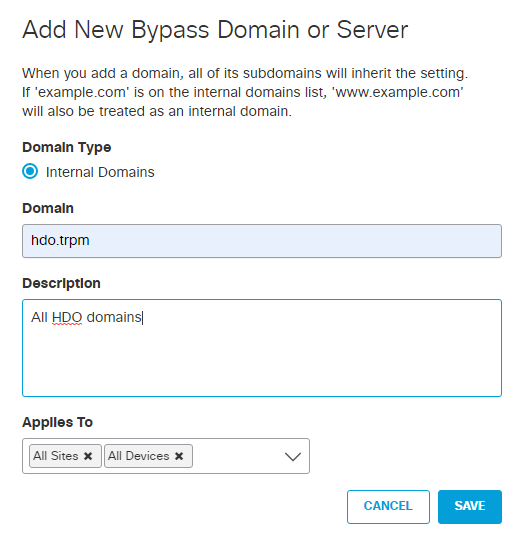
Click Deployments > Configuration > Domain Management.
Click Add.
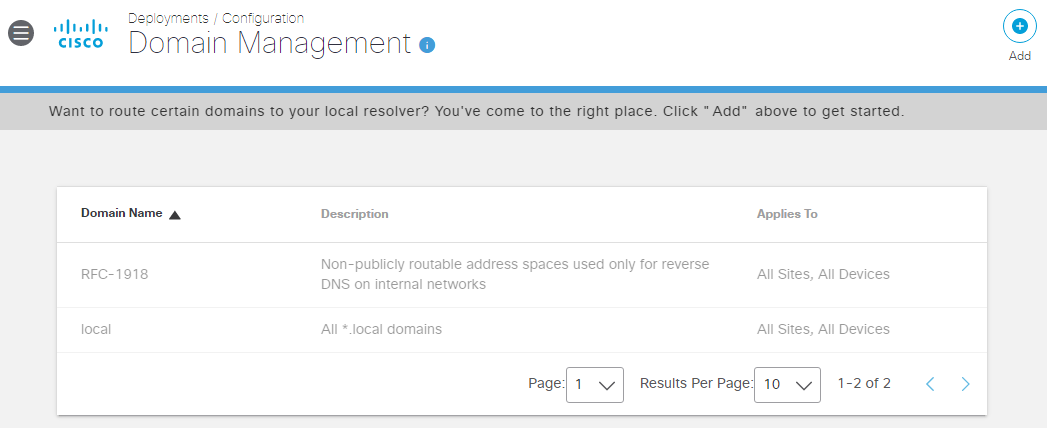
In the Add New Bypass Domain or Server popup window, fill out the following information:
Domain: hdo.trpm
Applies To: All Sites, All Devices
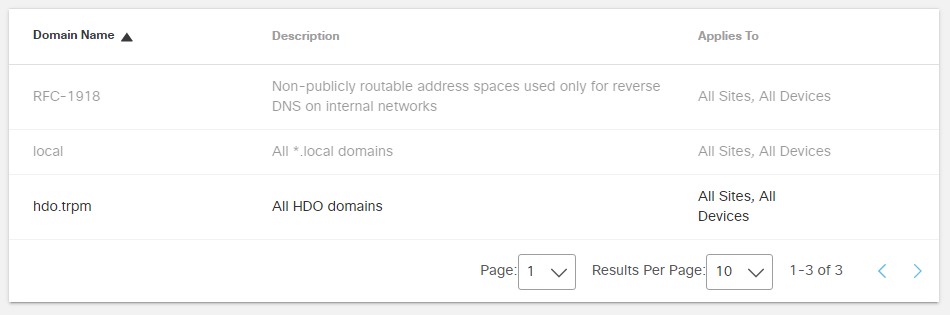
Click Save. Verify that the rule for the hdo.trpm has been added.
2.2.4.2 LogRhythm XDR (Extended Detection and Response)
LogRhythm XDR is a SIEM system that receives log and machine data from multiple end points and evaluates the data to determine when cybersecurity events occur. The project utilizes LogRhythm XDR in the HDO environment to enable a continuous view of business operations and detect cyber threats on assets.
System Requirements
CPU: 20 virtual central processing units (vCPUs)
Memory: 96 GB RAM
Storage:
hard drive C: 220 GB
hard drive D: 1 terabyte (TB)
hard drive L: 150 GB
Operating System: Microsoft Windows Server 2016 X64 Standard Edition
Network Adapter: VLAN 1348
LogRhythm XDR Installation
This section describes LogRhythm installation processes.
Download Installation Packages
Acquire the installation packages from LogRhythm, Inc.
Prepare a virtual Windows Server per the system requirements.
Create three new drives.
Create a new folder from C:\ on the Platform Manager server and name the folder LogRhythm.
Extract the provided Database Installer tool and LogRhythm XDR Wizard from the installation package in C:LogRhythm.
Install Database
Open LogRhythmDatabaseInstallTool folder.
Double-click LogRhythmDatabaseInstallTool application file.
Click Run.
A LogRhythm Database Setup window will appear. Set the Which setup is this for? to PM and use the default values for Disk Usage.
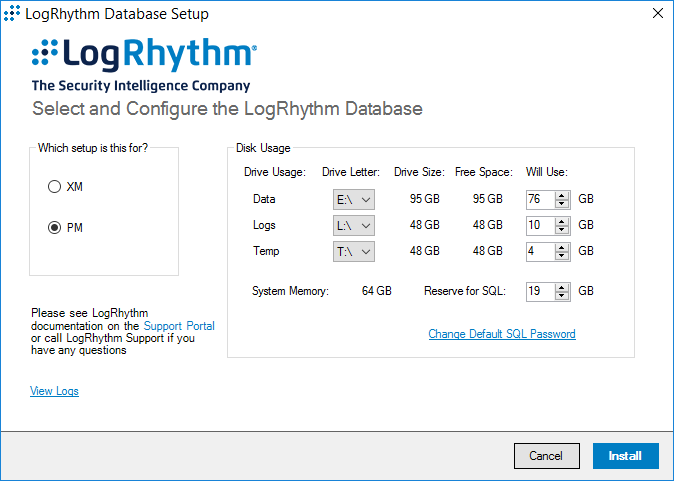
The remaining fields will automatically populate with the appropriate values. Click Install.
Click Done to close the LogRhythm Database Setup window.
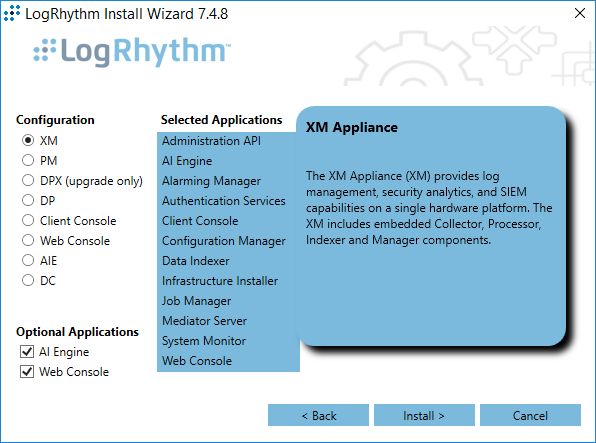
Install LogRhythm XDR
Navigate to C:\ and open LogRhythm XDR Wizard folder.
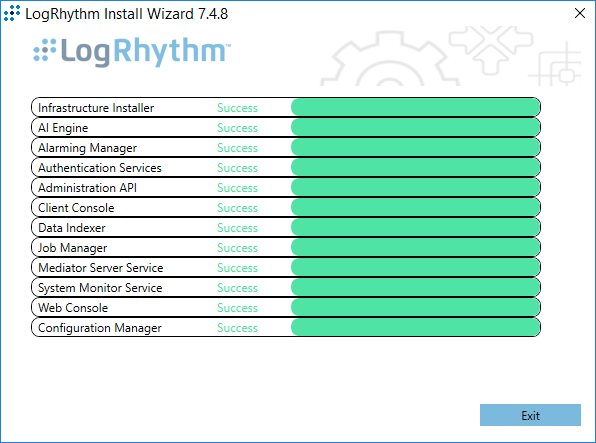
Double-click the LogRhythmInstallerWizard application file.
The LogRhythm Install Wizard 7.4.8 window will appear.
Click Next.
A LogRhythm Install Wizard Confirmation window will appear.
Click Yes to continue.
Check the box beside I accept the terms in the license agreement to accept the License Agreement.
Click Next.
In the Selected Applications window, select the following attributes:
Configuration: Select the XM radio button.
Optional Applications: Check both AI Engine and Web Console boxes.
Click Install.
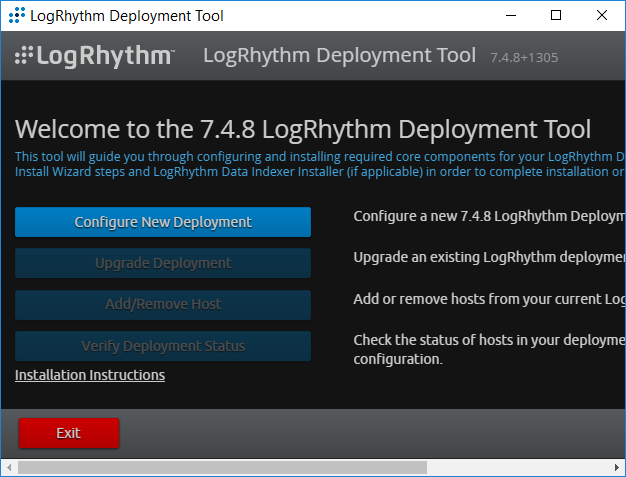
A LogRhythm Deployment Tool window displays.
Click Configure New Deployment.
In the Deployment Properties window, keep the default configurations and click Ok.
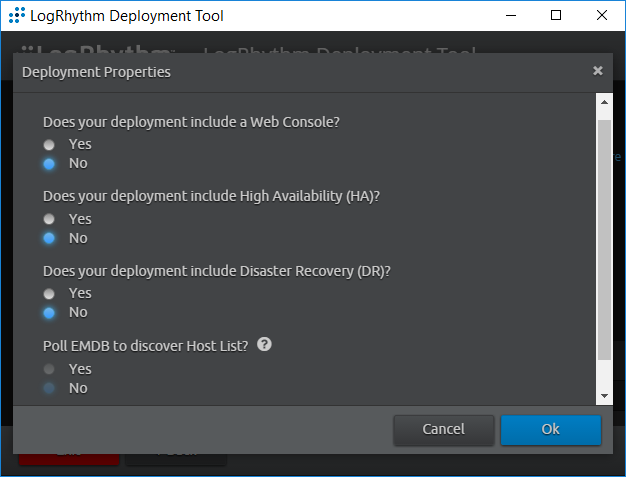
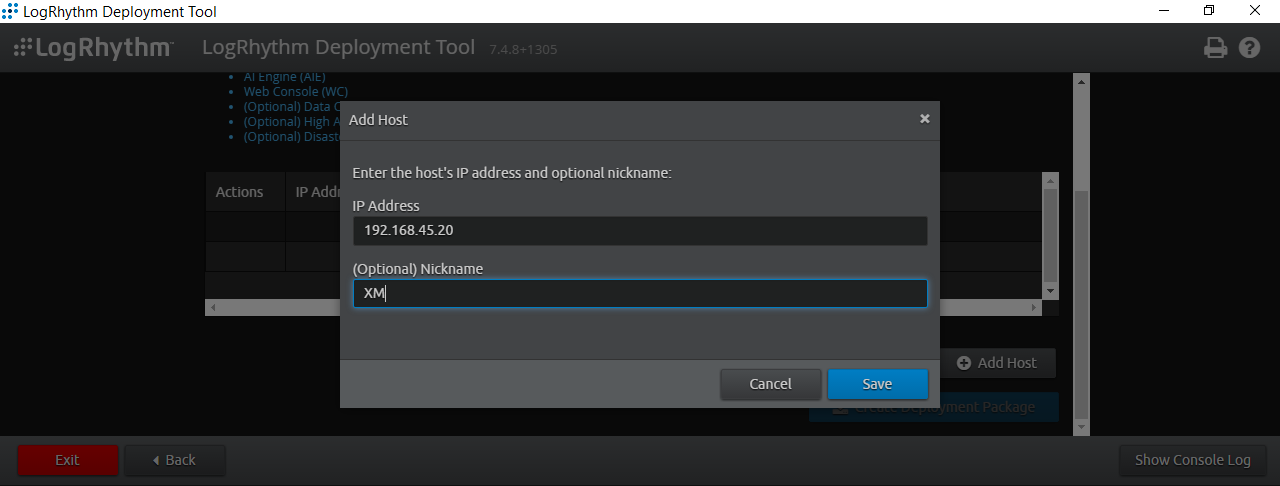
Click +Add Host IP in the bottom right corner of the screen and provide the following information:
IP Address: 192.168.45.20
Nickname: XM
Click Save.
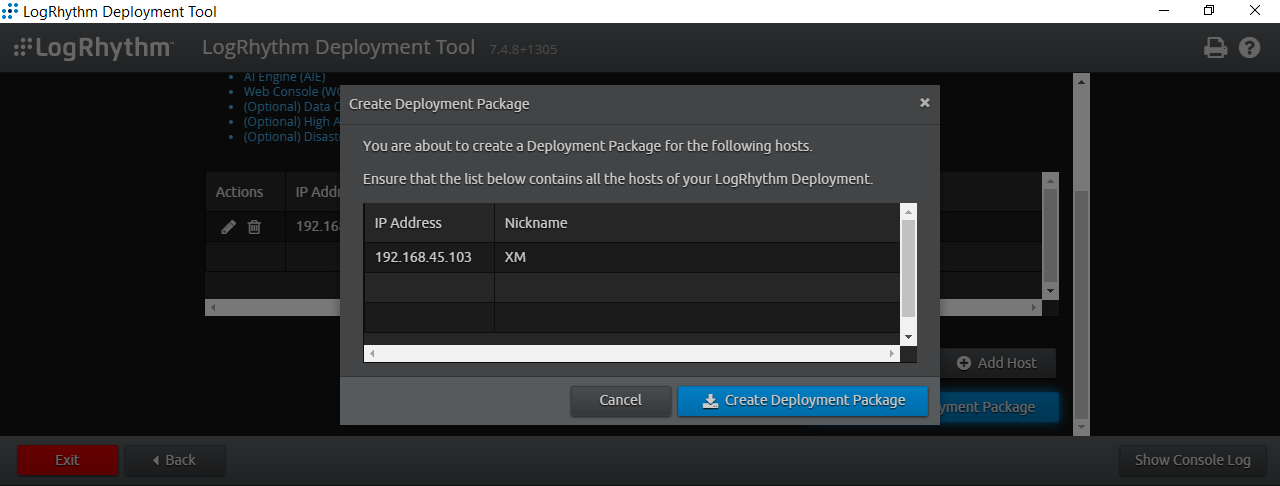
Click Create Deployment Package in the bottom right corner of the screen.
A Create Deployment Package window displays.
Click Create Deployment Package.
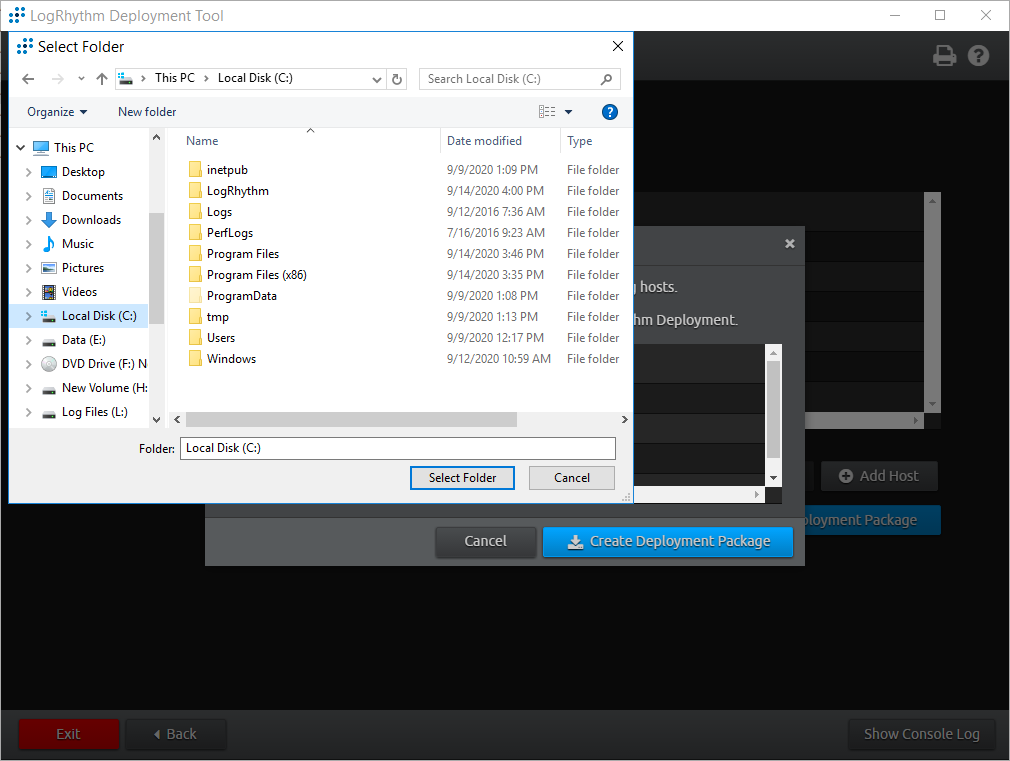
A Select Folder window appears.
Navigate to C:\LogRhythm.
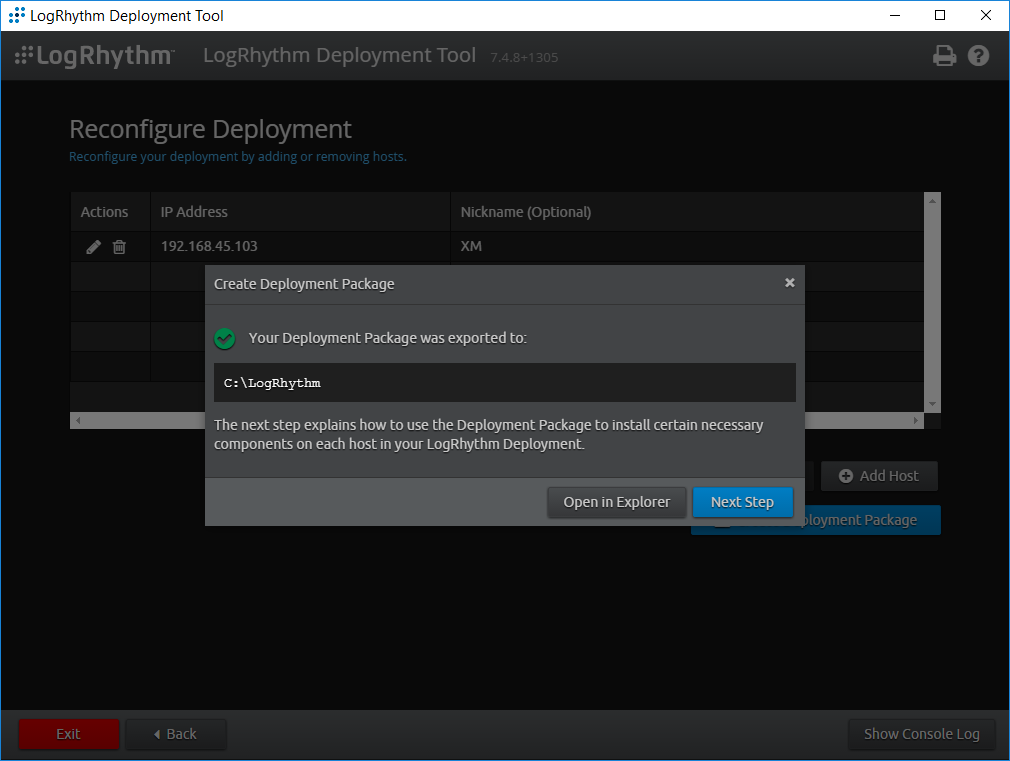
Click Select Folder.
Click Next Step.
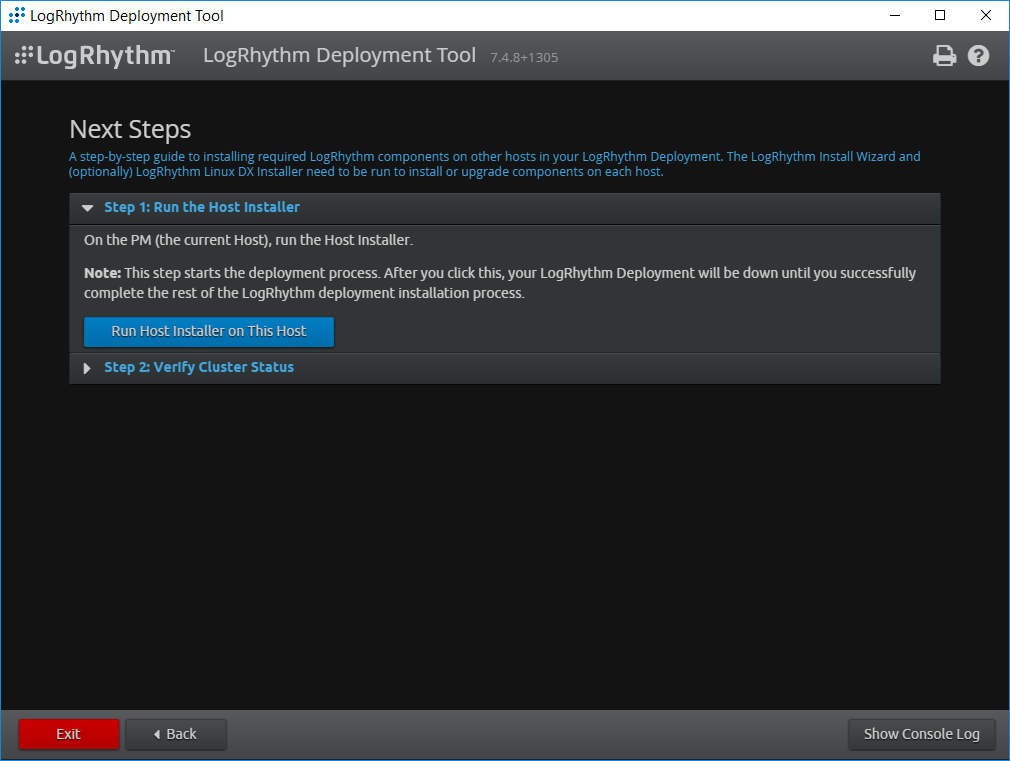
Click Run Host Installer on this Host.
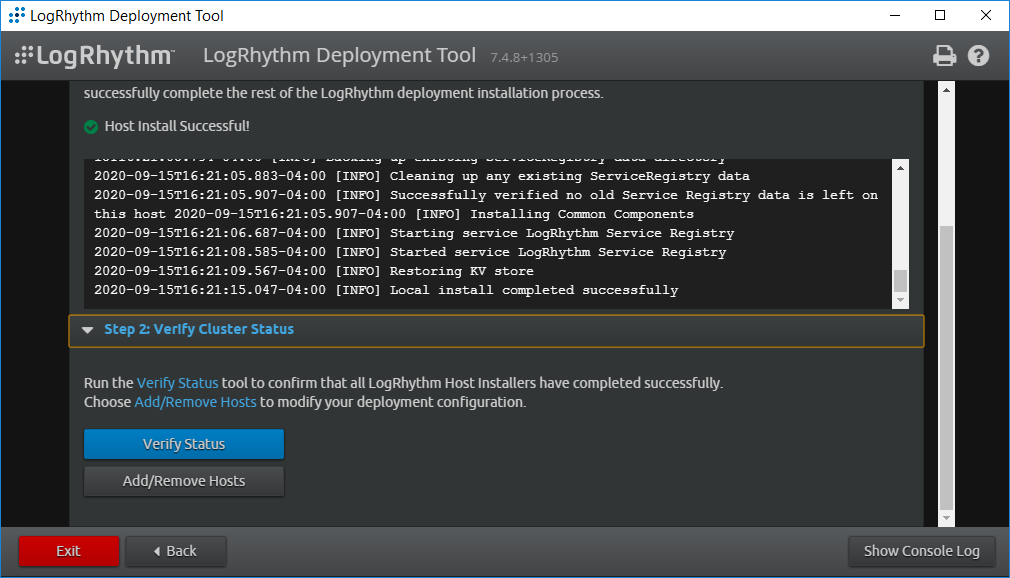
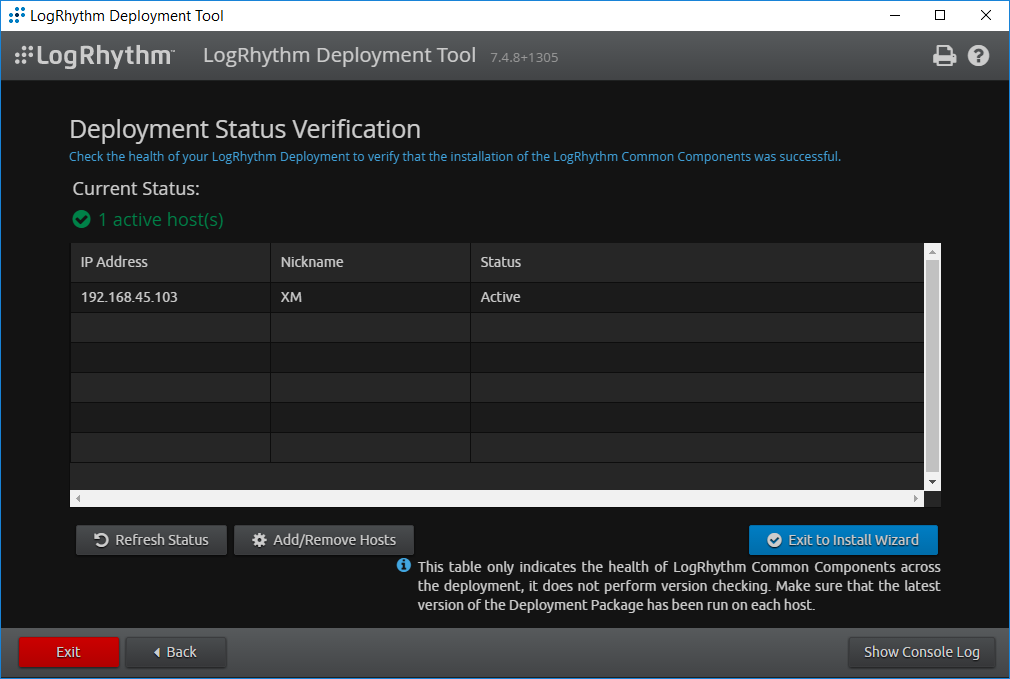
After the Host Installer has finished, click Verify Status.
Click Exit to Install Wizard.
A notification window displays stating the installation could take as long as 30 minutes. Click OK.
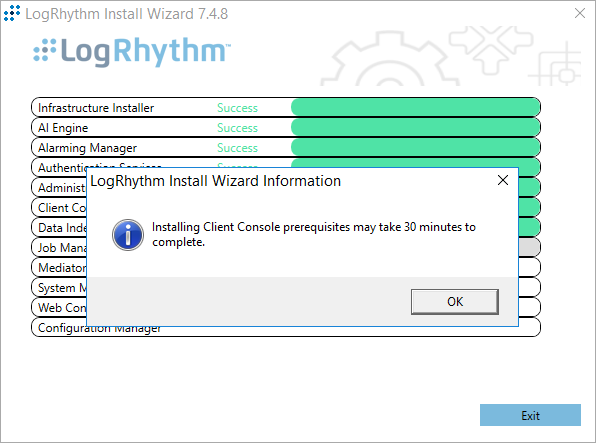
After the Install Wizard has successfully installed the services, click Exit.
LogRhythm XDR Configuration
The LogRhythm XDR configuration includes multiple related components:
System Monitor
LogRhythm Artificial Intelligence (AI) Engine
Mediator Server
Job Manager
LogRhythm Console
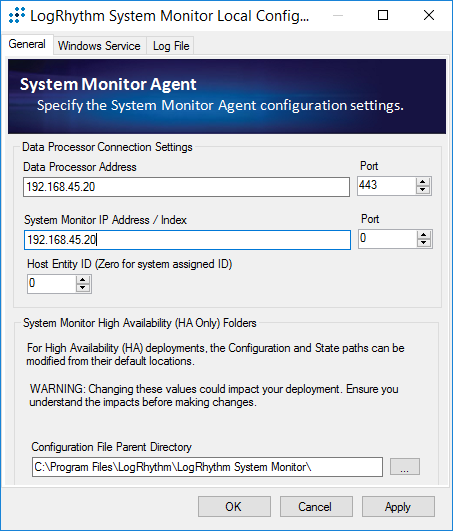
Configure System Monitor
Open File Explorer and navigate to C:Program FilesLogRhythm.
Navigate to LogRhythm System Monitor.
Double-click the lrconfig application file.
In the LogRhythm System Monitor Local Configuration Manager window, provide the following information and leave the remaining fields as their default values:
Data Processor Address: 192.168.45.20
System Monitor IP Address/Index: 192.168.45.20
Click Apply and then click OK.
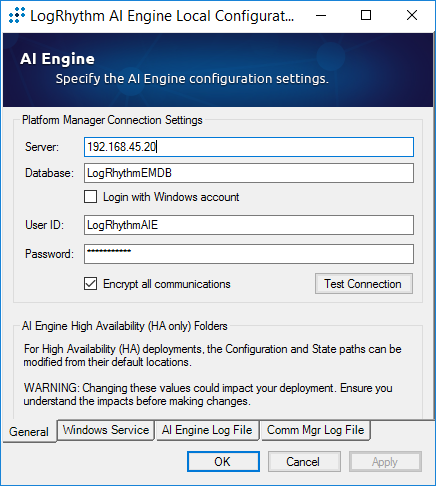
Configure LogRhythm AI Engine
Open File Explorer and navigate to C:Program FilesLogRhythm.
Navigate to LogRhythm AI Engine.
Double-click the lrconfig application file.
In the LogRhythm AI Engine Local Configuration Manager window, provide the following information and leave the remaining fields as their default values:
Server: 192.168.45.20
Password: **********
Click Test Connection, then follow the instruction of the alert window to complete the test connection.
Click Apply and then click OK.
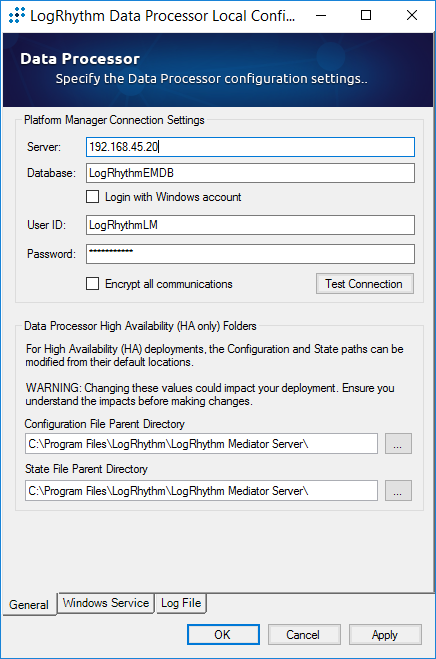
Configure Mediator Server
Open File Explorer and navigate to C:Program FilesLogRhythm.
Navigate to Mediator Server.
Double-click lrconfig application file.
In the LogRhythm Data Processor Local Configuration Manager window, provide the following information and leave the remaining fields as their default values:
Server: 192.168.45.20
Password: **********
Click Test Connection, then follow the instruction of the alert window to complete the test connection.
Click Apply and then click OK.
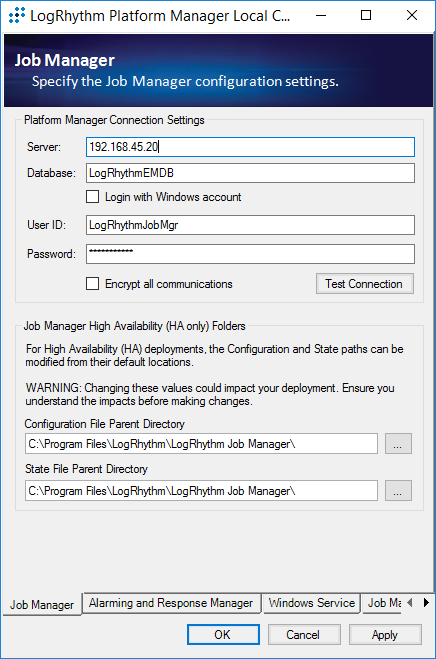
Configure Job Manager
Open File Explorer and navigate to C:Program FilesLogRhythm.
Navigate to Job Manager.
Double-click the lrconfig application file.
In the LogRhythm Platform Manager Local Configuration Manager window, provide the following information and leave the remaining fields as their default values:
Server: 192.168.45.20
Password: **********
Click Test Connection, then follow the instruction of the alert window to complete the test connection.
Click Apply and then click OK.
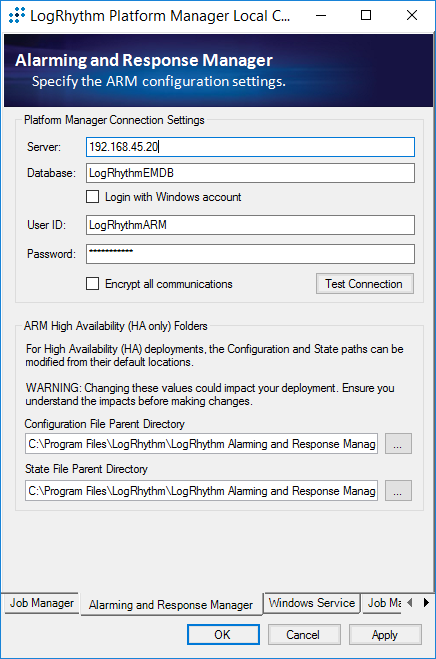
Navigate to the Alarming and Response Manager tab in the bottom menu ribbon.
In the Alarming and Response Manager window, provide the following information and leave the remaining fields as their default values:
Server: 192.168.45.20
Password: **********
Click Test Connection, then follow the instruction of the alert window to complete the test connection.
Click Apply and then click OK.
Configure LogRhythm Console
Open File Explorer and navigate to C:Program FilesLogRhythm.
Navigate to LogRhythm Console.
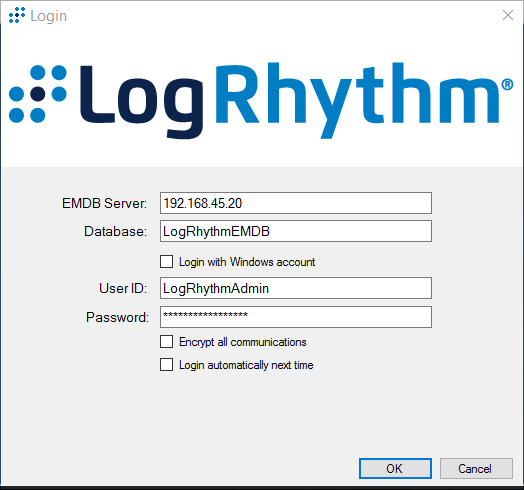
Double-click lrconfig application file.
In the LogRhythm Login window, provide the following information:
EMDB Server: 192.168.45.20
UserID: LogRhythmAdmin
Password: ********
Click OK.
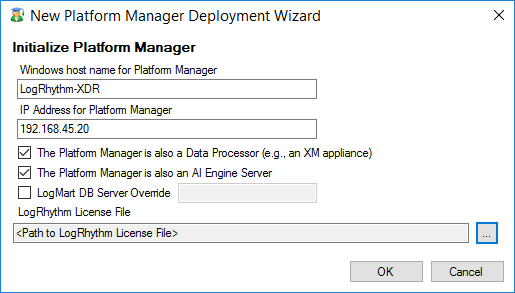
A New Platform Manager Deployment Wizard window displays. Provide the following information:
Windows host name for Platform Manager: LogRhythm-XDR
IP Address for Platform Manager: 192.168.45.20
Check the box next to The Platform Manager is also a Data Processor (e.g., an XM appliance).
Check the box next to The Platform Manager is also an AI Engine Server.
Click the ellipsis button next to <Path to LogRhythm License File> and navigate to the location of the LogRhythm License File.
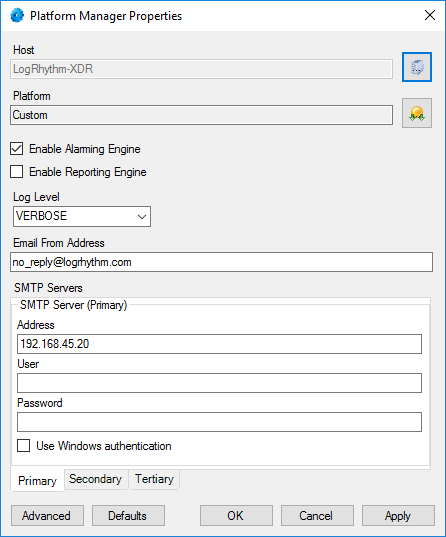
The New Knowledge Base Deployment Wizard window displays and shows the import progress status. Once LogRhythm has successfully imported the file, a message window will appear stating more configurations need to be made for optimum performance. Click OK to open the Platform Manager Properties window.
In the Platform Manager Properties window, provide the following information:
Email address: no_reply@logrhythm.com
Address: 192.168.45.20
Click the button next to Platform, enable the Custom Platform radio button and complete the process by clicking Apply, followed by clicking OK.
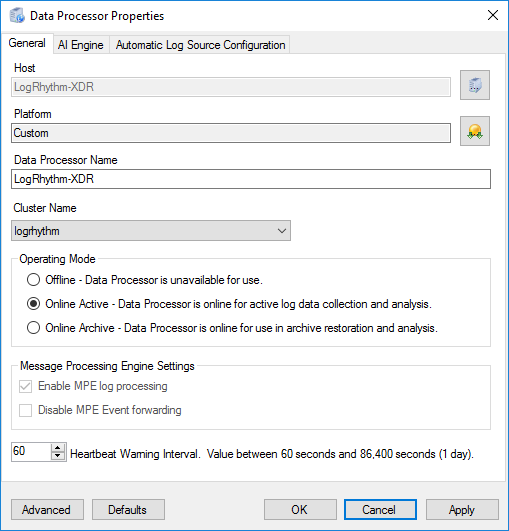
After the Platform Manager Properties window closes, a message window displays for configuring the Data Processor. Click OK to open the Data Processor Properties window.
Click the button next to Platform and enable the Custom Platform radio button.
Click OK.
Leave the remaining fields in the Data Processor Properties window as their default values and click Apply.
Click OK to close the window.
Set LogRhythm-XDR for System Monitor
Back in the LogRhythm console, navigate to the Deployment Manager tab in the menu ribbon.
Navigate to System Monitors on the Deployment Manager menu ribbon.
Double-click LogRhythm-XDR.
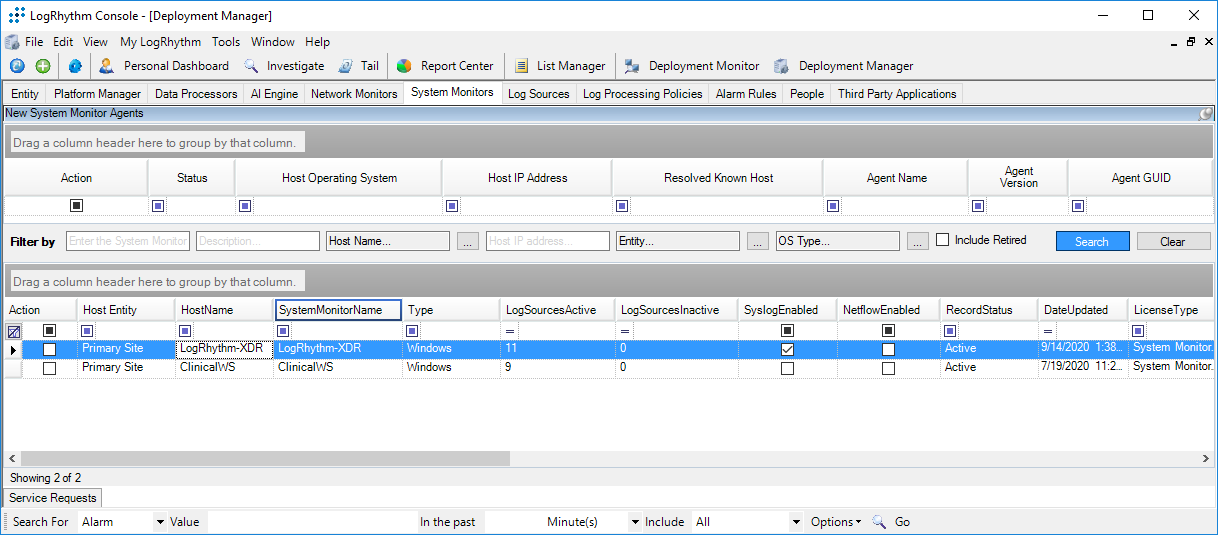
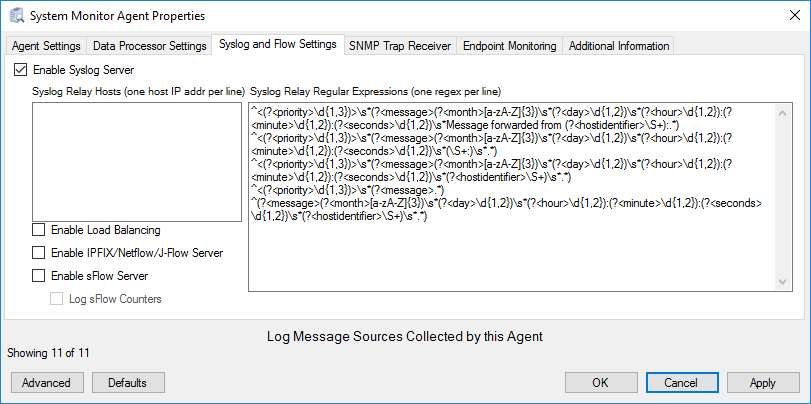
In the System Monitor Agent Properties window, navigate to Syslog and Flow Settings.
Click the checkbox beside Enable Syslog Server.
Click OK to close the System Monitor Agent Properties window.
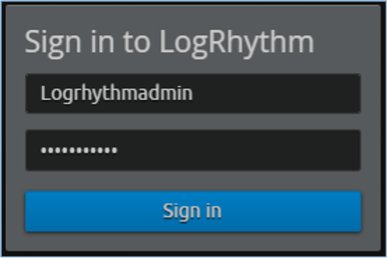
Use the LogRhythm Web Console
Open a web browser and navigate to https://localhost:8443.
Enter the Username: logrhythmadmin
Enter the Password: **********
2.2.4.3 LogRhythm NetworkXDR
LogRhythm NetworkXDR paired with LogRhythm XDR enables an environment to monitor network traffic between end points and helps suggest remediation techniques for identified concerns. This project utilizes NetworkXDR for continuous visibility on network traffic between HDO VLANs and incoming traffic from the telehealth platform provider.
System Requirements
CPU: 24 vCPUs
Memory: 64 GB RAM
Storage:
Operating System Hard Drive: 220 GB
Data Hard Drive: 3 TB
Operating System: CentOS 7
Network Adapter: VLAN 1348
LogRhythm NetworkXDR Installation
LogRhythm provides an International Organization for Standardization (.iso) disk image to simplify installation of NetMon. The .iso is a bootable image that installs CentOS 7.7 Minimal and NetMon. Note: Because this is an installation on a Linux box, there is no need to capture the screenshots.
Download the Installation Software
Open a new tab in the web browser and navigate to https://community.logrhythm.com.
Log in using the appropriate credentials.
Click LogRhythm Community.
Navigate to Documentation & Downloads.
Register a Username.
Click Accept.
Click Submit.
Navigate to NetMon.
Click downloads: netmon4.0.2.
Select NetMon ISO under Installation Files.
Install LogRhythm NetworkXDR
In the host server, mount the .iso for the installation.
Start the VM with the mounted .iso.
When the welcome screen loads, select Install LogRhythm Network Monitor.
The installer completes the installation, and the system reboots.
When the system reboots, log in to the console by using logrhythm as the login and ****** as the password.
Then change the password by typing the command
passwd, type the default password, and then type and verify the new password.
LogRhythm NetworkXDR Configuration
Data Process Address: 192.168.45.20
Click Apply.
Click the Windows Service tab.
Change the Service Type to Automatic.
Click Apply.
Click the Log File tab.
Click Refresh to ensure NetworkXDR log collection.
Click OK to exit the Local Configuration Manager.
2.2.4.4 LogRhythm System Monitor Agent
LogRhythm System Monitor Agent is a component of LogRhythm XDR that receives end-point log files and machine data in an IT infrastructure. The system monitor transmits ingested data to LogRhythm XDR where a web-based dashboard displays any identified cyber threats. This project deploys LogRhythm’s System Monitor Agents on end points in each identified VLAN.
Install the LogRhythm System Monitor Agent on one of the end points (e.g., Clinical Workstation) in the HDO environment so that the LogRhythm XDR can monitor the logs, such as syslog and eventlog, of this workstation.
System Monitor Agent Installation
This section describes installation of the system monitor agent.
Download Installation Packages
Using a Clinical Workstation, open a web browser.
Navigate to https://community.logrhythm.com.
Log in using the credentials made when installing and configuring LogRhythm XDR.
Navigate to LogRhythm Community.
Click Documents & Downloads.
Click SysMon.
Click SysMon – 7.4.10.
Click Windows System Monitor Agents and save to the Downloads folder on the Workstation.
Install System Monitor Agent
On the Workstation, navigate to Downloads folder.
Click LRWindowsSystemMonitorAgents.
Click LRSystemMonitor_64_7.
On the Welcome page, follow the Wizard and click Next….
On the ready to begin installation page, click Install.
Click Finish.
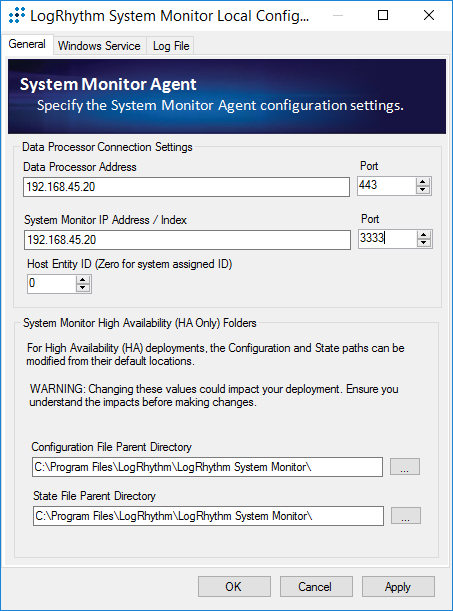
System Monitor Agent Configuration
After exiting the LogRhythm System Monitor Service Install Wizard, a LogRhythm System Monitor Local Configuration window displays. Under the General tab, provide the following information:
Data Process Address: 192.168.45.20
System Monitor IP Address/Index: 192.168.45.20
Click Apply.
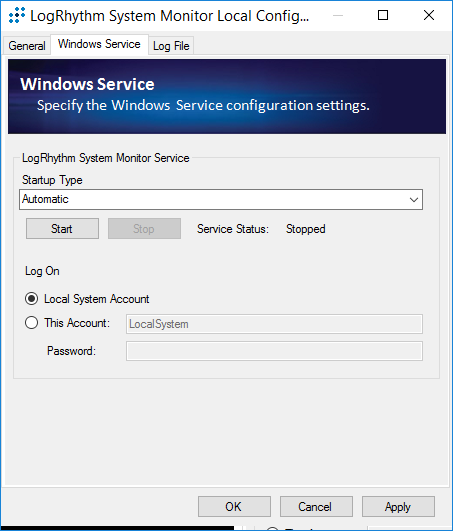
Click the Windows Service tab.
Change the Service Type to Automatic.
Click Apply.
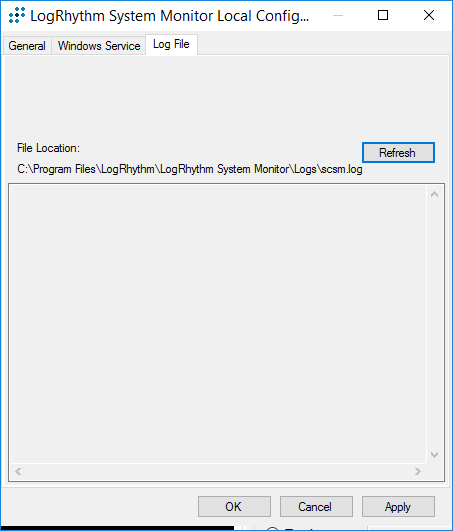
Click the Log File tab.
Click Refresh to ensure NetworkXDR log collection.
Click OK to exit the Local Configuration Manager.
Add Workstation for System Monitor
Engineers added Clinical Workstation for System Monitor and Set Its Message Source Types in the LogRhythm Deployment Manager.
Log in to the LogRhythm Console.
User ID: LogRhythmAdmin
Password: **********
Navigate to the Deployment Manager in the menu ribbon.
Under Entity Hosts, click on New.
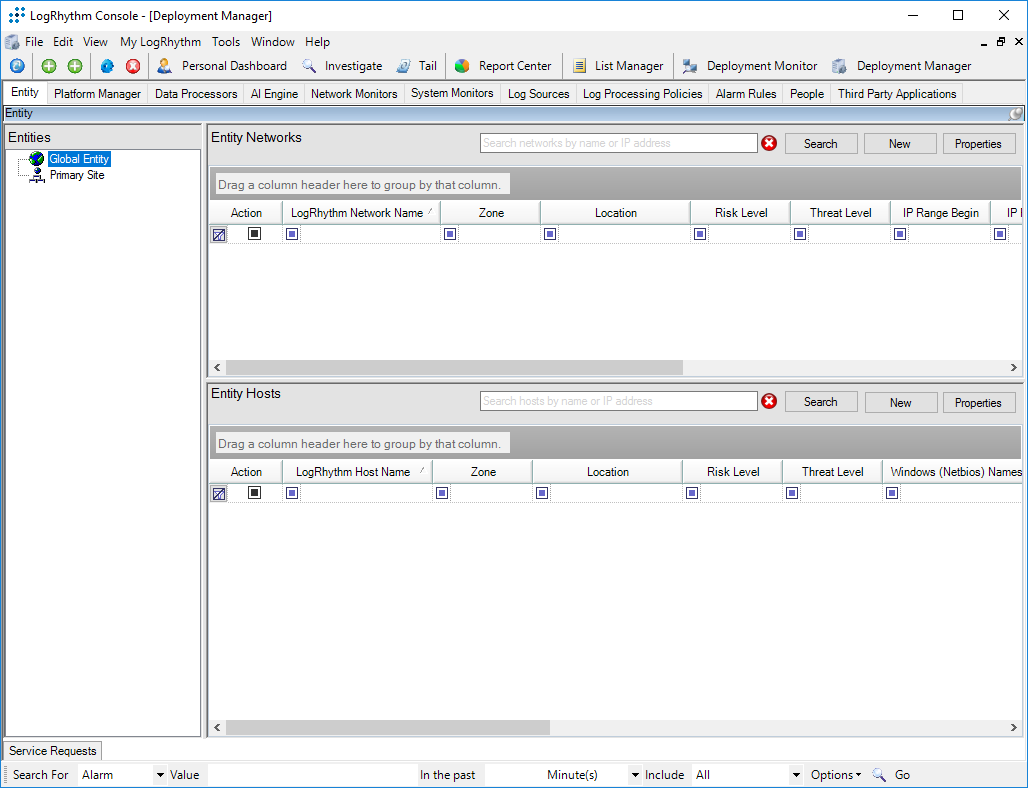
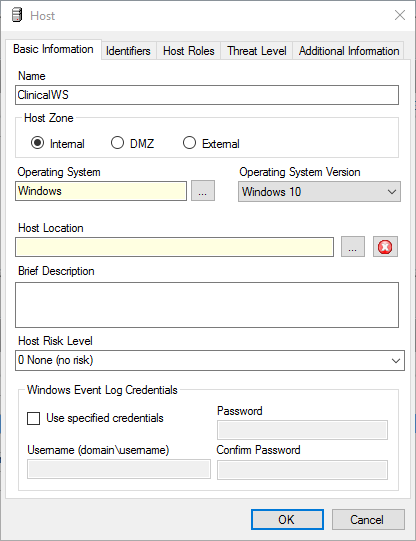
Click New to open the Host pop-up window and enter the following under the Basic Information tab:
Name: ClinicalWS
Host Zone: Internal
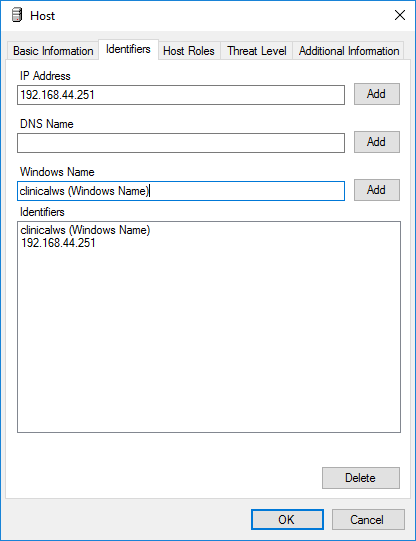
Navigate to the Identifiers tab, provide the following information in the appropriate fields and click Add.
IP Address: 192.168.44.251
Windows Name: clinicalws (Windows Name)
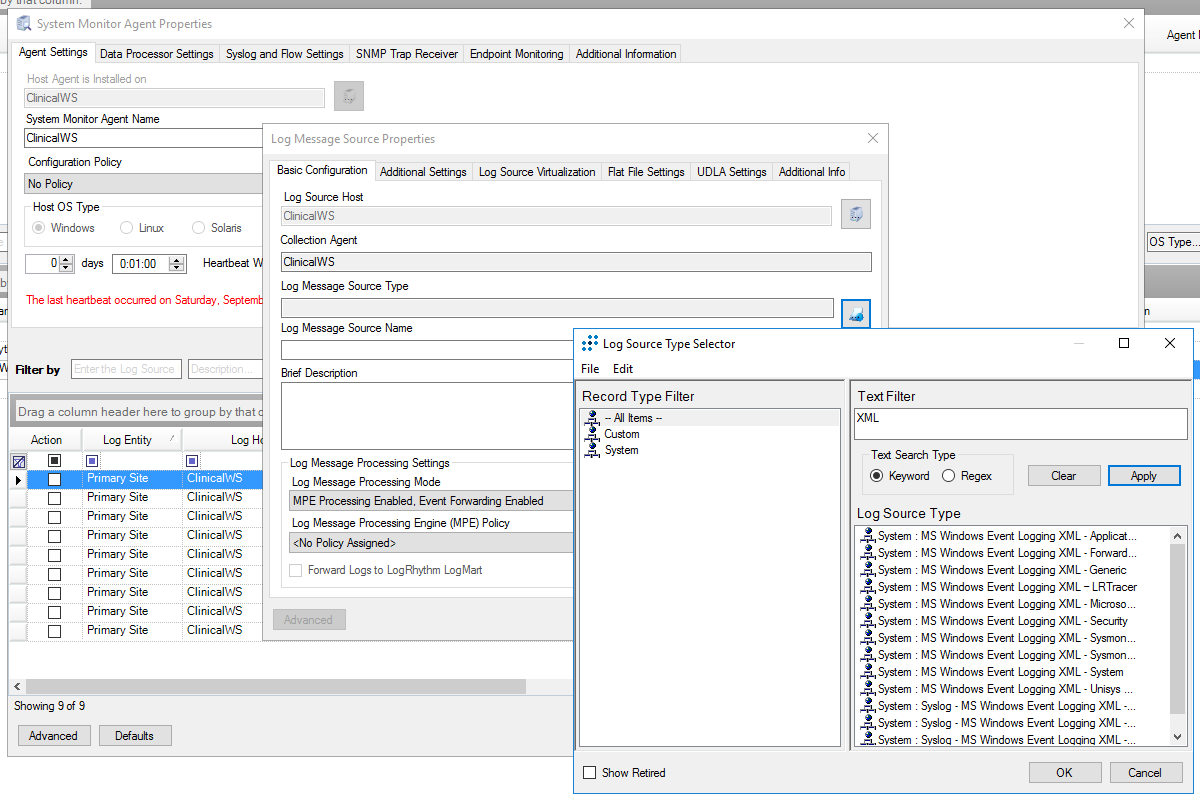
Add the ClinicalWS as a new system monitor agent by navigating to the System Monitors tab, right-clicking in the empty space, and selecting New.
In the System Monitor Agent Properties window, click the button next to Host Agent is Installed on and select Primary Site: ClinicalWS.
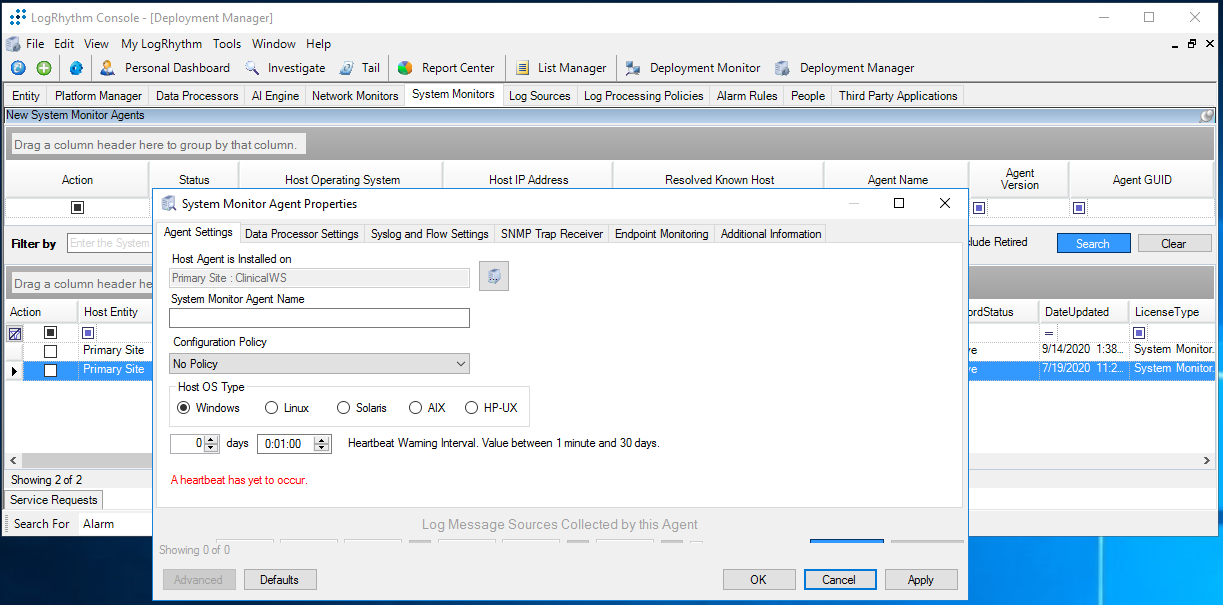
Go to System Monitors.
Double-click ClinicalWS.
Under LogSource of the System Monitor Agent Property window, right-click in the empty space and select New. The Log Message Source Property window will open.
Under the Log Message Source Property window, click the button associated with Log Message Source Type. It will open the Log Source Selector window.
In the text box to the right of the Log Source Selector window, type XML, and click Apply.
Select the Log Source Type and click OK.
2.2.5 Data Security
Data security controls align with the NIST Cybersecurity Framework’s PR.DS category. For this practice guide, the Onclave Networks solution was implemented as a component in the simulated patient home and simulated telehealth platform provider cloud environment. The Onclave Networks suite of tools provides secure communication between the two simulated environments when using broadband communications to exchange data.
2.2.5.1 Onclave SecureIoT
The Onclave SecureIoT deployment consists of six components: Onclave Blockchain, Onclave Administrator Console, Onclave Orchestrator, Onclave Bridge, and two Onclave Gateways. These components work together to provide secure network sessions between the deployed gateways.
Onclave SecureIoT Virtual Appliance Prerequisites
All Onclave devices require Debian 9.9/9.11/9.13. In addition, please prepare the following:
GitHub account.
Request an invitation to the Onclave Github account.
Once the GitHub invitation has been accepted and a Debian VM has been installed in the virtual environment, download and run the installation script to prepare the VM for configuration.
Run the command
sudo apt-get updateRun the command
apt install git -yRun the command
sudo apt install openssh-serverRun the command
git clone https://readonly:Sh1bboleth45@gitlab.onclave.net/onclave/build/install.git
Navigate to the /home/onclave/install directory.
Run the command
chmod +x \*.sh
This process can be repeated for each virtual appliance that is deployed. The following guidance assumes the system user is named onclave.
Onclave SecureIoT Blockchain Appliance Information
CPU: 4
RAM: 8 GB
Storage: 120 GB (Thick Provision)
Network Adapter 1: VLAN 1317
Operating System: Debian Linux 9.11
Onclave SecureIoT Blockchain Appliance Configuration Guide
Before starting the installation script, prepare an answer for each question. The script will configure the server, assign a host name, create a self-signed certificate, and start the required services.
Run the command
nano/etc/hostsEdit the Hosts file to include the IP address and domain name of each Onclave device, as well as Onclave’s docker server. This will include:
192.168.5.11 tele-adco.trpm.hclab
192.168.5.12 tele-orch.trpm.hclab
192.168.5.13 tele-bg.trpm.hclab
192.168.5.14 tele-gw1.trpm.hclab
192.168.21.10 tele-gw2.trpm.hclab
38.142.224.131 docker.onclave.net
Save the file and exit.
Navigate to the /home/onclave/install directory.
Run the command
./go.shand fill out the following information:What type of device is being deployed?: bci
Enter device hostname (NOT FQDN): tele-bci
Enter device DNS domain name: trpm.hclab
Enter the public NIC: ens192
Enter the private NIC, if does not exist type in NULL: NULL
Enter the IP Settings (DHCP or Static): PUBLIC NIC (Static)
address 192.168.5.10
netmask 255.255.255.0
gateway 192.168.5.1
dns-nameservers 192.168.1.10
What is the BCI FQDN for this environment?: tele-bci.trpm.hclab
Enter the Docker Service Image Path: NULL
Will system need TPM Emulator? (yes/no): no
Keystore/Truststore password to be used?: Onclave56
GitLab Username/Password (format username:password): readonly:Sh1bboleth45
Wait for the Blockchain server to reboot.
Login to the appliance.
Run the command
su rootand enter the password.Wait for the configuration process to finish.
Onclave SecureIoT Administrator Console Appliance Information
CPU: 4
RAM: 8 GB
Storage: 32 GB (Thick Provision)
Network Adapter 1: VLAN 1317
Operating System: Debian Linux 9.11
Onclave SecureIoT Administrator Console Appliance Configuration Guide
Run the command
scp onclave@192.168.5.10:/home/onclave/blockchain/certs/tele-bci.trpm.hclab.crt /root/certs
Run the command
nano/etc/hostsEdit the Hosts file to include the IP address and domain name of each Onclave device, as well as Onclave’s docker server. This will include:
192.168.5.10 tele-bci.trpm.hclab
192.168.5.12 tele-orch.trpm.hclab
192.168.5.13 tele-bg.trpm.hclab
192.168.5.14 tele-gw1.trpm.hclab
192.168.21.10 tele-gw2.trpm.hclab
38.142.224.131 docker.onclave.net
Save the file and exit.
Navigate to the /home/onclave/install directory.
Run the command
chmod +x \*.shRun the command
./go.shand fill out the following information:What type of device is being deployed?: adco
Enter device hostname (NOT FQDN): tele-adco
Enter device DNS domain name: trpm.hclab
Enter the public NIC: ens192
Enter the private NIC, if does not exist type in NULL: NULL
Enter the IP Settings (DHCP or Static): PUBLIC NIC (Static)
address 192.168.5.11
netmask 255.255.255.0
gateway 192.168.5.1
dns-nameservers 192.168.1.10
What is the BCI FQDN for this environment?: tele-bci.trpm.hclab
Enter the Docker Service Image Path: NULL
Will system need TPM Emulator? (yes/no): yes
Keystore/Truststore password to be used?: Onclave56
GitLab Username/Password (format username:password): readonly:Sh1bboleth45
Wait for the Administrator Console server to reboot.
Login to the appliance.
Run the command
su rootand enter the password.Wait for the configuration process to finish.
Navigate to the /home/onclave directory.
Run the command
docker pull
docker.onclave.net/orchestrator-service:1.1.0
Run the command
docker pull
docker.onclave.net/bridge-service:1.1.0
Run the command
docker pull
docker.onclave.net/gateway-service:1.1.0
Administrator Console Initialization and Bundle Creation
Using a web browser, navigate to https://tele-adco.trpm.hclab.
Click Verify.
Provide the following information:
Software ID (provided by Onclave)
Password (provided by Onclave)
PIN (provided by Onclave)
Provide the following information to create a superuser account:
First Name: *****
Last Name: *****
Username: *****@email.com
Password: ********
Organization Name: NCCoEHC
Click Software Bundles.
Click the plus symbol (top right) and provide the following information:
Bundle name: nccoe-tele-orch
Bundle type: Orchestrator
Owned by: NCCoEHC
Orchestrator owner name: HCLab
PIN: ****
Password: ********
Click Create.
Click the plus symbol (top right) and provide the following information:
Bundle name: nccoe-tele-bg
Bundle type: Bridge
Owned by: NCCoEHC
Click Create.
Click the plus symbol (top right) and provide the following information:
Bundle name: nccoe-tele-gw
Bundle type: Gateway
Owned by: NCCoEHC
Click Create.
Transfer Ownership of Onclave Devices to the Orchestrator
Once each Onclave device has been created and provisioned, it will show up in the Admin Console’s web GUI. From here, the devices can be transferred to the Orchestrator with the following steps:
Using a web browser, navigate to https://tele-adco.trpm.hclab.
Click Devices.
Select the checkbox next to tele-bg, tele-gw1, and tele-gw2.
Click Transfer ownership.
Under Select a new owner, select HCLab.
Click Transfer ownership.
Onclave SecureIoT Orchestrator Appliance Information
CPU: 4
RAM: 8 GB
Storage: 32 GB (Thick Provision)
Network Adapter 1: VLAN 1317
Operating System: Debian Linux 9.11
Onclave SecureIoT Orchestrator Appliance Configuration Guide
Run the command
scp onclave@192.168.5.10:/home/onclave/blockchain/certs/tele-bci.trpm.hclab.crt /root/certs
Run the command
nano/etc/hosts- Edit the Hosts file to include the IP address and
domain name of each Onclave device, as well as Onclave’s docker server. This will include:
192.168.5.10 tele-bci.trpm.hclab
192.168.5.11 tele-adco.trpm.hclab
192.168.5.13 tele-bg.trpm.hclab
192.168.5.14 tele-gw1.trpm.hclab
192.168.21.10 tele-gw2.trpm.hclab
38.142.224.131 docker.onclave.net
Save the file and exit.
Run the command
nano /etc/network/interfacesEdit the Interfaces file to include:
iface ens192 inet static
address 192.68.5.12
netmask 255.255.255.0
gateway 192.168.5.1
dns-nameservers 192.168.1.10
Save the file and exit.
Run the command
git clone https://github.com/Onclave-Networks/orch.gitNavigate to the /home/onclave/orch directory.
Run the command
chmod +x \*.shRun the command
./go.shand fill out the following information:What will be the hostname for your orchestrator?: tele-orch
- What will be the domain name for your orchestrator?:
trpm.hclab
Enter the deviceʼs public NIC: ens192
What is the Blockchain environment?: tele-bci
Will system need TPM Emulator? (yes/no): yes
- What is the docker image for the Orchestrator Service?:
docker.onclave.net/orchestrator-service:1.1.0- nccoe-tele-orch
Reboot the Orchestrator server.
Using a web browser, navigate to https://tele-orch.trpm.hclab.
Click Verify.
Provide the following information (created when making the bundle in the Admin Console):
Software ID
Password
PIN
Provide the following information to create a superuser account:
First Name: *****
Last Name: *****
Username: *****@email.com
Password: ********
Organization Name: Telehealth Lab
Create a Customer in the Orchestrator
Using a web browser, navigate to https://tele-orch.trpm.hclab.
Click Customers.
Click the plus symbol.
Under Attributes > Customer Name, enter Telehealth Lab.
Click Create.
Create a Secure Enclave
Once each Onclave device has been transferred to the Orchestrator, it will show up in the Orchestrator’s web GUI. From here, the secure enclave can be created with the following steps:
Using a web browser, navigate to https://tele-orch.trpm.hclab.
Click Secure Enclaves.
Click the plus symbol.
Under General, provide the following information:
Secure Enclave name: TeleHealth Secure Enclave
Customer: Telehealth Lab
Sleeve ID: 51
Under Subnets, provide a Network Address (CIDR notation) of 192.168.50.0/24.
Under Session Key, provide a Lifespan (minutes) of 60.
Click Create.
Prepare the Bridge for Inclusion in the Secure Enclave
Using a web browser, navigate to https://tele-orch.trpm.hclab.
Click Devices.
Select the bridge and provide the following information:
Device Name: tele-bg
Customer: Telehealth Lab
Secure Enclaves: Not assigned to any Secure Enclave
State: Orchestrator Acquired
Secure tunnel port number: 820
Private interface IP address undefined: checked
Click Save.
Prepare the Telehealth Gateway for Inclusion in the Secure Enclave
Using a web browser, navigate to https://tele-orch.trpm.hclab.
Click Devices.
Select the bridge and provide the following information:
Device Name: tele-gw1
Customer: Telehealth Lab
Secure Enclaves: Not assigned to any Secure Enclave
State: Orchestrator Acquired
Secure tunnel port number: 820
Private interface IP address undefined: checked
Click Save.
Prepare the Home Gateway for Inclusion in the Secure Enclave
Using a web browser, navigate to https://tele-orch.trpm.hclab.
Click Devices.
Select the bridge and provide the following information:
Device Name: tele-gw2
Customer: Telehealth Lab
Secure Enclaves: Not assigned to any Secure Enclave
State: Orchestrator Acquired
Secure tunnel port number: 820
Private interface IP address undefined: checked
Click Save.
Establish the Secure Enclave
Once the secure enclave has been created and each Onclave device has been configured with a name and customer, the secure enclave can be established with the following steps:
Using a web browser, navigate to https://tele-orch.trpm.hclab.
Click Secure Enclaves.
Click the edit symbol for the previously created secure enclave.
Under Topology, click Add a Bridge.
Select tele-bg.
Click Add.
Click Add a Gateway.
Select tele-gw1.
Click Add.
Click Add a Gateway.
Select tele-gw2.
Click Add.
Under Topology Controls, toggle on Approve topology.
Click Save Changes.
Click Devices.
Refresh the Devices page until each device is labeled as Topology Approved.
Click Secure Enclaves.
Click the edit symbol for the previously created secure enclave.
Under Topology, toggle on Trust All Devices.
Click Save Changes.
Click Devices.
Refresh the Devices page until each device is labeled as Secured.
Onclave SecureIoT Bridge Appliance Information
CPU: 4
RAM: 8 GB
Storage: 32 GB (Thick Provision)
Network Adapter 1: VLAN 1317
Network Adapter 2: VLAN 1319
Operating System: Debian Linux 9.11
Onclave SecureIoT Bridge Appliance Configuration Guide
Run the command
scp onclave@192.168.5.10:/home/onclave/blockchain/certs/tele-bci.trpm.hclab.crt /root/certs
Run the command
nano /etc/hostsEdit the Hosts file to include the IP address and domain name of each Onclave device, as well as Onclave’s docker server. This will include:
192.168.5.10 tele-bci.trpm.hclab
192.168.5.11 tele-adco.trpm.hclab
192.168.5.12 tele-orch.trpm.hclab
192.168.5.14 tele-gw1.trpm.hclab
192.168.21.10 tele-gw2.trpm.hclab
38.142.224.131 docker.onclave.net
Run the command
nano /etc/network/interfacesEdit the Interfaces file to include:
iface ens192 inet static
address 192.68.5.13
netmask 255.255.255.0
gateway 192.168.5.1
dns-nameservers 192.168.1.10
iface ens224 inet static
Save the file and exit.
Run the command
git clone https://github.com/Onclave-Networks/bridge.gitNavigate to the /home/onclave/bridge directory.
Run the command
chmod +x \*.shRun the command
./go.shWhat will be the hostname for your bridge?: tele-bg
What will be the domain name for your bridge?: trpm.hclab
Enter the deviceʼs public NIC: ens192
Enter the device’s private NIC: ens224
What is the Blockchain environment?: tele-bci
Will system need TPM Emulator? (yes/no): yes
What is the docker image for the Bridge Service?: docker.onclave.net/bridge-service:1.1.0- nccoe-tele-bg
Reboot the Bridge server.
Onclave SecureIoT Telehealth Gateway Appliance Information
CPU: 2
RAM: 8 GB
Storage: 16 GB
Network Adapter 1: VLAN 1317
Network Adapter 2: VLAN 1349
Operating System: Debian Linux 9.11
Onclave SecureIoT Telehealth Gateway Appliance Configuration Guide
Run the command
scp onclave@192.168.5.10:/home/onclave/blockchain/certs/tele-bci.trpm.hclab.crt /root/certs
Run the command
nano /etc/hostsEdit the Hosts file to include the IP address and domain name of each Onclave device, as well as Onclave’s docker server. This will include:
192.168.5.10 tele-bci.trpm.hclab
192.168.5.11 tele-adco.trpm.hclab
192.168.5.12 tele-orch.trpm.hclab
192.168.5.13 tele-bg.trpm.hclab
192.168.21.10 tele-gw2.trpm.hclab
38.142.224.131 docker.onclave.net
Run the command
nano /etc/network/interfacesEdit the Interfaces file to include:
iface enp3s0 inet static
address 192.168.5.14
netmask 255.255.255.0
gateway 192.168.5.1
dns-nameservers 192.168.1.10
iface ens224 inet dhcp
Save the file and exit.
Run the command
git clone
https://github.com/Onclave-Networks/gateway.git
Navigate to the /home/onclave/gateway directory.
Run the command
chmod +x \*.shRun the command
./go.shWhat will be the hostname for your gateway?: tele-gw1
What will be the domain name for your gateway?: trpm.hclab
Enter the deviceʼs public NIC: enp3s0
Enter the deviceʼs private NIC: enp2s0
What is the Blockchain environment?: tele-bci
Will system need TPM Emulator? (yes/no): no
What is the docker image for the Gateway Service?: docker.onclave.net/ gateway-service:1.1.0- nccoe-tele-gw
Reboot the Gateway server.
Onclave SecureIoT Home Wi-Fi Gateway Appliance Information
CPU: 1
RAM: 4 GB
Storage: 16 GB
Network Adapter 1: VLAN 1332
Network Adapter 2: VLAN 1350 (Wi-Fi)
Operating System: Debian Linux 9.11
Onclave SecureIoT Home Wi-Fi Gateway Appliance Configuration Guide
Run the command
scp onclave@192.168.5.10:/home/onclave/blockchain/certs/tele-bci.trpm.hclab.crt /root/certs
Run the command
nano /etc/hostsEdit the Hosts file to include the IP address and domain name of each Onclave device, as well as Onclave’s docker server. This will include:
192.168.5.10 tele-bci.trpm.hclab
192.168.5.11 tele-adco.trpm.hclab
192.168.5.12 tele-orch.trpm.hclab
192.168.5.13 tele-bg.trpm.hclab
192.168.5.14 tele-gw1.trpm.hclab
38.142.224.131 docker.onclave.net
Run the command
nano /etc/network/interfacesEdit the Interfaces file to include:
iface enp3s0 inet static
address 192.168.21.10
netmask 255.255.255.0
gateway 192.168.21.1
dns-nameservers 192.168.1.10
iface br0 inet static
bridge_ports br51 wlp5s0
iface wlp5s0 inet manual
Save the file and exit.
Run the command
git clone
https://github.com/Onclave-Networks/hostapd-29.git
Navigate to the /home/onclave/hostapd-29 directory.
Run the command
chmod +x \*.shRun the command
./hostapd-29.shNavigate to the /home/onclave directory.
Run the command
git clone
https://github.com/Onclave-Networks/hostapd-client.git
Navigate to the /home/onclave/hostapd-client directory.
Run the command
chmod +x \*.shRun the command
./hostapd-client.shNavigate to the /home/onclave directory.
Run the command
git clone
https://github.com/Onclave-Networks/gateway.git
Navigate to the /home/onclave/gateway directory.
Run the command
chmod +x \*.shRun the command
./go.shWhat will be the hostname for your gateway?: tele-gw2
What will be the domain name for your gateway?: trpm.hclab
Enter the deviceʼs public NIC: enp3s0
Enter the deviceʼs private NIC: wlp5s0
What is the Blockchain environment?: tele-bci
Will system need TPM Emulator? (yes/no): no
What is the docker image for the Gateway Service?: docker.onclave.net/ gateway-service:1.1.0- nccoe-tele-gw
Reboot the Gateway server.