NIST SPECIAL PUBLICATION 1800-23
Energy Sector Asset Management
For Electric Utilities, Oil & Gas Industry
Volume C:
How-to Guides
James McCarthy
Glen Joy
National Cybersecurity Center of Excellence
Information Technology Laboratory
Lauren Acierto
Jason Kuruvilla
Titilayo Ogunyale
Nikolas Urlaub
John Wiltberger
Devin Wynne
The MITRE Corporation
McLean, Virginia
May 2020
Final
This publication is available free of charge from: https://doi.org/10.6028/NIST.SP.1800-23
The first draft of this publication is available free of charge from: https://www.nccoe.nist.gov/library/energy-sector-asset-management-nist-sp-1800-23-practice-guide

DISCLAIMER
Certain commercial entities, equipment, products, or materials may be identified by name or company logo or other insignia in order to acknowledge their participation in this collaboration or to describe an experimental procedure or concept adequately. Such identification is not intended to imply special status or relationship with NIST or recommendation or endorsement by NIST or NCCoE; neither is it intended to imply that the entities, equipment, products, or materials are necessarily the best available for the purpose.
National Institute of Standards and Technology Special Publication 1800-23C, Natl. Inst. Stand. Technol. Spec. Publ. 1800-23C, 76 pages, (May 2020), CODEN: NSPUE2
FEEDBACK
As a private-public partnership, we are always seeking feedback on our practice guides. We are particularly interested in seeing how businesses apply NCCoE reference designs in the real world. If you have implemented the reference design, or have questions about applying it in your environment, please email us at energy_nccoe@nist.gov.
All comments are subject to release under the Freedom of Information Act.
NATIONAL CYBERSECURITY CENTER OF EXCELLENCE
The National Cybersecurity Center of Excellence (NCCoE), a part of the National Institute of Standards and Technology (NIST), is a collaborative hub where industry organizations, government agencies, and academic institutions work together to address businesses’ most pressing cybersecurity issues. This public-private partnership enables the creation of practical cybersecurity solutions for specific industries, as well as for broad, cross-sector technology challenges. Through consortia under Cooperative Research and Development Agreements (CRADAs), including technology partners—from Fortune 50 market leaders to smaller companies specializing in information technology security—the NCCoE applies standards and best practices to develop modular, easily adaptable example cybersecurity solutions using commercially available technology. The NCCoE documents these example solutions in the NIST Special Publication 1800 series, which maps capabilities to the NIST Cybersecurity Framework and details the steps needed for another entity to re-create the example solution. The NCCoE was established in 2012 by NIST in partnership with the State of Maryland and Montgomery County, Maryland.
NIST CYBERSECURITY PRACTICE GUIDES
NIST Cybersecurity Practice Guides (Special Publication 1800 series) target specific cybersecurity challenges in the public and private sectors. They are practical, user-friendly guides that facilitate the adoption of standards-based approaches to cybersecurity. They show members of the information security community how to implement example solutions that help them align more easily with relevant standards and best practices, and provide users with the materials lists, configuration files, and other information they need to implement a similar approach.
The documents in this series describe example implementations of cybersecurity practices that businesses and other organizations may voluntarily adopt. These documents do not describe regulations or mandatory practices, nor do they carry statutory authority.
ABSTRACT
Industrial control systems (ICS) compose a core part of our nation’s critical infrastructure. Energy sector companies rely on ICS to generate, transmit, and distribute power and to drill, produce, refine, and transport oil and natural gas. Given the wide variety of ICS assets, such as programmable logic controllers and intelligent electronic devices, that provide command and control information on operational technology (OT) networks, it is essential to protect these devices to maintain continuity of operations. These assets must be monitored and managed to reduce the risk of a cyber attack on ICS-networked environments. Having an accurate OT asset inventory is a critical component of an overall cybersecurity strategy.
The NCCoE at NIST is responding to the energy sector’s request for an automated OT asset management solution. To remain fully operational, energy sector entities should be able to effectively identify, control, and monitor their OT assets. This document provides guidance on how to enhance OT asset management practices, by leveraging capabilities that may already exist in an energy organization’s operating environment as well as by implementing new capabilities.
KEYWORDS
energy sector asset management; ESAM; ICS; industrial control system; malicious actor; monitoring; operational technology; OT; SCADA; supervisory control and data acquisition
ACKNOWLEDGMENTS
We are grateful to the following individuals for their generous contributions of expertise and time.
Name |
Organization |
|---|---|
Matt Cowell |
Dragos, Inc. |
Tom VanNorman |
Dragos, Inc. |
Andrew Dunham |
Forescout Technologies, Inc. |
Tim Jones |
Forescout Technologies, Inc. |
John Norsworthy |
Forescout Technologies, Inc. |
Lindsey Hale |
FoxGuard Solutions, Inc. |
Steve Boyd |
KORE Wireless, Inc. |
Brian Hicks |
KORE Wireless, Inc. |
Adam Cohn |
Splunk Inc. |
Bill Wright |
Splunk Inc. |
Ray Erlinger |
TDi Technologies, Inc. |
Bill Johnson |
TDi Technologies, Inc. |
Samantha Pelletier |
TDi Technologies, Inc. |
Gabe Authier |
Tripwire, Inc. |
Steven Sletten |
Tripwire, Inc. |
Jim Wachhaus |
Tripwire, Inc. |
The Technology Partners/Collaborators who participated in this build submitted their capabilities in response to a notice in the Federal Register. Respondents with relevant capabilities or product components were invited to sign a Cooperative Research and Development Agreement (CRADA) with NIST, allowing them to participate in a consortium to build this example solution. We worked with:
Technology Partner/Collaborator |
Build Involvement |
|---|---|
Dragos Platform v1.5 |
|
ForeScout CounterACT v8.0.1 |
|
FoxGuard Solutions Patch and Update Management Program v1 |
|
KORE Wireless Cellular Connectivity with Cellular Gateway v2.0 |
|
Splunk Enterprise v7.1.3 |
|
TDi Technologies ConsoleWorks v5.2-0u1 |
|
Tripwire Industrial Visibility v3.2.1 |
List of Figures
Figure 1‑1 High-Level Topology
Figure 2‑1 Update Availability Summary
Figure 2‑2 Device Update Availability Details-1
Figure 2‑3 Device Update Availability Details-2
Figure 2‑4 Device Update Availability Details-3
Figure 2‑5 Device Update Availability Details-4
Figure 2‑6 Device Update Availability Details-5
Figure 2‑7 Patch Evidence Documentation
List of Tables
Table 2‑1 Dragos Required Files 44
1 Introduction
The following volumes of this guide show information technology (IT) professionals and security engineers how we implemented this example solution. We cover all of the products employed in this reference design. We do not re-create the product manufacturers’ documentation, which is presumed to be widely available. Rather, these volumes show how we incorporated the products together in our environment.
Note: These are not comprehensive tutorials. There are many possible service and security configurations for these products that are out of scope for this reference design.
1.1 Practice Guide Structure
This National Institute of Standards and Technology (NIST) Cybersecurity Practice Guide demonstrates a standards-based reference design and provides users with the information they need to replicate this asset management solution in the energy sector. This reference design is modular and can be deployed in whole or in part.
This guide contains three volumes:
NIST SP 1800-23A: Executive Summary
NIST SP 1800-23B: Approach, Architecture, and Security Characteristics – what we built and why
NIST SP 1800-23C: How-To Guides – instructions for building the example solution (you are here)
Depending on your role in your organization, you might use this guide in different ways:
Senior IT executives, including chief information security and technology officers, will be interested in the Executive Summary, NIST SP 1800-23A, which describes the following topics:
challenges that enterprises face in operational technology (OT) asset management
example solution built at the NCCoE
benefits of adopting the example solution
Technology or security program managers who are concerned with how to identify, understand, assess, and mitigate risk will be interested in NIST SP 1800-23B, which describes what we did and why. The following sections will be of particular interest:
Section 3.4, Risk Assessment, provides a description of the risk analysis we performed.
Section 3.4.4, Security Control Map, maps the security characteristics of this example solution to cybersecurity standards and best practices.
You might share the Executive Summary, NIST SP 1800-23A, with your leadership team members to help them understand the importance of adopting a standards-based solution to strengthen their OT asset management practices, by leveraging capabilities that may already exist within their operating environment or by implementing new capabilities.
IT professionals who want to implement an approach like this will find this whole practice guide useful. You can use this How-To portion of the guide, NIST SP 1800-23C, to replicate all or parts of the build created in our lab. This How-To portion of the guide provides specific product installation, configuration, and integration instructions for implementing the example solution. We do not recreate the product manufacturers’ documentation, which is generally widely available. Rather, we show how we incorporated the products together in our environment to create an example solution.
This guide assumes that IT professionals have experience implementing security products within the enterprise. While we have used a suite of commercial products to address this challenge, this guide does not endorse these particular products. Your organization can adopt this solution or one that adheres to these guidelines in whole, or you can use this guide as a starting point for tailoring and implementing parts of the energy sector asset management (ESAM) solution. Your organization’s security experts should identify the products that will best integrate with your existing tools and IT system infrastructure. We hope that you will seek products that are congruent with applicable standards and best practices. Volume B, Section 3.5, Technologies, lists the products that we used and maps them to the cybersecurity controls provided by this reference solution.
A NIST Cybersecurity Practice Guide does not describe “the” solution, but a possible solution. This is a draft guide. We seek feedback on its contents and welcome your input. Comments, suggestions, and success stories will improve subsequent versions of this guide. Please contribute your thoughts to energy_nccoe@nist.gov.
Acronyms used in figures can be found in the List of Acronyms appendix.
1.2 Build Overview
The example solution fulfills the need for an automated asset inventory. This example solution allows devices to be identified in multiple ways, depending on the needs of the organization. The architecture is intended as one solution.
The example solution makes use of two “remote” sites, while the National Cybersecurity Center of Excellence (NCCoE) serves as the enterprise location as shown in Figure 1 below. Having a central enterprise location provides flexibility to add multiple sites as well as the ability to collect all data in one place.
Figure 1-1 High-Level Topology
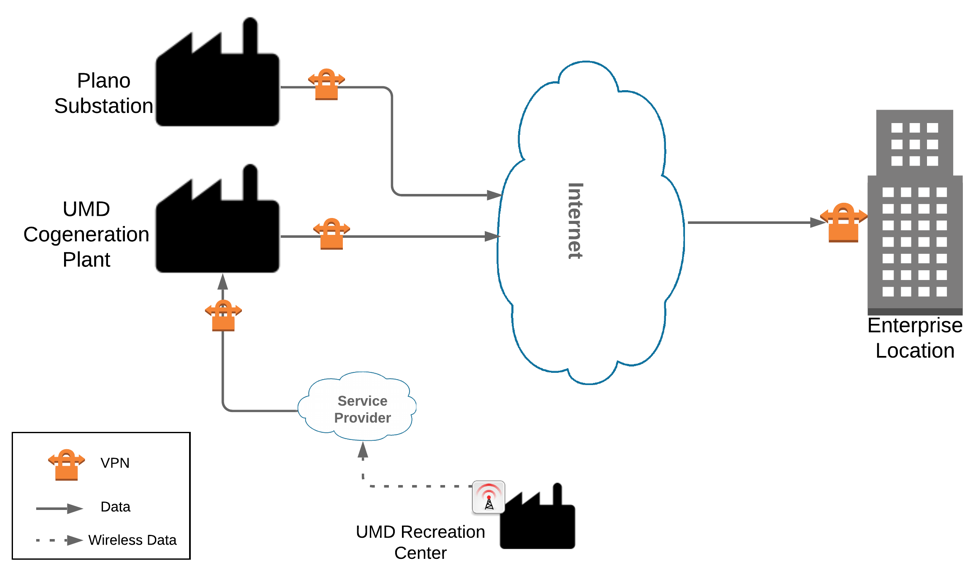
Different components in the build are installed at each location. However, some components preexist, including the OT assets, networks, routers, and protocol converters. This guide will describe the installation and configuration details of the components installed at each site but not preexisting components. A detailed topology and description of each site can be found in Volume B, Section 4.2, Example Solution.
1.3 Typographic Conventions
The following table presents typographic conventions used in this volume.
Typeface/Symbol |
Meaning |
Example |
|---|---|---|
Italics |
file names and path names; references to documents that are not hyperlinks; new terms; and placeholders |
For language use and style guidance, see the NCCoE Style Guide. |
Bold |
names of menus, options, command buttons, and fields |
Choose File > Edit. |
|
command-line input, onscreen computer output, sample code examples, and status codes |
mkdir |
Monospace Bold |
command-line user input contrasted with computer output |
service sshd start |
blue text |
link to other parts of the document, a web URL, or an email address |
All publications from NIST’s NCCoE are available at https://www.nccoe.nist.gov. |
1.4 Logical Architecture Summary
A logical architecture summary can be found in Volume B of this practice guide, Section 4.1, Architecture Description.
2 Product Installation Guides
This section of the practice guide contains detailed instructions for installing and configuring all of the products, where applicable, used to build an instance of the example solution.
2.1 ConsoleWorks
ConsoleWorks performs as a data collection server and a data analysis server. The data collection server is located at the University of Maryland (UMD) and reads data from a steam meter via protocol converters. The data analysis server resides at the NCCoE and normalizes data collected from security information and event management (SIEM) software, for processing by the patch analysis and reporting tool.
2.1.1 ConsoleWorks Configurations at the NCCoE
The following subsections document the software, hardware/virtual machine (VM), and network configurations for the ConsoleWorks server at the NCCoE.
2.1.1.1 VM Configuration
The ConsoleWorks VM is given the following resources:
CentOS 7.5
Central processing unit (CPU) cores
100 gigabyte (GB) hard disk
10 GB random access memory (RAM)
1 network interface controller/card (NIC)
2.1.1.2 Network Configuration
Dynamic Host Configuration Protocol (DHCP): disabled
Internet protocol version (IPv)6: ignore
IPv4: Manual
IPv4 address: 10.100.100.6
Netmask: 255.255.255.0
2.1.1.3 Installation
Download the installation kit from the http://support.tditechnologies.com website. A username and password are required, so contact TDi Support at support@tditechnologies.com to request them.
Create a directory to contain the ConsoleWorks installation files:
#mkdir temp/conworksRun the following command:
# yum local install consoleworkssssl-<version>_x86_64.rpmExtract the provided compressed license script to /tmp/conworks.
Run the script from the extracted zip file.
Start ConsoleWorks with the following command:
# /opt/ConsoleWorks/bin/cw_start defaultConnect to the Console at https://10.100.100.6:5176. Log in using the default credentials.
Fill in the details for Registration. Click Register Online. Click Save.
Create a new user. Navigate on the left to Users > Add.
Enter the Name and Password. Select Add.
Add CONSOLE_MANAGER as a selected profile, as shown in the screenshot below. Select OK.
Click Save.
2.1.1.4 Configuration
ConsoleWorks provides the scripts to normalize data, for processing by FoxGuard Patch and Update Management Program (PUMP). The script provided is in extensible markup language (XML) format.
Import the provided XML file at Admin > Database Management > XML Imports > Import.
Click Choose Files. Locate the provided XML file. Select Next.
Select Next. The import is complete.
Open the baseline configuration at Tools > Baseline Configurations > View. Select Edit.
Under Processors, select the scan, and click Edit.
Under Collection, update the path to match where Splunk saves the inventory, as shown in the screenshot.
// TODO: Change path to parent directory of CSV data file

runSetup("cd /opt/splunk/var/run/splunk/csv");

// Read the newest file in the directory

runCommand("cat \`ls -t | head -1\`", "Forescout_Information", 5);
Under Reduction, enter the following script, as shown in the screenshot below.
include("UTIL");
include("UTIL_CUSTOM_FILE");
include("UTIL_JSON");
/////////////////////////////////////////////////////////////////////////////////////////////////////////
// Massage the header
function correctHeader(str) {
return((/[\w\-\ ]*type\b/i.test(str))   ?"ApplicationType"
 :    (/\bip[\w\-\ ]*/i.test(str))     ?"IPAddress"
    :    (/\bmac[\w\-\ ]*/i.test(str))    ?"MACAddress"
    :    (/\bmodel[\w\-\ ]*/i.test(str))  ?"ModelNumber"
    :    (/\bpart[\w\-\ ]*/i.test(str))   ?"PartNumber"
    :    (/\basset.?id\b/i.test(str))     ?"PK"
    :    (/\bproduct[\w\-\ ]*/i.test(str))?"ProductName"
    :    (/\bserial[\w\-\ ]*/i.test(str)) ?"SerialNumber"
    :    (/\bvendor/i.test(String(str)))  ?"VendorName"
    :    (/version/i.test(String(str)))   ?"VersionName"
    :                                      String(str).replace(/[\W\_]+/g, " ").camelSpaced().toCapCase().replace(/\ +/g, ""));
}
/////////////////////////////////////////////////////////////////////////////////////////////////////////
// ref: http://stackoverflow.com/a/1293163/2343
function CSVToArray(strData, strDelimiter) {
  // Check to see if the delimiter is defined. If not, then default to comma.
  strDelimiter=(typeof strDelimiter!='undefined')?strDelimiter:",";
  // Create a regular expression to parse the CSV values.
  //                         Delimiters                          Quoted fields                  Standard fields.
  var objPattern=new RegExp(("(\\"+strDelimiter+"|\\r?\\n|\\r|^)(?:\"([^\"]*(?:\"\"[^\"]*)*)\"|([^\"\\"+strDelimiter+"\\r\\n]*))"), "gi");
  // Create an array to hold our data. Give the array a default empty first row.
  var arrData=[[]];
  // Create an array to hold our individual pattern matching groups.
  var arrMatches=null;
  // Keep looping over the regular expression matches until we can no longer find a match.
  while(arrMatches=objPattern.exec(strData)) {
    // Get the delimiter that was found.
    var strMatchedDelimiter=arrMatches[1];
    // Check to see if the given delimiter has a length (is not the start of string) and if it matches field delimiter.
    // If it does not, then we know that this delimiter is a row delimiter.
    if(strMatchedDelimiter.length && strMatchedDelimiter!==strDelimiter) {
      // Since we have reached a new row of data, add an empty row to our data array.
      arrData.push([]);
    }
    var strMatchedValue;
    // Now that we have our delimiter out of the way, let's check to see which kind of value we captured (quoted or unquoted).
    if(arrMatches[2]) {
      // We found a quoted value. When we capture this value, unescape any double quotes.
      //strMatchedValue=arrMatches[2].replace(new RegExp( "\"\"", "g" ), "\"");
      strMatchedValue=arrMatches[2].replace(/\"{2}/g, '"');
    } else {
      // We found a non-quoted value.
      strMatchedValue=arrMatches[3];
    }
    // Now that we have our value string, let's add it to the data array.
    arrData[arrData.length-1].push(strMatchedValue);
  }
  // Return the parsed data.
  return(arrData);
}
/////////////////////////////////////////////////////////////////////////////////////////////////////////
function procCSV(csv) {
  // Convert string to YYYYMMDD_HHMMSS for readability
  var outputDir="/FOXGUARD/"+(now.slice(0,8));
  var outputFile=""+outputDir+"/"+(now.slice(8,14));
  var result=[];
  // Default of negative feedback
  var tracker=false;
  if(typeof csv!='undefined' && csv.length>0) {
    try {
      var lines=CSVToArray(csv);
      lines.shift();
      if(lines.length>1) {
        try {
          // Header names
          var props=lines[0];
          if(props.length>0) {
            // Massage header names
            for(var k=0;k<props.length;k++) {
              if(props[k].length>0) {
                props[k]=correctHeader(props[k]);
              }
            }
            for(i=1;i<lines.length;i++) {
              var j=lines[i];
              if(j.length>0) {
                var obj={
                  "ApplicationType": "Firmware",
                  "ModelNumber": "unspecified",
                  "PartNumber": "unspecified",
                  "PK": "unspecified",
                  "ProductName": "unspecified",
                  "SerialNumber": "unspecified",
                 "VendorName": "unspecified",
                 "VersionName": "unspecified"
               };
                if(String(ServerConfig.getList()[0].conwrksinvo).split("/")[3]!="default") {
                  obj.Site=String(ServerConfig.getList()[0].conwrksinvo).split("/")[3];
                }
                for(var k=0;k<props.length;k++) {
                  if(Boolean(j[k]) && j[k]!="-") {
                    switch(props[k]) {
                      case "IPAddress":
                        //obj.IPAddress=(rEIPv4.test(j[k]))?j[k].match(rEIPv4)[1]:(rEIPv6.test(j[k]))?j[k].match(rEIPv6)[1]:"unspecified";
                        break;
                      case "MACAddress":
                        //obj.MACAddress=(rEMAC.test(j[k]))?j[k].match(rEMAC)[1]:"unspecified";
                        break;
                      case "OperatingSystem":
                        obj.ApplicationType="Operating System";
                        obj.OperatingSystem=j[k];
                        obj.ProductName=j[k];
                        break;
                      case "VendorName":
                        if(obj.VendorName=="unspecified") {
                          obj.VendorName=j[k];
                        }
                        break;
                      case "VersionName":
                        obj.VersionName=j[k];
                        if(rESEL.test(j[k])) {
                          obj.ModelNumber=j[k].match(rESEL)[1];
                          obj.VendorName="Schweitzer";
                        }
                        break;
                      default:
                        obj[props[k]]=j[k];
                        break;
                    }
                  }
                }
                if(obj.hasOwnProperty('OperatingSystem')) {
                  obj.OperatingSystemVersion=obj.VersionName;
                  //delete obj.VersionName;
                }
                for(var p in obj) {
                  // These are required properties
                  if(["ProductName", "VendorName", "VersionName"].indexOf(p)<0) {
                    // Not a required property, and no useful data, get rid of it!
                    if(Boolean(obj[p])==false || obj[p]=="unspecified") {
                      delete obj[p];
                    }
                  }
                }
                result.push({
                  "AssetIdentifiers": obj,
                  "FUI": null
                });
              }
            }
            try {
              setReduction("Forescout_Information", JSON.stringify(result, null, 2));
              makeDirectory(""+outputDir);
              // File for FoxGuard
              setCustomFileContents(""+outputFile+".txt", JSON.stringify(result, null, 2));
              // Copy of original input
              //setCustomFileContents(""+outputFile+".csv", csv);
              // If everything goes great, return with positive feedback
              tracker=true;
            } catch(ex) {
              print("ERROR: "+ex);
            }
          } else {
            print("ERROR: Missing header data");
          }
        } catch(ex) {
          print("ERROR: "+ex);
        }
      } else {
        print("ERROR: Going to need more data than this");
      }
    } catch(ex) {
      print("ERROR: "+ex);
    }
  } else {
    print("ERROR: We got nothing!");
  }
  return(tracker);
}
/////////////////////////////////////////////////////////////////////////////////////////////////////////
// value for TZ offset
var d=0;
try {
  d=new Date().getTimezoneOffset();
} catch(ex) {
  print("ERROR: "+ex);
}
// Create string of YYYYMMDDHHMMSS
var now=String(new Date(Date.now()-(d*60000)).toJSON()).replace(/\D/g, "").slice(0,14);
// IPv4
var rEIPv4=/\b((?:(?:25[0-5]|2[0-4][0-9]|1[0-9][0-9]|[1-9]?[0-9])\.){3}(?:25[0-5]|2[0-4][0-9]|1[0-9][0-9]|[1-9]?[0-9]))\b/;
// IPv6
var rEIPv6=/\b([\da-fA-F]{1,4}(?:\:[\da-fA-F]{0,4}){2,6}[\da-fA-F]{1,4})\b/;
// MAC
var rEMAC=/\b((?:[\da-fA-F]{2}\:){5}[\da-fA-F]{2})\b/;
// SEL
var rESEL=/\b(SEL-.+)-R/;
try {
  procCSV(getOutput("Forescout_Information"));
} catch(ex) {
  print("ERROR: "+ex);
}
Select Save.
Navigate to Consoles > Add.
Enter a name and connection details for the Splunk server. Select Save.
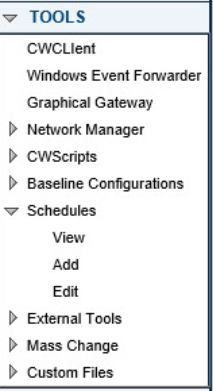
Navigate to Tools > Schedule. Click Add.
Name the schedule. Set the time to run at an acceptable interval (this build set the interval to repeat daily). Under CONSOLES + BASELINES, click Add.
Select the previously created Splunk console and the imported baseline configuration. Click the arrow. Click OK.
Click Save.
2.1.1.5 ConsoleWorks Configurations UMD
The following subsections document the software, hardware/VM, and network configurations for the ConsoleWorks server at UMD.
2.1.1.6 VM Configuration
The UMD ConsoleWorks VM is given the following resources:
Windows Server 2016
2 CPU cores
100 GB hard Disks
12 GB RAM
2 NIC
2.1.1.7 Network Configuration
Network Configuration (Interface 1):
DHCP: disabled
IPv6: ignore
IPv4: Manual
IPv4 address: 10.100.1.6
Netmask: 255.255.255.0
Network Configuration (Interface 2):
DHCP: disabled
IPv6: ignore
IPv4: Manual
IPv4 address: 172.16.2.82
Netmask: 255.255.255.248
2.1.1.8 Installation
Download the installation kit from the http://support.tditechnologies.com website. A username and password are required, so contact TDi Support at support@tditechnologies.com to request them.
Run the installer cw_server_<version>.exe.
Download the Splunk universal forwarder installer from the https://www.splunk.com/en_us/download/universal-forwarder.html website. A username and password are required. An account can be created on the Splunk website.
Use the splunkforwarder-<version>-x64-release.msi installer to install the Splunk Universal Forwarder on the machine running the ConsoleWorks.
Connect to the Console at https://10.100.1.6:5176. Log in using the default credentials.
Fill in the details for Registration. Click Register Online. Click Save.
Create a new user. Navigate on left to Users > Add.
Enter the name and password. Select Add.
.
Add CONSOLE_MANAGER as a selected profile, as shown in the screenshot below. Select OK.
Click Save.
2.1.1.9 Configuration
ConsoleWorks provides the scripts to query the Modbus server. The script provided is in XML format.
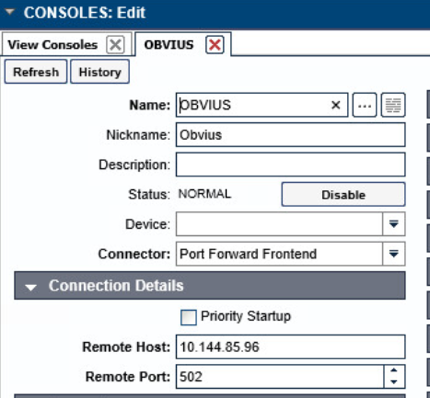
Navigate to Consoles > Add.
Enter a name and connection details that will be used to connect to the Obvius data acquisition server. Select Save.
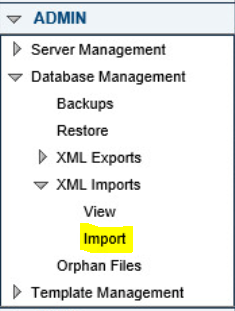
Navigate to Admin > Database Management > XML Imports > Import.
Select Upload a file, then click Next.

Click Browse, then find the XML file.
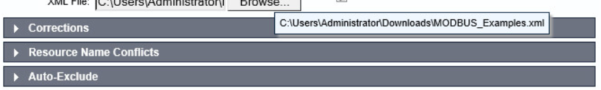
Click Next. ConsoleWorks will import the two CWScripts: UTIL_MODBUS and UTIL_MODBUS_GE.
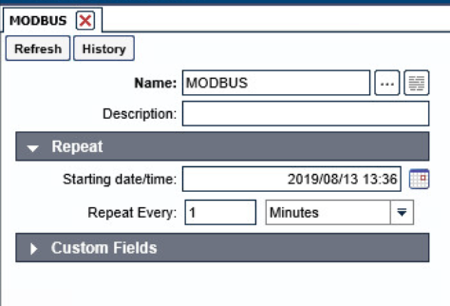
Navigate to Tools > Schedule. Click Add.
Name the schedule. Set the time to run at an acceptable interval, then save.
Navigate to Tools > Baseline Configurations > Add.
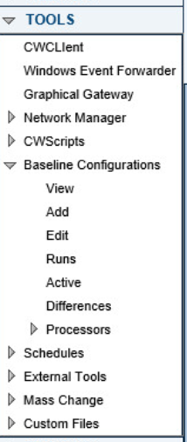
Name the baseline, and set the Profile to CONSOLE_MANAGER.

Create a Processor to collect the information from the OBVIUS server. Click Add under Processors.

Name the Processor, then click the highlighted button. Enter the text that follows, then click Save.
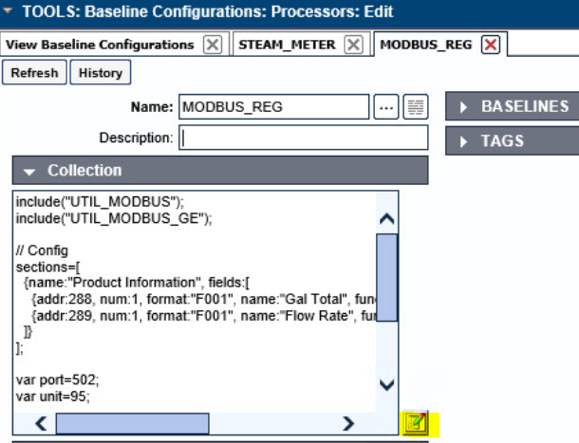
include("UTIL_MODBUS");
include("UTIL_MODBUS_GE");
// Config
sections=[
  {name:"Product Information", fields:[
    {addr:288, num:1, format:"F001", name:"Gal Total", functionName: readHoldingRegisters},
    {addr:289, num:1, format:"F001", name:"Flow Rate", functionName: readHoldingRegisters},
  ]}
];
var port=502;
var unit=95;
// Execute
var server=console.port;
for(var s=0;s<sections.length;s++) {
  setOutput(sections[s].name, formatGEOutput(modbusConnection(server, port, unit, sections[s].fields)));
  log("SPLUNK",formatGEOutput(modbusConnection(server, port, unit, sections[s].fields)));
}
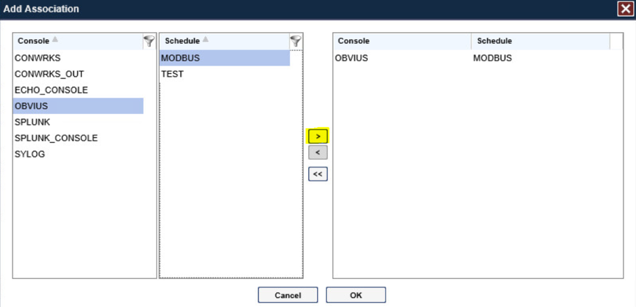
Return the Baseline Configuration, then under CONSOLE + SCHEDULES, select Add.
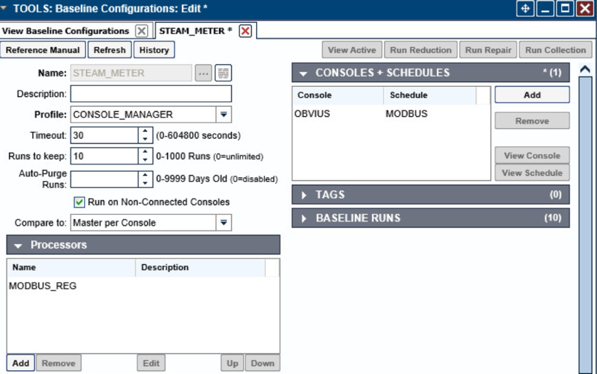
Under Console, select OBVIUS, and select MODBUS, then click >.
Create the SPLUNK console to log the collected Modbus registers at Console > Add.
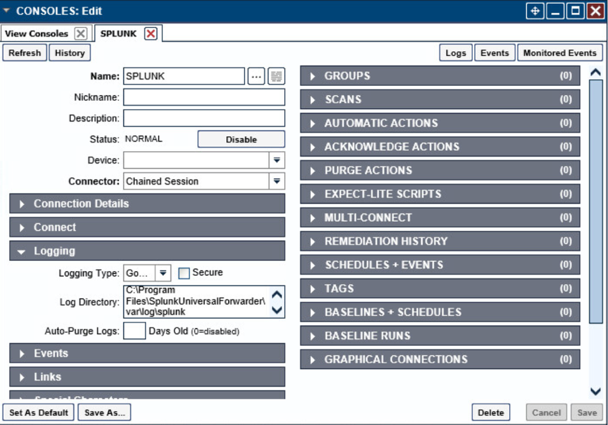
Name the Console, and set the connector to Chain Session, the log type to Governed, and the Log Directory to the below location:
C:\Program Files\SplunkUniversalForwarder\log\splunkNavigate to C:Program FilesSplunkUniversalForwarderetcsystemlocal\
Add the following lines to the outputs.conf file:
[tcpout:default-autolb-group]

server = 10.100.200.101:9997

[tcpout-server://10.100.200.101:9997]
Add the following lines to the inputs.conf file:
[monitor://$SPLUNK_HOME\var\log\splunk\SPLUNK.LOG*]

index = modbus
2.2 Forescout CounterACT
Forescout CounterACT is used as a data collection and inventory tool. The CounterACT appliance actively collects data from the ICS lab in Plano, Texas. The appliance reports back to the CounterACT Enterprise Manager on the enterprise network in Rockville, Maryland. Once installed, the appliance is configured and managed through the enterprise manager.
Forescout CounterACT can be deployed on virtual or physical appliances. For virtualized environments, VMware ESXi, Microsoft Hyper-V, and KVM hypervisors are supported. Large networks that require multiple physical or virtual appliances can be centrally managed by the Enterprise Manager.
https://www.forescout.com/platform/specifications/#virtual-appliance
Note: Some network-related information has been redacted.
2.2.1 CounterACT Enterprise Manager Configuration
2.2.1.1 VM Configuration
The CounterACT Enterprise Manager is configured as follows:
Red Hat Enterprise Linux 7
CPU cores
16 GB of RAM
200 GB of storage
1 NIC
2.2.1.2 Network
Network Configuration (Interface 1):
IPv4: Manual
IPv6: disabled
IPv4 address: 10.100.100.33
Netmask: 255.255.255.0
Gateway: 10.100.100.1
2.2.1.3 Installation
To install CounterACT Enterprise Manager, refer to the installation guide available at https://www.forescout.com/company/resources/forescout-installation-guide-8-1/.
2.2.1.4 Configuration
The following steps contain configuration instructions for scanning devices at the Plano location. For additional CounterACT configuration details, refer to the administration guide at https://www.forescout.com/wp-content/uploads/2018/11/counteract-administration-guide-8.0.1.pdf.
The CounterACT Enterprise Manager and CounterACT Appliance can be managed through the CounterACT console. Complete the following steps to install the console on a Windows desktop:
Download the executable from a Forescout portal.
Select the CounterACT Console Setup file. The CounterACT Console software download screen opens.
Select the download link required, and save the EXE file.
Select and run the file to begin the installation. The Setup Wizard opens. Select Next.
Use the default installation directory. Click Next.
Click Next.
The installation begins. When completed, click Finish.
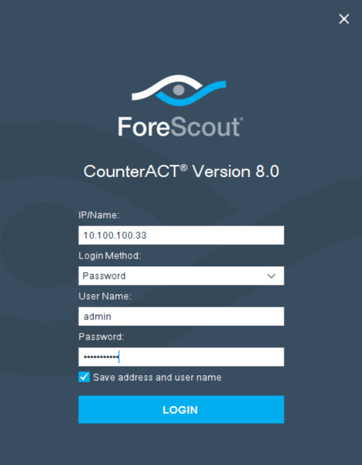
Connect to the Enterprise Manager with the Console and the password used during the CounterACT Enterprise Manager installation.
Select the gear icon in the top right of console.
Select Add.
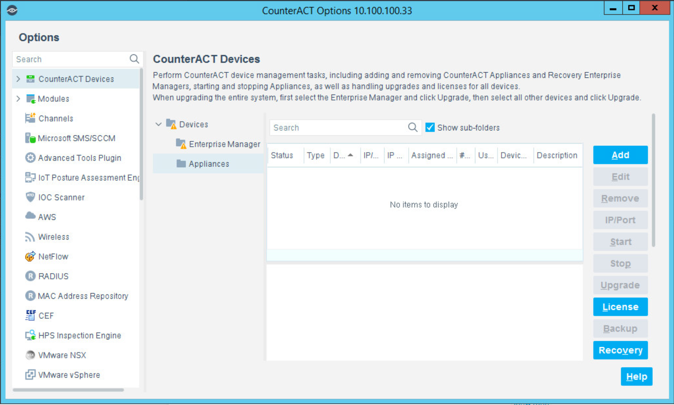
Enter the internet protocol (IP) address of the appliance, and the admin password used in setup.
Select OK.
Highlight the new appliance, and select License.
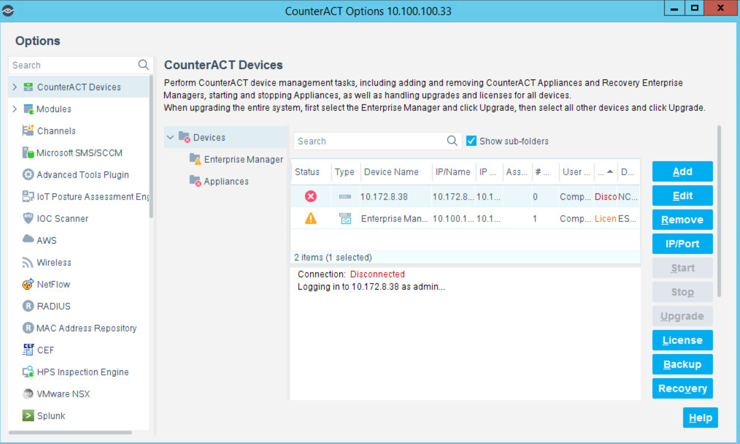
Enter the required information. Select Submit.
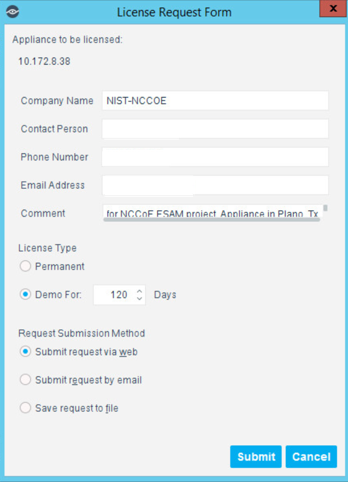
Select OK.
2.2.1.4.1 Appliance Interfaces Configurations
Under Options, highlight the appliance, and select Edit.
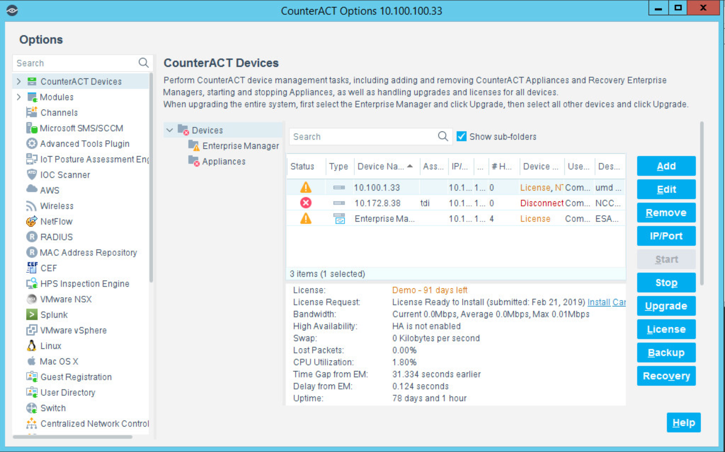
Select the Channels tab.
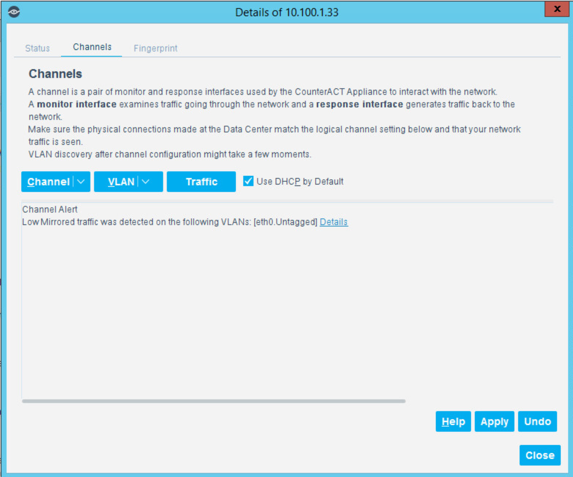
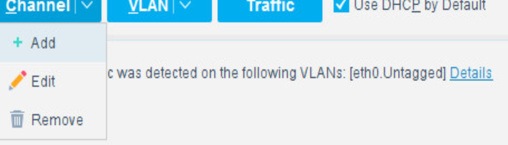
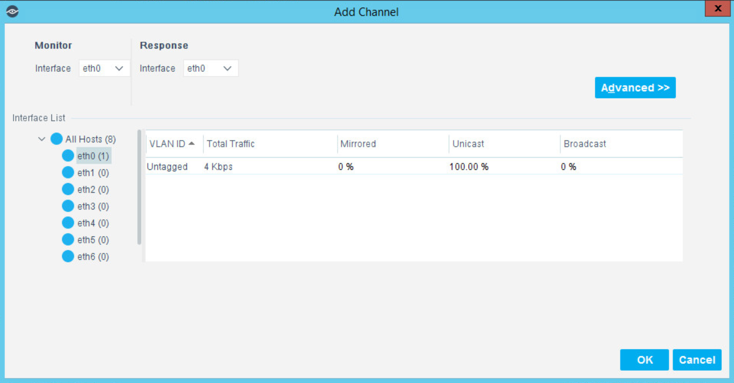
Under Channel, select Add.
Use the drop-down to select the interface listening on a switched port analyzer (SPAN) switch for both Monitor and Response. Select OK.
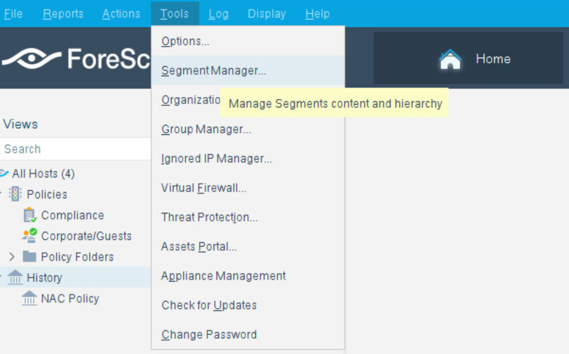
Under Tools, select Segment Manager.
Select the + to add and name two segments called In_Scope and Out_Scope. Click OK. These will indicate which IP range should be scanned and which should not be scanned.
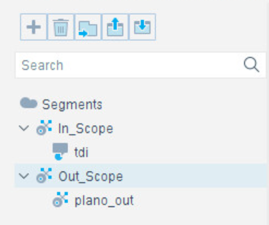
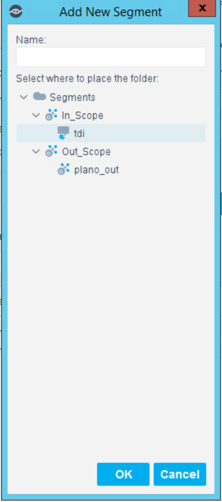
Select the plus icon again to add two subsegments shown in the screenshot below. Click OK.
Highlight the tdi segment. Click Add to add the range of IP addresses to scan. Click OK.
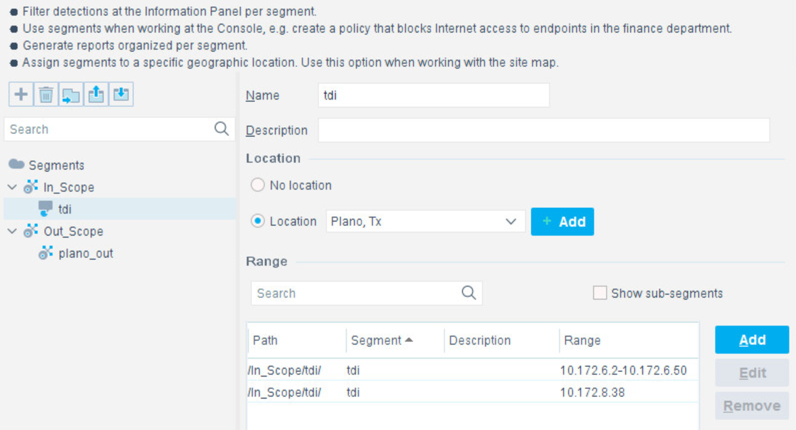
Repeat for the plano_out segment for IP address to not scan. Click OK.
2.2.1.4.2 Upload Network Scan Policies
Forescout network scan policies are prewritten and delivered as an XML file.
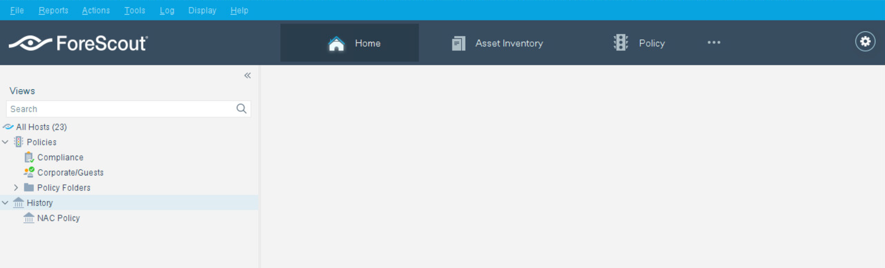
First, create a folder to house the polices. From the Enterprise Manager Console, select the Policy tab.
Select the plus icon to create a new folder.
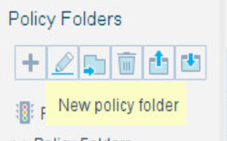
Name the folder. Click OK.
Select the import policy icon.
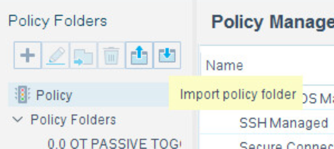
Select … to locate the XML file.
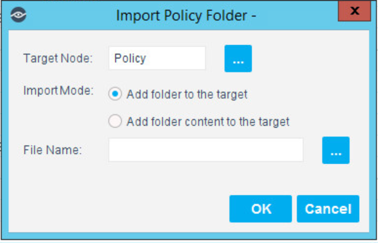
Select the XML file.
Select OK.
Repeat Steps 4 to 7 for each XML policy file.
Select Start. Select Apply to start and apply the changes.
2.2.1.4.3 Splunk Integration
To complete Forescout Integration with Splunk, follow Forescout documentation found at https://www.forescout.com/platform/forescout-app-guide-splunk-2-7-0 and https://www.forescout.com/company/resources/extended-module-for-splunk-configuration-guide-2-8/.
2.2.1.4.4 Schedule Reporting
From the Enterprise Manager Console, select the ellipsis next to Policy. Select Reports.
Log in using the same credentials as the Enterprise Manager Console.
Select Reports.
Select Add.
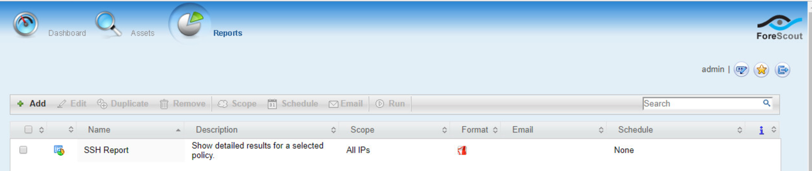
Select the Asset Inventory template. Click Next.
Name the report. Select the All IPs toggle.
Select only the Show host details.
Edit the host details to show the following properties:
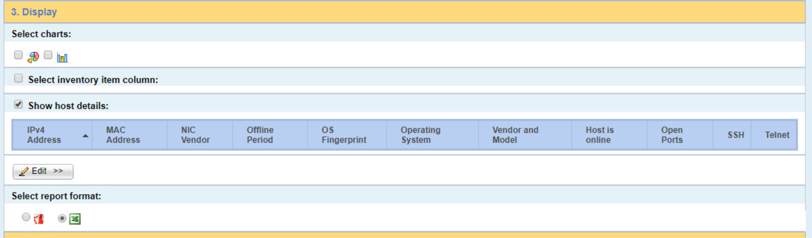
Set a schedule. Enter an email address. Select Save.
2.2.2 CounterACT Appliance Configuration
2.2.2.1 Host Configuration
The CounterACT Appliance is delivered on a Dell PowerEdge R640 server with version 8.0.0.
2.2.2.2 Network
Network Configuration (Interface 1):
IPv4: Manual
IPv6: disabled
IPv4 address: 10.172.8.38
Netmask: 255.255.255.0
Gateway: 10.172.8.1
2.2.2.3 Installation
To install the CounterACT Appliance, follow the installation steps found at https://www.forescout.com/wp-content/uploads/2018/10/CounterACT_Installation_Guide_8.0.1.pdf.
2.2.2.4 Configuration
After the CounterACT Appliance is installed, follow the steps outlined in Section 2.2.1, to connect the appliance to the enterprise manager and complete the configuration.
2.3 Dragos Platform
The Dragos Platform is an industrial control system cybersecurity-monitoring platform based around threat-behavior analytics. It is being used in this build to provide asset discovery and monitoring. A Dragos Sitestore is installed at the NCCoE enterprise site, and a midpoint sensor is installed at the Plano site. The Dragos sensor is managed by the site store.
2.3.1 Dragos Sitestore Configuration
In the example implementation, Dragos Sitestore is deployed as a pre-built appliance from the vendor. The appliance was still configured with parameters necessary for our environment. Connect to the Dragos appliance by navigating the web browser to https://<IP address>.
2.3.1.1 Host Configuration
The Dragos Platform is delivered to the customer, preconfigured for the environment. The NCCoE received a Dell server utilizing iDRAC for virtualization. On the iDRAC server, VMware ESXi was installed and utilized for creating the server.
The VMs created to house the product have the following specifications:
Operating system (OS) Version: CentOS 7 (64-bit)
CPU: 48 cores
Memory: 192 GB
Hard disc drive (HDD) 1: 200 GB
HDD 2: 10 terabytes (TB)
2.3.1.2 Network
Networking for the device included a single network within ESXi to which the VM was connected. The Dell iDRAC server housing the Dragos Sitestore Puppet Server was connected to the ESAM network with the following IP addresses:
iDRAC: 10.100.200.6
ESXi: 10.100.200.7
Dragos Sitestore Puppet: 10.100.200.8
2.3.1.3 Installation
Installation began with setting up a VM. Utilizing the specifications in Section 2.3.1.1, Host Configuration, a VM was created for the Sitestore/Puppet server. Then the product ISO was added to the CD/DVD Drive 1 location (DragosCustom-2019-06-18-CentOS-7-x86_64-Everything-1810.iso).
Power on the VM, and open a console. The Dragos installation screen will start, allowing options to be selected for installation type.
With the Dell R730 server used for the NCCoE, select Install Dragos Sitestore Kickstart. The installer automatically installs the Dragos Platform without interaction from the user.
2.3.1.4 Configuration
Once the installation has completed, the Sitestore will be configured with the needed files listed in Table 2-1.
Table 2-1 Dragos Required Files
Dragos Files |
|
|---|---|
sitestore-orchestration-1.5.1.1-1.noarch.rpm.gpg |
midpoint-images-1.5.1.1-1.x86_64.rpm.gpg |
midpoint-configs-1.5.1.1-1.x86_64.rpm.gpg |
midpoint-manager-1.1.2-1.el7.x86_64.rpm.gpg |
midpoint-1.5.1.1-1.x86_64.rpm.gpg |
mms-cli-1.1.0-1.x86_64.rpm.gpg |
upgrade-1.5.1-3.tar.gz.gpg |
containerd.io-1.2.0-3.el7.x86_64.rpm |
container-selinux-2.68-1.el7.noarch.rpm |
docker-ce-18.09.0-3.el7.x86_64.rpm |
docker-ce-cli-18.09.0-3.el7.x86_64.rpm |
Upload these files to the Sitestore VM in /var/opt/releases/.
Change directory to /var/opt/releases/ and run the command
gpg --decrypt-file *.gpg. Enter the password supplied from Dragos for the installation. This will create all the files required for the installation.Change directory to /root/ and, as root user, run
./puppet_server_setup.sh
2.3.2 Dragos Midpoint Sensor
Dragos Midpoint Sensor is also deployed as a pre-built appliance from the vendor. Options for the midpoint sensor consist of configurations for small, medium, and large deployments. The appliance is configured with parameters necessary for our environment. The Dragos Midpoint Sensor can be managed from the Sitestore.
2.3.2.1 Network
The midpoint sensor has multiple interfaces. One interface will collect traffic via SPAN port. Another will serve as the management interface to communicate with the device.
Dragos Midpoint Sensor Management Interface:
DHCP: disabled
IPv6: ignore
IPv4: Manual
IPv4 address: 10.172.6.10
Netmask: 255.255.255.0
2.3.2.2 Configuration
After the midpoint sensor is deployed and listening on the correct interface, the midpoint sensor can connect back to the Sitestore for further configurations.
2.3.3 Dragos Splunk Integration
The Dragos Splunk application allows data integration from the Dragos Sitestore into the Splunk dashboard. This allows Splunk to aggregate data from Dragos and other products into a central location for analyst visualization. This process assumes the reader has downloaded the Dragos Splunk application from https://splunkbase.splunk.com/app/4601/.
To begin, log in to the Splunk instance, and select the gear icon on the top left of the screen next to Apps, to configure the applications.
On the top right of the screen, select Install app from the file.
Follow the on-screen instructions to upload the downloaded application.
Restart Splunk (either prompted by the installation process or self-directed).
From the Splunk Settings menu on the top right, select the Data Inputs option.
Select Add New under Local Inputs for a transmission control protocol (TCP) listener. (User datagram protocol [UDP] is not recommended, because it will cut off longer messages.)
Set the port to the one that you want to transfer data on. (NCCoE build used 10514.)
Select Next to configure the Input Settings.
Choose dragos_alert as the source type.
Set the App Context to Dragos Splunk App.
Set the Index to dragos_alerts. (Create a new index if it does not exist.)
Click Submit.
Once this process is completed, Splunk is ready to receive data from Dragos. The following instructions will be for configuring the Dragos Sitestore for sending information to Splunk:
Navigate to the Servers tab at https://<sitestore>/syslog/app/#/servers.
Click + Add Server to create a new server.
Configure the connection information to point to the Splunk server configured previously.
Set the following options:
Protocol: TCP
Message Format: RFC 5424 Modern Syslog
Message Delimiter: Use newline delimiter for TCP and transport layer security (TLS) streams.
Click NEXT: SET TEMPLATE.
Set the following value (must be on one line for Splunk to properly process) as Message:
{ "app": "dragos:platform", "body": "${content}", "category": "${summary}", "created_at": "#{createdAt}", "dest": "${dest_asset_ip}",

"dest_dragos_id": "${dest_asset_id}", "dest_host":

"${dest_asset_hostname}", "dest_ip": "${dest_asset_ip}", "dest_mac":

"${dest_asset_mac}", "dest_name": "${dest_asset_domain}",

"dragos_detection_quad": "${detection_quad}", "dragos_detector_id":

"${detector_id}", "dvc": "${asset_ip}", "dvc_dragos_id":

"${dest_asset_id}", "dvc_host": "${dest_asset_hostname}", "dvc_ip":

"${asset_ip}", "dvc_mac": "${dest_asset_mac}", "dvc_name":

"${dest_asset_domain}", "id": "${id}", "ids_type": "network",

"occurred_at": "#{occurredAt}", "severity_id": "${severity}",

"signature": "${source}", "src": "${src_asset_ip}", "src_dragos_id":

"${src_asset_id}", "src_host": "${src_asset_hostname}", "src_ip":

"${src_asset_ip}", "src_mac": "${src_asset_mac}", "src_name":

"${src_asset_domain}", "subject": "${type}", "type": "alert",

"vendor_product": "Dragos Platform" }
Select Save.
2.4 FoxGuard Patch and Update Management Program
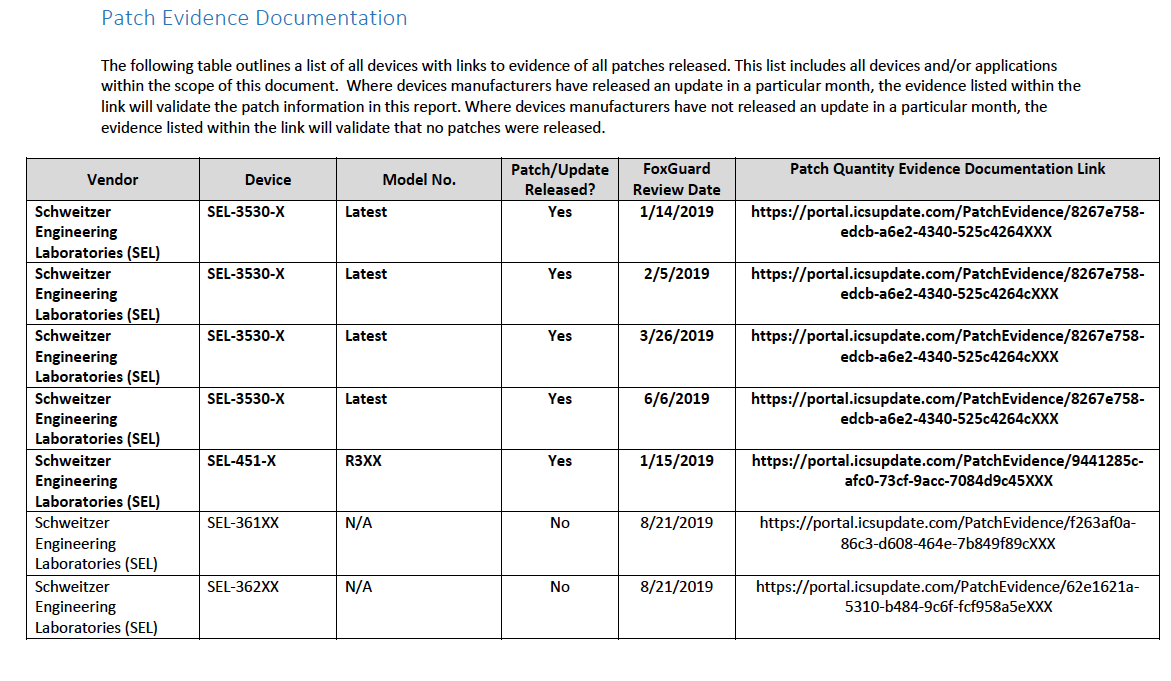
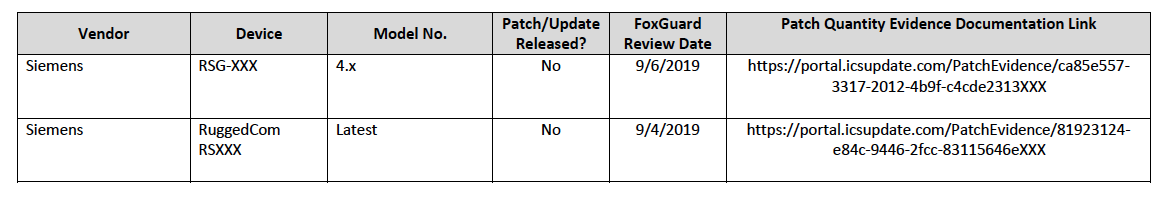
The solution utilizes the FoxGuard PUMP to provide patch availability and vulnerability notifications for identified assets. For this build, ConsoleWorks collects asset data from Splunk then converts that data into the JavaScript object notation (JSON) format required for PUMP. The resulting JSON file includes asset information such as vendor, product, and version, as well as serial and model information about devices from the asset inventory. Asset data often contains critical details. However, PUMP does not require sensitive data, such as asset location and IP address. The file is encrypted and provided to the PUMP team via secure delivery. FoxGuard’s preferred method of file transfer is secure file transfer protocol and does not require direct access to an entities network.
Once the asset data is received, the FoxGuard team analyzes the file for completeness. Any missing data, such as a serial number, version, or access to private patch data, is collected during the onboarding process with the end user. The final report is provided back to ConsoleWorks in a JSON file format and includes available patches and vulnerability notifications for each device. The data is then ingested back into Splunk for viewing and reporting. Reports are also available outside of the ConsoleWorks integration in portable document format (PDF) and comma separated value (CSV) format.
PUMP is a service managed by the FoxGuard team. The patch availability and vulnerability notification report does not require an installation. See Section 2.1 for configuring ConsoleWorks to automatically create the required JSON input file for the integration described in this guide.
2.4.1 Patch Report
Below are screenshots from the final patch report for this build.
Figure 2-1 Update Availability Summary
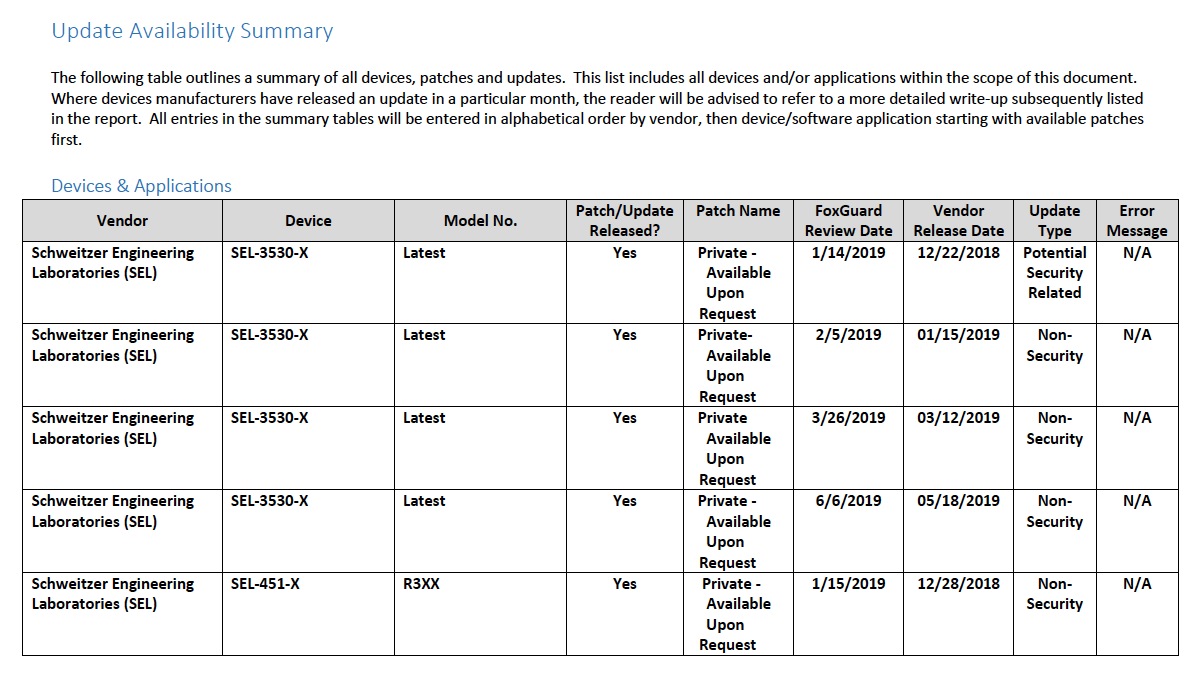
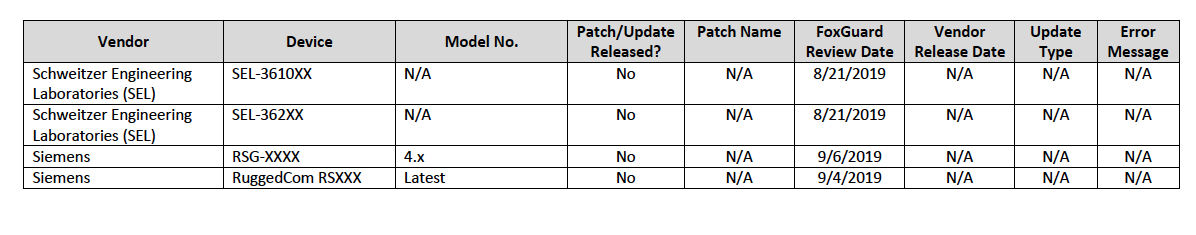
Figure 2-2 Device Update Availability Details-1
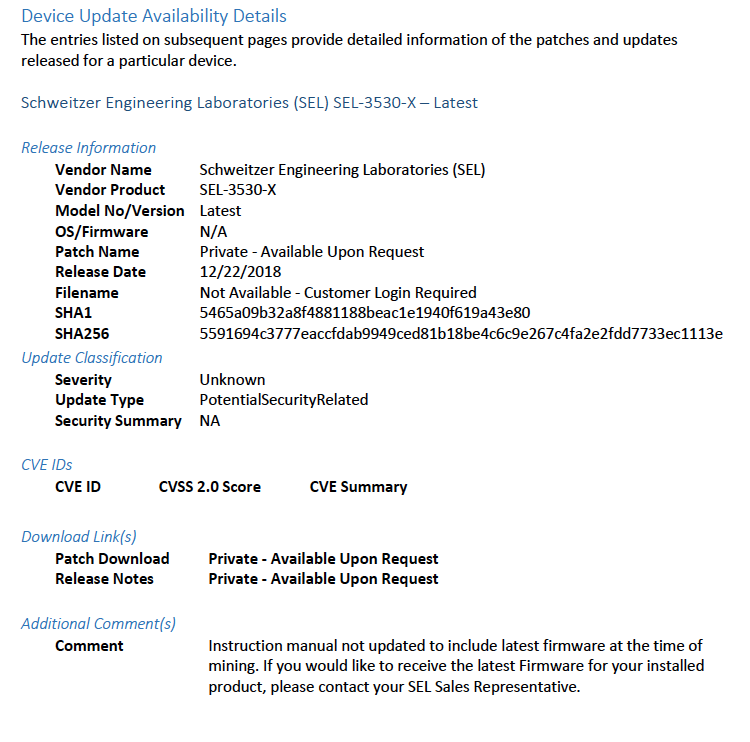
Figure 2-3 Device Update Availability Details-2
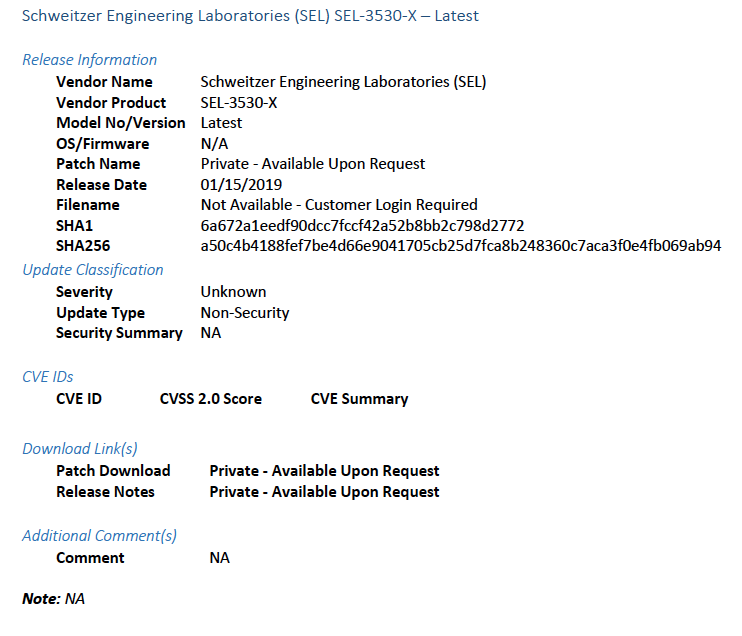
Figure 2-4 Device Update Availability Details-3
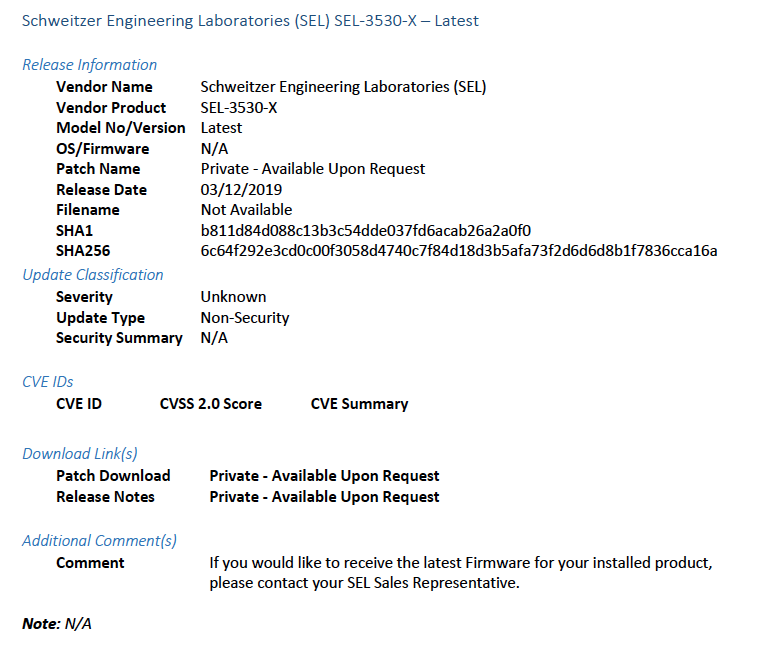
Figure 2-5 Device Update Availability Details-4
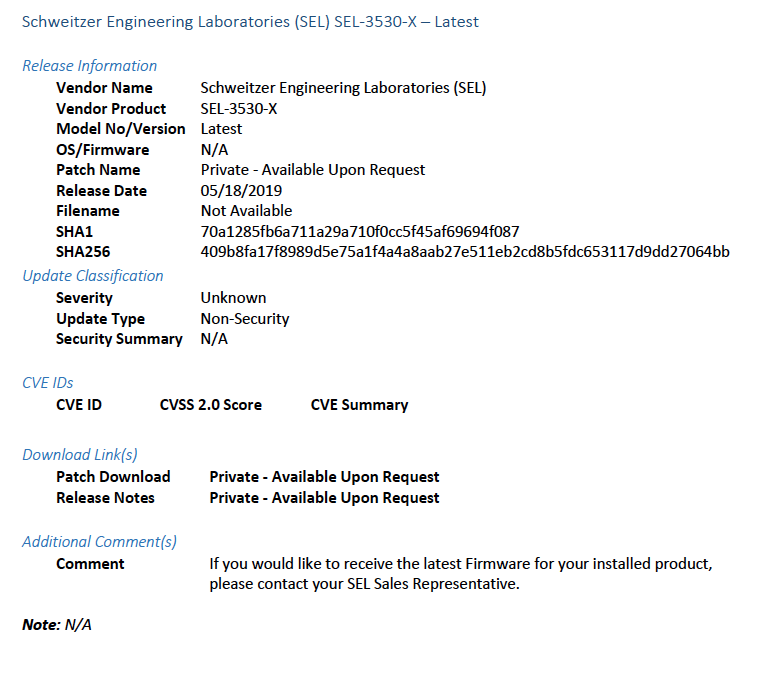
Figure 2-6 Device Update Availability Details-5
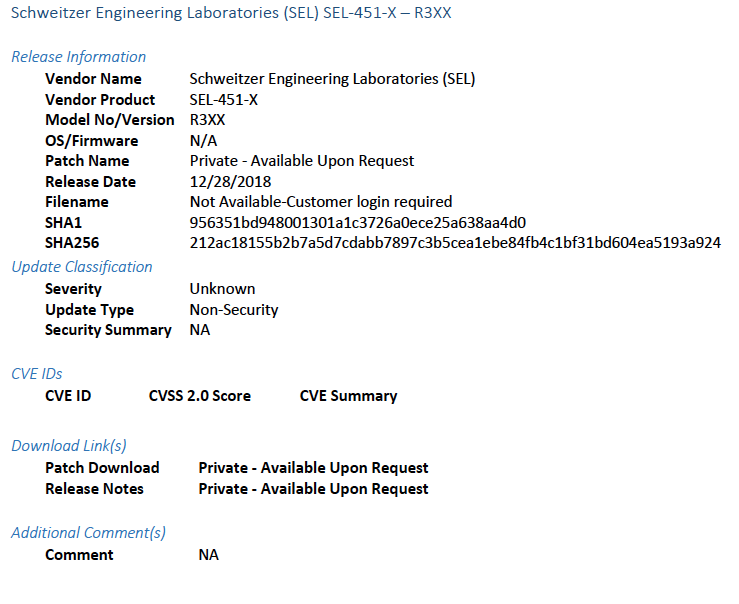
Figure 2-7 Patch Evidence Documentation
2.5 Kore Wireless
This solution leverages a Kore Wireless virtual private network (VPN) to provide secure remote access to remote assets. In this case, the remote asset is an Obvius A8812 Data Acquisition Server that provides access to data from a Yokogawa flow meter.
Note: Some network information is excluded for security.
2.5.1 Bridge Configuration
2.5.1.1 Installation
Connect the MultiConnect eCell Ethernet port to the Ethernet port on the Obvius A8812 Data Acquisition Server.
Connect the Obvius A8812 RS485 to the multidrop Modbus network with the remote steam meter asset.
2.5.1.2 Network
Set Obvius A8812 to DHCP.
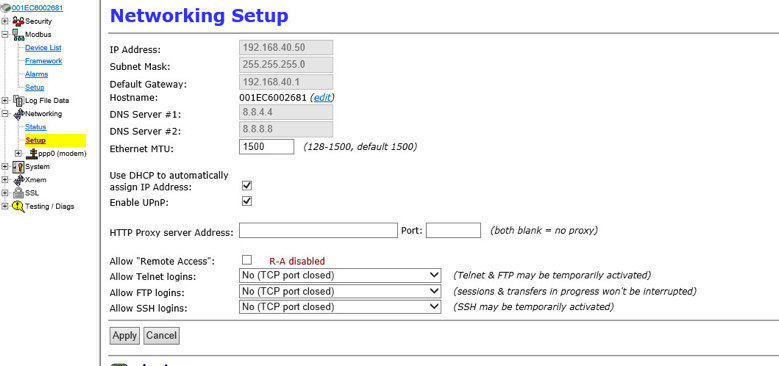
Navigate the IP address of the Obvius A8812. Default is 192.168.40.50.
Open the Networking drop-down menu, and select Setup.
Check the Use DHCP to automatically assign IP Address checkbox.
Set MultiConnect eCell to Auto-detect Dialup profiles.
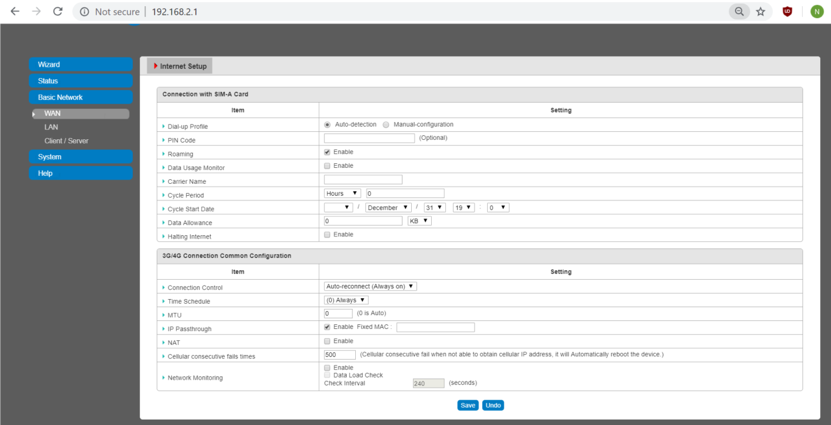
Navigate the IP address of the MultiConnect eCell. Default is 192.168.40.50.
Open the WAN menu.
Set the Dial-up Profile to Auto-detection.
2.5.2 Virtual Private Network Configuration
Navigate to VPN > IPsec in pfsense.
Click the Add P1 button.
Set Remote Gateway.
Set Authentication Method to
Mutual PSK.Set Pre-Shared Key.
Set Encryption Algorithm settings:
Algorithm:
AESKey Length:
256 bitsHash:
SHA256Diffie-Hellman Group:
2 (1024 bit)
Return to VPN > IPsec.
Click the Add P2 button.
Set Local Network to
172.16.2.80/29.Set Remote Network.
Set Protocol to
ESP.Set Encryption Algorithm to
AE 256 bits.Set Hash Algorithm to
SHA256.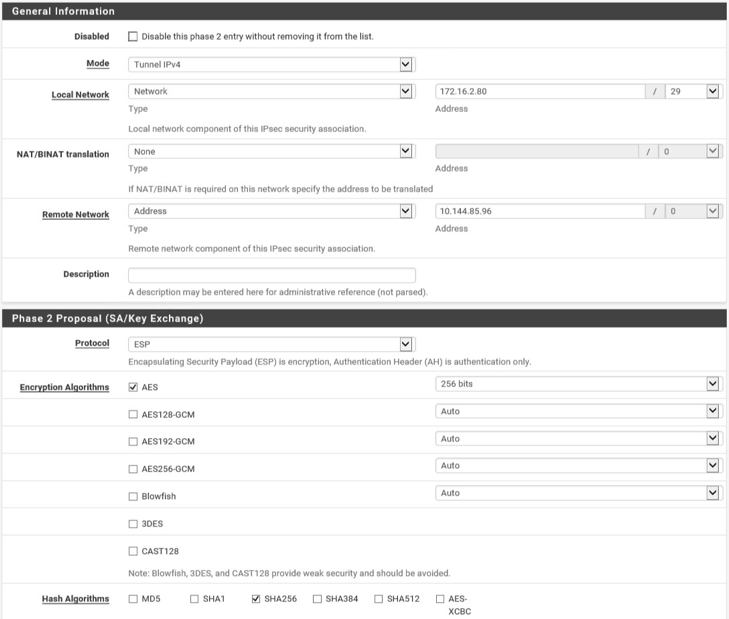
2.6 pfSense VPN
pfSense is an open-source firewall/router used to create both site-to-site VPN tunnels. The following configuration file can be used to upload all configurations to the enterprise location edge router. Both the UMD and Plano edge routers are excluded for security purposes.
2.6.1 Plano and UMD VPN Configuration
To configure a site-to-site OpenVPN connection, refer to https://docs.netgate.com/pfsense/en/latest/vpn/openvpn/index.html.
2.7 Splunk
Splunk is a security information and event management (SIEM) system that allows collecting and parsing logs and data from multiple systems.
2.7.1 Splunk Enterprise Configuration
2.7.1.1 VM Configuration
The Splunk VM is configured as follows:
Ubuntu Mate 16.04.2
2 CPU cores
10 GB of RAM
2 TB of storage
1 NIC
2.7.1.2 Network
Network Configuration (Interface 1):
IPv4: Manual
IPv6: disabled
IPv4 address: 10.100.200.101
Netmask: 255.255.255.0
Gateway: 10.100.200.1
2.7.1.3 Installation
Note: A Splunk account will be needed to download Splunk Enterprise. The account is free and can be set up at https://www.splunk.com/page/sign_up.
Download Splunk Enterprise from https://www.splunk.com/en_us/download/splunk-enterprise.html. This build uses Version 7.1.3. Splunk can be installed on Windows, Linux, Solaris, and Mac OS X. Each of these installation instructions is provided at http://docs.splunk.com/Documentation/Splunk/7.1.3/Installation/Beforeyouinstall.
2.7.1.4 Universal Forwarder
To install the universal forwarder, refer to documentation found at https://docs.splunk.com/Documentation/Forwarder/7.3.1/Forwarder/Installtheuniversalforwardersoftware.
Refer to each individual product to configure the universal forwarder or another means of integration with Splunk.
2.7.1.5 Reports and Alerts
If desired, lookup tables can be used to cross-check automated detections with human knowledge of a device. Some properties are cross-checked with human knowledge at both the UMD and Plano sites. Patch information from PUMP also uses a lookup table to cross-check results with devices. To upload lookup tables:
Log in to Splunk.
Go to Settings > Lookups.
Select + Add New under Lookup table files.
Choose Search as the Destination App.
Browse for the CSV file. Name the Lookup file. Select Save.
The UMD lookup CSV file contains the following fields:
Asset Id,IP,Device,Platform
The Plano lookup CSV file contains the following fields:
Asset Id,IP,Vendor,Product Name,Serial Number,Version
Once integrations are complete, the following Splunk queries will create the desired reports:
2.7.1.5.1 Asset Report for Both Sites
index=_* OR index=* sourcetype=CTD_csv | table asset_id site_id name_ ip_ mac_ type_
vendor_ criticality_ risk_level is_ghost | sort site_id | where isnum(asset_id)
2.7.1.5.2 Asset Report for UMD
index=_* OR index=* sourcetype=CTD_csv | where isnum(asset_id)  | table asset_id
site_id name_ ip_ mac_ type_ vendor_ criticality_ risk_level is_ghost Device Platform
| sort site_id | search ip_=206.189.122* | lookup umd_lookup.csv "Asset Id" AS
asset_id OUTPUT "Device" AS Device, Platform AS Platform
2.7.1.5.3 Asset Report for Plano (Static)
index=_* OR index=* sourcetype=CTD_csv | where isnum(asset_id)  | table asset_id
site_id name_ ip_ mac_ type_ vendor_ criticality_ risk_level is_ghost
Serial_Number Version | sort site_id | search ip_=10.172.6* | lookup plano_lookup.csv "Asset Id" AS
asset_id OUTPUT "Serial Number" AS Serial_Number, Version AS Version
2.7.1.5.4 Asset Report for Plano (Dynamic)
index=forescout

|table ip mac "host_properties.nmap_banner7{}.value" nbthost "host_properties.nmap_def_fp5{}.value" "host_properties.user_def_fp{}.value"
"host_properties.server_session{}.value"

|stats
values(mac),values("host_properties.nmap_banner7{}.value"),values(nbthost),values("host_properties.nmap_def_fp5{}.value"),values("host_properties.user_def_fp{}.value"),values("host_properties.server_session{}.value")
by ip

|rename values(mac) as mac_address, values(host_properties.nmap_banner7{}.value) as ports_and_services, values(nbthost) as hostname,
values(host_properties.nmap_def_fp5{}.value) as device_footprints, values(host_properties.user_def_fp{}.value) as device_footprints2,
values(host_properties.server_session{}.value) as server_session_properties
2.7.1.5.5 UMD Steam Meter Data
index=modbus |rex "CWScript BCM:(?<name>.\w+)" | rex field=_raw "Flow Rate :
(?<flowRate>.*)" | rex field=_raw "Gal Total : (?<GalTotal>.*)" | transaction
maxspan=30s | table name _time flowRate GalTotal
2.7.1.5.6 UMD Device Data Calls
(index=* OR index=_*) (index=main host="10.100.100.111" NOT "cs2=UP") | table shost
src smac dhost dst dmac cs6 cs3 cs7 cs8 msg
2.7.1.5.7 Patch Report for FoxGuard PUMP
index=test sourcetype="csv" | lookup plano_lookup.csv "Asset Id" AS Asset_Id OUTPUT
"Serial Number" AS Serial_Number, Version AS Version | table Asset_Id IP Mac Vendor
"Operating System" Serial_Number Version Criticality Protocols | join IP type=left
[search index=test sourcetype=CTD_csv_report] | fields "Asset Id" IP Mac Vendor
"Operating System" Serial_Number Version | where isnotnull(Serial_Number) OR
isnotnull(Version) | sort IP | outputcsv patchreport.csv
2.8 Tripwire Industrial Visibility
Tripwire Industrial Visibility is used to passively scan the industrial control environments at both the College Park and Plano locations in the build. Tripwire Industrial Visibility builds a baseline of assets and network traffic between those assets then alerts on anomalous activity. Logs and alerts are reported up to the SIEM.
Tripwire Industrial Visibility is installed at three locations: Plano, Texas (TDi); UMD; and the NCCoE. This section describes how to deploy Tripwire Industrial Visibility 3.0.0.
Tripwire Industrial Visibility taps into OT network communication by listening through the SPAN port of routers and switches connected to the network segment, opening data packets, and interpreting protocols without disrupting normal operations.
By reading network traffic, it isolates all assets on the network and maps the flow of traffic between them. This data is then used to create graphical network maps.
2.8.1 Tripwire Industrial Visibility Configuration UMD
The following subsections document the software, hardware/VM, and network configurations for the Tripwire Industrial Visibility servers.
2.8.1.1 VM Configuration
The Tripwire Industrial Visibility VM was given the following resources:
CentOS 7.5
4 CPU cores
100 GB hard disk
32 GB RAM
2 NICs
2.8.1.2 Network Configuration
Network Configuration:
DHCP: disabled
IPv6: ignore
IPv4: Manual
IPv4 address: 10.100.100.111
Netmask: 255.255.255.0
Gateway: 10.100.100.1
2.8.1.3 Installation
Tripwire supplied the Tripwire Industrial Visibility as an ISO installer. To configure TIV, use the ISO installer for each instance at Plano, UMD, and the NCCoE. Tripwire Industrial Visibility is configured in a sensor-server architecture. Plano and UMD instances act as sensors, and the NCCoE instance is the central server.
To begin installation, mount the provided image to the VM, and complete the following steps:
From the boot menu, select Install Continuous Threat Detection.
When the system is up, navigate to the configurator tool by using a browser.
2.8.1.4 Configuration
Configure the Tripwire Industrial Visibility sensors.
Connect to the configuration tool by entering the following URL into the browser: https://10.100.100.11:5001.
Enter the default credentials.
On the Configuration tab, the system will need to be initialized. Select Bootstrap Sensor (for Plan and UMD sites).
Enter the details and License Key. Select Apply.
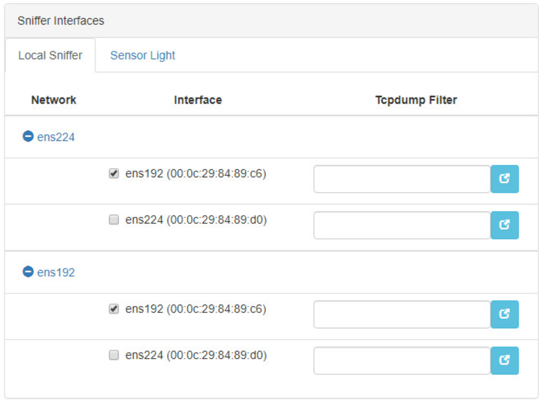
Set the Sniffer Interface on the Configuration tab. Select the interfaced used as the SPAN port. Select Apply.
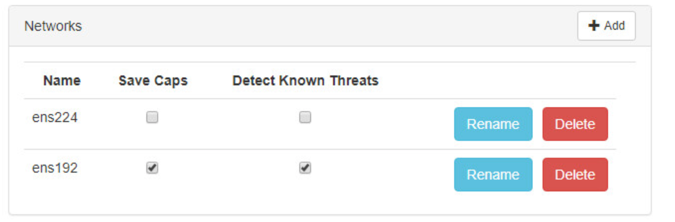
Under Networks, select Save Caps and Detect Known Threats for the appropriate interface.
Next, Join the Sensor to the Sensor Server. Set up the Central Server in Section 2.8.3 before completing these steps.
Select Join Central, from the Configuration tab.
Name the Sensor, and enter the IP address of the Central Server. Enter the Bootstrap password found on the Central Server. Select Join.
Connect to the continuous threat detection (CTD) Dashboard: https://10.100.1.17:5000.
The system is started in Training Mode. After an acceptable amount of time passes, place the system in Operational Mode. This build used one month as the training period.
Select the hamburger icon in the top left corner.

Scroll down to select Configuration.
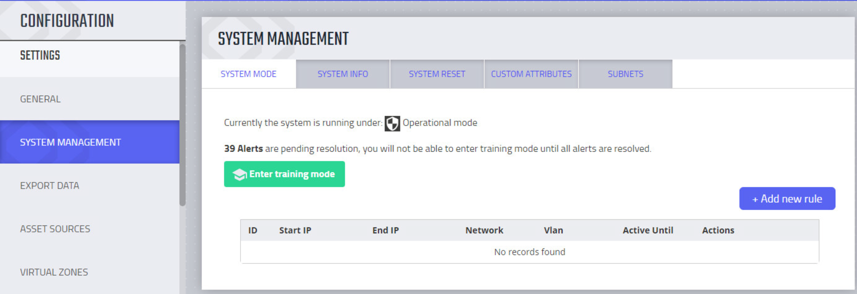
Select System Management.
Select the System Mode tab. Click Enter Operational Mode. Note: The screen will show Enter Training Mode, if the system is already in Operational Mode.
Select the Subnets tab. Click Add Tag.
Name a new Tag, and add the description. Select OK.
Click Add Subnet. Enter the Subnet that the assets are on and the previously created TAG. Select OK.
Repeat Steps 16 and 17 for multiple subnets.
2.8.2 Tripwire Industrial Visibility Configuration Plano
The following subsections document the software, hardware/VM, and network configurations for the Tripwire Industrial Visibility servers.
2.8.2.1 VM Configuration
The Tripwire Industrial Visibility VM was given the following resources:
CentOS 7.5
1 CPU Core
8 GB RAM
200 GB hard disk
3 NICs
2.8.2.2 Network Configuration
Network Configuration:
DHCP: disabled
IPv6: ignore
IPv4: Manual
IPv4 address: 10.100.100.111
Netmask: 255.255.255.0
Gateway: 10.100.100.1
2.8.2.3 Installation
Repeat steps in Section 2.8.1.3.
2.8.2.4 Configurations
Repeat steps in Section 2.8.1.4.
2.8.3 Tripwire Industrial Visibility Configuration National Cybersecurity Center of Excellence
Tripwire Industrial Visibility at the NCCoE serves as the central server.
2.8.3.1 VM Configuration
The Tripwire Industrial Visibility VM was given the following resources:
CentOS 7.5
4 CPU cores
80 GB hard disk
32 GB RAM
1 NIC
2.8.3.2 Network Configuration
Network Configuration:
DHCP: disabled
IPv6: ignore
IPv4: Manual
IPv4 address: 10.100.100.111
Netmask: 255.255.255.0
Gateway: 10.100.100.1
2.8.3.3 Installation
Repeat steps in Section 2.8.1.3.
2.8.3.4 Configurations
Repeat Steps 1–4 in Section 2.8.1.4.
In Step 3, select Bootstrap Central.
To complete the configuration: set up syslog, schedule a report, and install the Claroty application on Splunk.
Connect to the CTD Dashboard: https://10.100.100.1111:5000.
Select the hamburger menu in the top left corner.
Scroll down to select Configuration.
Select Syslog. Select Add.
Uncheck Local. Do not Select a Site.
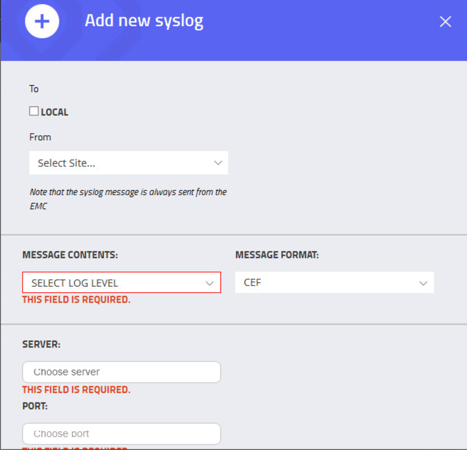
Select Alerts for the Log Level. Enter the IP address for the Splunk server under Server. Enter Port
515and ProtocolUDP. Select all boxes under Category and all boxes under Type. Leave the System URL and the Message Format as the default.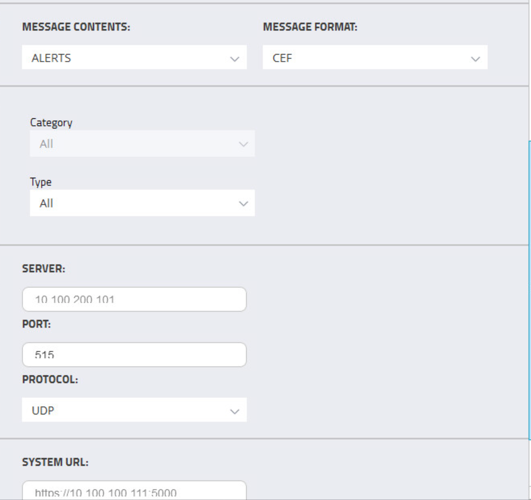
Select Save.
Select Add to add another.
Select Baselines under Message Contents.
Enter the Splunk IP for Server, Port
515, and ProtocolUDP. Leave System URL as the default. Click Save.Select Add to add another.
Select EVENTS for Message Contents. Enter the Splunk IP for Server, Port
515, and ProtocolUDP. Leave the System URL as default.Click Save.
To configure Asset Reporting, select Assets from the hamburger menu.
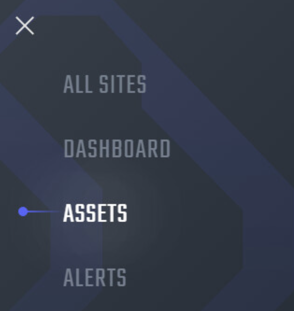
From the Assets list, select the report icon in the menu bar, to schedule a report.
Name the report, and select CSV as the Format. Enter a recipient to receive and download the report. Schedule the report to run at an acceptable interval. This build scheduled the report to run daily. Click Create.
2.8.3.5 Tripwire Splunk Integration
To integrate Tripwire with Splunk, install the Claroty Continuous Detection Application for Splunk. Additionally, install the Splunk Universal Forwarder to forward the CSV report.
Download the Claroty Continuous Detection Application for Splunk from https://splunkbase.splunk.com/app/4529/.
Log in to Splunk.
On the Apps menu, click Manage Apps.
Click Install app from file.
In the Upload app window, click Choose File.
Locate the downloaded .tar.gz file, and then click Open or Choose.
Click Upload.
Click Restart Splunk, and then confirm the restart.
To install Splunk Universal Forwarder, follow the steps in Section 2.7.1.4.
Place the following text in the /opt/splunkforwarder/etc/system/local/outputs.conf file:
[tcpout]

defaultGroup = default-autolb-group

[tcpout:default-autolb-group]

Server = 10.100.200.101:9997

[tcpout-server://10.100.200.101:9997]
Place the following text in the /opt/splunkforwarder/etc/system/local/deploymentclient.conf file:
[target-broker:deploymentserver]targetURI = 10.100.200.101:8089Log in to Splunk. Go to Settings > Data Inputs > Files & Directories.
Select New Remote File & Directory.
Select the host on which the forwarder is installed. Name the Server Class. Click Next.
Input the CSV file to monitor, i.e., /home/esam/attachments/report.csv.
Select Next.
Select Review.
Select Submit.