NIST SPECIAL PUBLICATION 1800-31C
Improving Enterprise Patching for General IT Systems:
Utilizing Existing Tools and Performing Processes in Better Ways
Volume C:
How-to Guides
Tyler Diamond*
Alper Kerman
Murugiah Souppaya
National Cybersecurity Center of Excellence
Information Technology Laboratory
Brian Johnson
Chris Peloquin
Vanessa Ruffin
The MITRE Corporation
McLean, Virginia
Karen Scarfone
Scarfone Cybersecurity
Clifton, Virginia
*Former employee; all work for this publication was done while at employer
April 2022
FINAL
This publication is available free of charge from https://doi.org/10.6028/NIST.SP.1800-31
The draft publication is available free of charge from https://www.nccoe.nist.gov/publications/practice-guide/nist-sp-1800-31-improving-enterprise-patching-general-it-systems-draft

DISCLAIMER
Certain commercial entities, equipment, products, or materials may be identified by name or company logo or other insignia in order to acknowledge their participation in this collaboration or to describe an experimental procedure or concept adequately. Such identification is not intended to imply special status or relationship with NIST or recommendation or endorsement by NIST or NCCoE; neither is it intended to imply that the entities, equipment, products, or materials are necessarily the best available for the purpose.
While NIST and the NCCoE address goals of improving management of cybersecurity and privacy risk through outreach and application of standards and best practices, it is the stakeholder’s responsibility to fully perform a risk assessment to include the current threat, vulnerabilities, likelihood of a compromise, and the impact should the threat be realized before adopting cybersecurity measures such as this recommendation.
National Institute of Standards and Technology Special Publication 1800-31C, Natl. Inst. Stand. Technol. Spec. Publ. 1800-31C, 128 pages, (April 2022), CODEN: NSPUE2
FEEDBACK
As a private-public partnership, we are always seeking feedback on our practice guides. We are particularly interested in seeing how businesses apply NCCoE reference designs in the real world. If you have implemented the reference design, or have questions about applying it in your environment, please email us at cyberhygiene@nist.gov.
All comments are subject to release under the Freedom of Information Act.
NATIONAL CYBERSECURITY CENTER OF EXCELLENCE
The National Cybersecurity Center of Excellence (NCCoE), a part of the National Institute of Standards and Technology (NIST), is a collaborative hub where industry organizations, government agencies, and academic institutions work together to address businesses’ most pressing cybersecurity issues. This public-private partnership enables the creation of practical cybersecurity solutions for specific industries, as well as for broad, cross-sector technology challenges. Through consortia under Cooperative Research and Development Agreements (CRADAs), including technology partners—from Fortune 50 market leaders to smaller companies specializing in information technology security—the NCCoE applies standards and best practices to develop modular, adaptable example cybersecurity solutions using commercially available technology. The NCCoE documents these example solutions in the NIST Special Publication (SP) 1800 series, which maps capabilities to the NIST Cybersecurity Framework and details the steps needed for another entity to re-create the example solution. The NCCoE was established in 2012 by NIST in partnership with the State of Maryland and Montgomery County, Maryland.
NIST CYBERSECURITY PRACTICE GUIDES
NIST Cybersecurity Practice Guides (Special Publication 1800 series) target specific cybersecurity challenges in the public and private sectors. They are practical, user-friendly guides that facilitate the adoption of standards-based approaches to cybersecurity. They show members of the information security community how to implement example solutions that help them align with relevant standards and best practices, and provide users with the materials lists, configuration files, and other information they need to implement a similar approach.
The documents in this series describe example implementations of cybersecurity practices that businesses and other organizations may voluntarily adopt. These documents do not describe regulations or mandatory practices, nor do they carry statutory authority.
ABSTRACT
Despite widespread recognition that patching is effective and attackers regularly exploit unpatched software, many organizations do not adequately patch. There are myriad reasons why, not the least of which are that it’s resource-intensive and that the act of patching can reduce system and service availability. Also, many organizations struggle to prioritize patches, test patches before deployment, and adhere to policies for how quickly patches are applied in different situations. To address these challenges, the NCCoE collaborated with cybersecurity technology providers to develop an example solution that addresses these challenges. This NIST Cybersecurity Practice Guide explains how tools can be used to implement the patching and inventory capabilities organizations need to handle both routine and emergency patching situations, as well as implement temporary mitigations, isolation methods, or other alternatives to patching. It also explains recommended security practices for patch management systems themselves.
KEYWORDS
cyber hygiene; enterprise patch management; firmware; patch; patch management; software; update; upgrade; vulnerability management
ACKNOWLEDGMENTS
We are grateful to the following individuals for their generous contributions of expertise and time.
Name |
Organization |
|---|---|
Peter Romness |
Cisco |
Matthew Hyatt |
Cisco |
John Loucaides |
Eclypsium |
Travis Raines |
Eclypsium |
Timothy Jones |
Forescout |
Tom May |
Forescout |
Michael Correa |
Forescout |
Jeffrey Ward |
IBM MaaS360 with Watson |
Joseph Linehan |
IBM MaaS360 with Watson |
Cesare Coscia |
IBM MaaS360 with Watson |
Jim Doran |
IBM Research Team |
Shripad Nadgowda |
IBM Research Team |
Victoria Mosby |
Lookout |
Tim LeMaster |
Lookout |
Dan Menicucci |
Microsoft |
Steve Rachui |
Microsoft |
Parisa Grayeli |
The MITRE Corporation |
Yemi Fashina |
The MITRE Corporation |
Nedu Irrechukwu |
The MITRE Corporation |
Joshua Klosterman |
The MITRE Corporation |
Allen Tan |
The MITRE Corporation |
Josh Moll |
Tenable |
Chris Jensen |
Tenable |
Jeremiah Stallcup |
Tenable |
John Carty |
VMware |
Kevin Hansen |
VMware |
Rob Robertson |
VMware |
Rob Hilberding |
VMware |
Brian Williams |
VMware |
The Technology Partners/Collaborators who participated in this build submitted their capabilities in response to a notice in the Federal Register. Respondents with relevant capabilities or product components were invited to sign a Cooperative Research and Development Agreement (CRADA) with NIST, allowing them to participate in a consortium to build this example solution. We worked with:
Technology Partner/Collaborator |
Build Involvement |
|---|---|
Cisco Firepower Threat Defense (FTD) Cisco Identity Services Engine (ISE) |
|
Eclypsium Administration and Analytics Service |
|
Forescout Platform |
|
IBM Code Risk Analyzer IBM MaaS360 with Watson |
|
Lookout Mobile Endpoint Security |
|
Microsoft Endpoint Configuration Manager |
|
Nessus
Tenable.io
Tenable.sc
|
|
VMware vRealize Automation SaltStack Config |
DOCUMENT CONVENTIONS
The terms “shall” and “shall not” indicate requirements to be followed strictly to conform to the publication and from which no deviation is permitted. The terms “should” and “should not” indicate that among several possibilities, one is recommended as particularly suitable without mentioning or excluding others, or that a certain course of action is preferred but not necessarily required, or that (in the negative form) a certain possibility or course of action is discouraged but not prohibited. The terms “may” and “need not” indicate a course of action permissible within the limits of the publication. The terms “can” and “cannot” indicate a possibility and capability, whether material, physical, or causal.
PATENT DISCLOSURE NOTICE
NOTICE: The Information Technology Laboratory (ITL) has requested that holders of patent claims whose use may be required for compliance with the guidance or requirements of this publication disclose such patent claims to ITL. However, holders of patents are not obligated to respond to ITL calls for patents and ITL has not undertaken a patent search in order to identify which, if any, patents may apply to this publication.
As of the date of publication and following call(s) for the identification of patent claims whose use may be required for compliance with the guidance or requirements of this publication, no such patent claims have been identified to ITL.
No representation is made or implied by ITL that licenses are not required to avoid patent infringement in the use of this publication.
List of Figures
Figure 1‑1 Logical Architecture Components and Flow
Figure 1‑2 Laboratory Configuration of Example Solution Architecture
Figure 2‑1 Vulnerability Summary Information
Figure 2‑2 Applying Filters to Scan Results
Figure 2‑3 Tenable VPR Summary Dashboard
Figure 2‑4 Tenable Worst of the Worst – Fix These First! Dashboard Example
Figure 2‑5 Exploitable Vulnerability Summary
Figure 2‑6 Example of Container Image Data
Figure 2‑7 Example of Container Vulnerability Information
Figure 3‑1 Eclypsium Main Dashboard
Figure 3‑2 Eclypsium Dashboard Device Details
Figure 3‑3 SMBIOS Before Eclypsium Firmware Update Script
Figure 3‑4 SMBIOS After Eclypsium Firmware Update Script
Figure 4‑1 SaltStack SecOps Vulnerability Summary and Top Advisories Dashboard
Figure 5‑1 Cisco ISE View of Vulnerability Data for Connected Devices
Figure 5‑2 Examples of Client Provisioning Policies
Figure 6‑1 All Software Updates View for Microsoft Endpoint Configuration Manager
Figure 6‑2 Creating a New Deployment Package with Microsoft Endpoint Configuration Manager
Figure 6‑3 Deployment Settings
Figure 6‑4 Deployment Schedule
Figure 6‑5 Devices View with Run Script Option Selected
Figure 6‑6 Report Showing Critical 3rd Party Updates Available for HP Business Clients
Figure 8‑1 Sample of Enrolled Devices
Figure 8‑2 IBM Maas360 Cloud Extender Download
Figure 8‑3 MaaS360 Portal Home Page
Figure 8‑4 Example of Enrolled Device Inventory
Figure 8‑5 Example of Installed Apps on a Mobile Device
Figure 8‑6 Sample Report from MaaS360
Figure 8‑7 IBM Maas360 Report Options
Figure 9‑1 Example of Device Firmware Information
Figure 9‑2 Example of Vulnerability Severity Information
Figure 9‑3 Lookout Apps Page Sample
List of Tables
Table 1‑1 Product Versions and System Configurations Used
Table 4‑1 Specified Values for Creating “Uninstall 7zip” Job Using SaltStack Config
Table 5‑1 License Types and Granted Capabilities for Cisco FTD
Table 5‑2 Security Zones Created for Cisco FTD
Table 8‑1 Values Specified for Scheduling Automated Patching
1 Introduction
The National Cybersecurity Center of Excellence (NCCoE) at the National Institute of Standards and Technology (NIST) built an example solution in a laboratory environment to demonstrate how organizations can use technologies to improve enterprise patch management for their general information technology (IT) assets.
This volume of the practice guide shows IT professionals and security engineers how we have implemented the example solution. It covers all the products employed in this reference design, summarizes their integration into the laboratory environment, and documents security decisions and associated configurations. We do not re-create the product manufacturers’ documentation, which is presumed to be widely available. Rather, these volumes show how we incorporated the products together in our environment.
This draft covers both phases of the example solution. Phase 1 involved two types of IT assets: desktop and laptop computers, and on-premises servers. Phase 2 added mobile devices and containers.
Note: These are not comprehensive tutorials. There are many possible service and security configurations for these products that are out of scope for this example implementation.
1.1 How to Use this Guide
This NIST Cybersecurity Practice Guide demonstrates a standards-based example solution and provides users with the information they need to replicate the proposed approach for improving enterprise patching practices for general IT systems. This design is modular and can be deployed in whole or in part.
This guide contains three volumes:
NIST Special Publication (SP) 1800-31A: Executive Summary – why we wrote this guide, the challenge we address, why it could be important to your organization, and our approach to solving the challenge
NIST SP 1800-31B: Security Risks and Capabilities – why we built the example implementation, including the risk analysis performed and the security capabilities provided by the implementation
NIST SP 1800-31C: How-To Guides – what we built, with instructions for building the example implementation, including all the details that would allow you to replicate all or parts of this project (you are here)
Depending on your role in your organization, you might use this guide in different ways:
Business decision makers, including chief security and technology officers, will be interested in the Executive Summary, NIST SP 1800-31A, which describes the following topics:
challenges that enterprises face in mitigating risk from software vulnerabilities
example solution built at the NCCoE
benefits of adopting the example solution
Business decision makers can also use NIST SP 800-40 Revision 4, Guide to Enterprise Patch Management Planning: Preventive Maintenance for Technology. It complements the implementation focus of this guide by recommending creation of an enterprise strategy to simplify and operationalize patching while also reducing risk.
Technology or security program managers who are concerned with how to identify, understand, assess, and mitigate risk will be interested in NIST SP 1800-31B, which describes what we did and why. The following sections will be of particular interest:
Section 3.5.1, Threats, Vulnerabilities, and Risks, describes the risk analysis we performed.
Section 3.5.2, Security Control Map, maps the security characteristics of this example solution to cybersecurity standards and best practices.
You might share the Executive Summary, NIST SP 1800-31A, with your leadership team members to help them understand the importance of adopting standards-based, automated patch management. Also, NIST SP 800-40 Revision 4, Guide to Enterprise Patch Management Planning: Preventive Maintenance for Technology may also be helpful to you and your leadership team.
IT professionals who may be interested in implementing an approach similar to ours will find the entire practice guide useful. In particular the How-To portion of the guide, NIST SP 1800-31C, could be used to replicate all or parts of the build created in our lab. Furthermore, the How-To portion of the guide provides specific product installation, configuration, and integration instructions for implementing the example solution. We have omitted the general installation and configuration steps outlined in manufacturers’ product documentation since they are typically made available by manufacturers. Instead, we focused on describing how we incorporated the products together in our environment to create the example solution.
This guide assumes that the reader of this document is a seasoned IT professional with experience in implementing security solutions within an enterprise setting. While we have used a suite of commercial and open-source products to address this challenge, this guide does not endorse these particular products. Your organization can adopt this solution or one that adheres to these guidelines in whole, or you can use this guide as a starting point for tailoring and implementing parts of an automated enterprise patch management system. Your organization’s security experts should identify the products that will best integrate with your existing tools and IT system infrastructure. We hope that you will seek products that are congruent with applicable standards and recommended practices. The Technologies section of NIST SP 1800-31B lists the products we used and maps them to the cybersecurity controls provided by this example solution.
A NIST Cybersecurity Practice Guide does not describe “the” solution, but an example solution. This is a draft guide. We seek feedback on the contents of this guide and welcome your input. Comments, suggestions, and success stories will improve subsequent versions of this guide. Please contribute your thoughts to cyberhygiene@nist.gov.
1.2 Build Overview
This NIST Cybersecurity Practice Guide addresses the use of commercially available technologies to develop an example implementation for deploying an automated patch management system. This project focuses on enterprise patch management for small to large enterprises. The example solution demonstrates how to manage assets to reduce outages, improve security, and continuously monitor and assess asset vulnerabilities.
1.2.1 Use Case Scenarios
The NCCoE team worked with the project collaborators to create a lab environment that includes the architectural components and functionality that will be described later in this section. These use case scenarios were demonstrated in the lab environment as applicable for desktop and laptop computers, on-premises servers, mobile devices, virtual machines, and containers:
Asset identification and assessment: discovering physical and virtual assets on your corporate network and performing automated assessments to prioritize their remediation. For this scenario, it is important to determine some information about each asset, such as hostname, Internet Protocol (IP) address, Media Access Control (MAC) address, firmware version, operating system (OS) version, and installed software packages. This information can be used to identify the asset and synchronize with other systems such as asset and configuration management tools. Once the asset has been identified, it is important to determine if the software and firmware versions have known vulnerabilities and how critical those vulnerabilities are. The collected information is categorized and integrated with other asset and configuration management tools.
Routine patching: modifying assets to configure and install firmware, OSs, and applications for the purpose of addressing bug fixes, providing security updates, and upgrading to later, supported releases of software. Routine patching is done at regularly scheduled intervals defined by the organization.
Emergency patching: performing emergency patching for assets, such as for an extreme severity vulnerability or a vulnerability being actively exploited in the wild. Systems in this scenario should be able to deploy patches to assets outside of regularly scheduled intervals.
Emergency mitigation: implementing emergency mitigations for identified assets, such as temporarily disabling vulnerable functionality. This scenario demonstrates an emergency procedure in which an organization needs to temporarily mitigate a vulnerability prior to a vendor releasing a patch. Systems included in this scenario need to be able to uninstall, reconfigure, and disable services on assets.
Isolation of unpatched assets: performing network isolation of assets, like unsupported legacy assets, end-of-life assets, and assets with high operational uptime requirements, to mitigate risk for assets that cannot be easily patched or cannot be patched at all.
Patch management system security: implementing recommended security practices for patch management systems, which have administrative privileged access over many other systems. See Section 3 of NIST SP 1800-31B for more information on addressing this scenario.
1.2.2 Logical Architecture
This project required a variety of technology capabilities. The following were included in the lab build:
IT endpoints: This represents traditional endpoints, which included Apple laptops, Linux workstations/servers, and Windows workstations/servers, as well as newer types of endpoints, such as containers and Android and iOS mobile devices. These endpoints were all integrated either physically or virtually within the network environment.
Device discovery: This includes systems that actively or passively scan the network environment and report about newly discovered assets and their observed characteristics.
Network access management: This includes systems that govern access for endpoints, which are components that typically enforce access restrictions based on telemetry received from device discovery and vulnerability management systems within the environment. For example, enterprise assets that are not up to the required patch levels could be restricted from having access to resources distributed across the network environment.
Vulnerability management: This includes systems that continually scan endpoints to identify known vulnerabilities and associated risks so that they may be proactively mitigated through appropriate patching and configuration settings.
Software, firmware, and configuration management: This includes systems that automate and maintain configuration changes and consistency across endpoints within the environment, as well as update currently installed software and firmware versions. Configuration changes may include updating network information, installing/uninstalling programs and services, and starting and stopping services.
Update sources: This includes systems that house and maintain the most recent and trusted software updates/upgrade files for distribution within the environment. These update sources were leveraged by the software distribution systems to maintain an updated repository of available patches.
Reporting: This includes systems that collect information from device discovery, network access management, and vulnerability management systems. This collected information can then be presented via dashboards or reports.
Figure 1-1 depicts the components that are used in the logical architecture, and the flow of a new or returning device joining the network.
Figure 1‑1 Logical Architecture Components and Flow
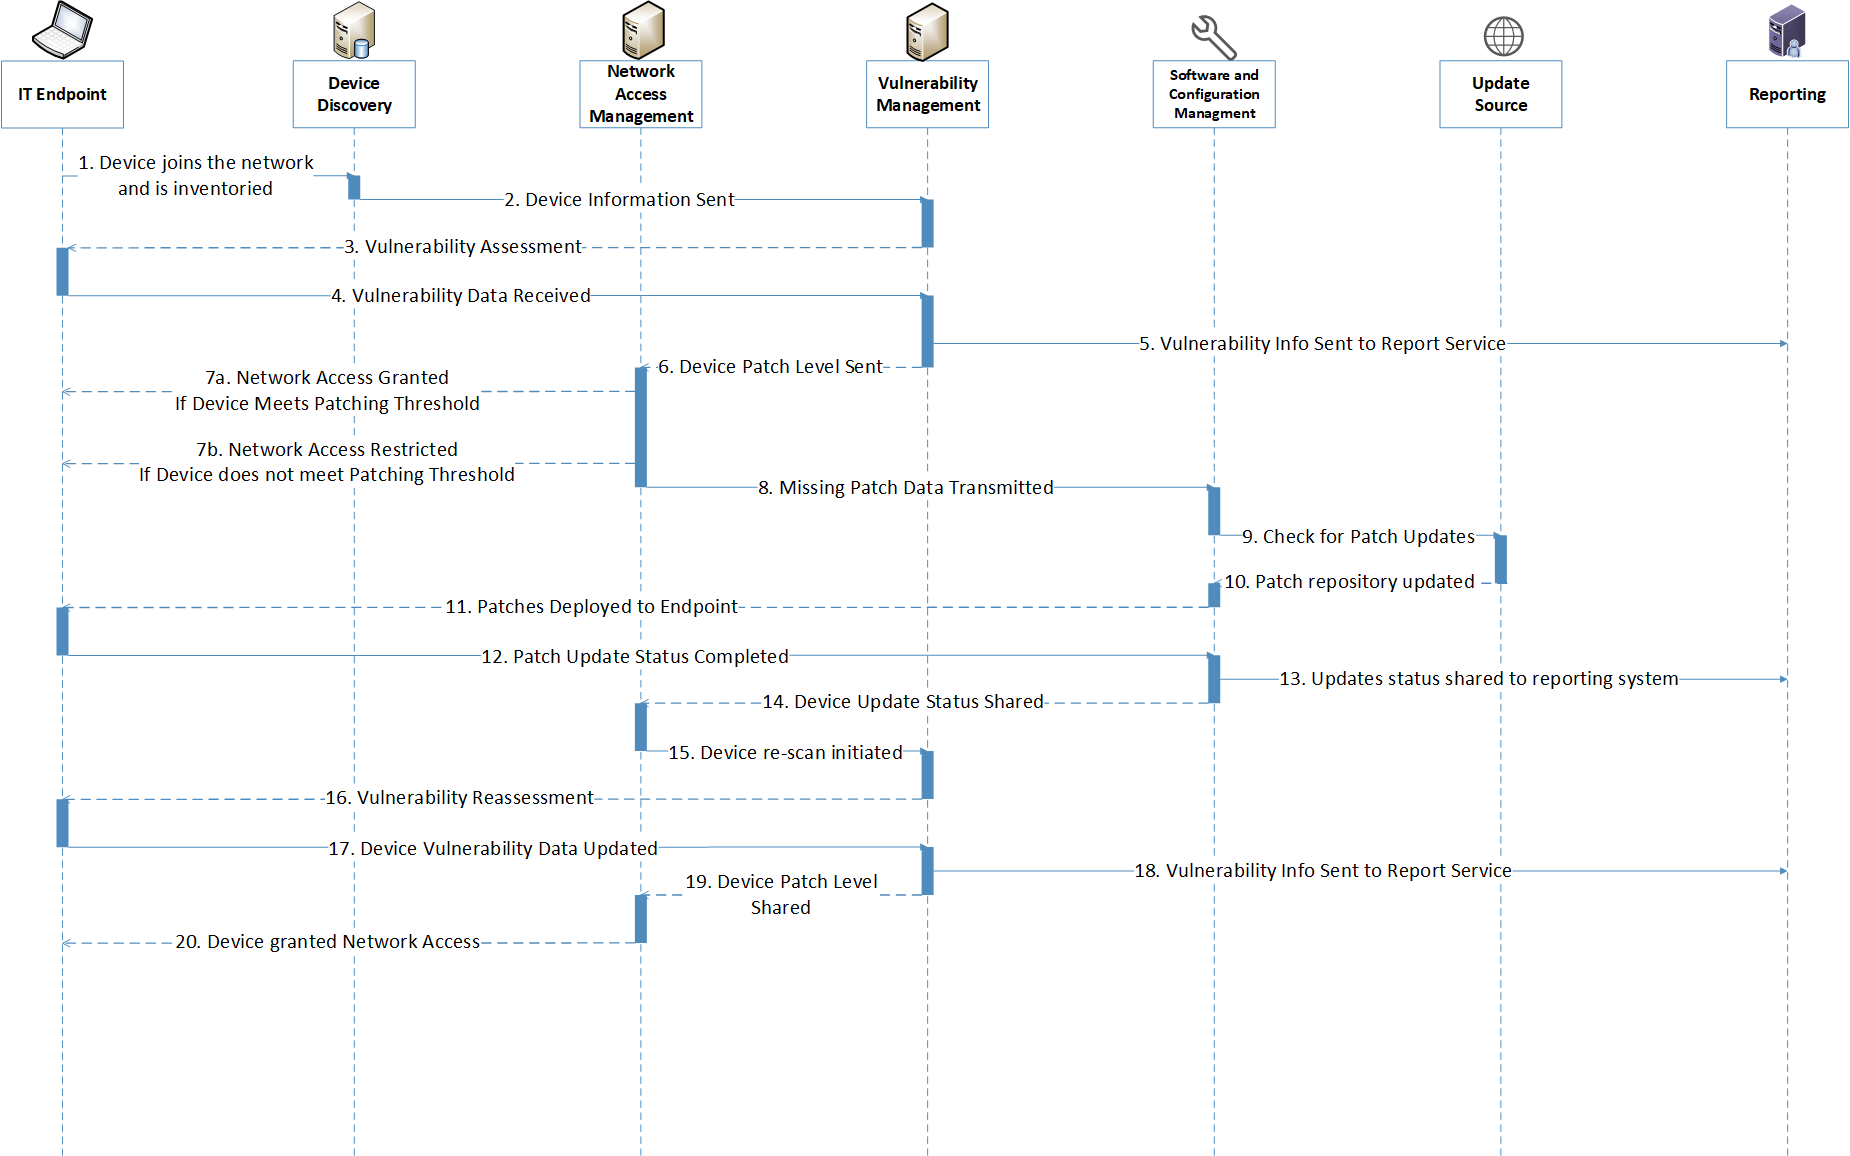
The following steps take place as a new or returning device joins the network. Each number corresponds to a flow in Figure 1-1.
Device discovery: 1) The device discovery tool scans the device and collects information such as Internet Protocol (IP) address, media access control (MAC) address, installed software/firmware, and OS, then 2) sends the information to a vulnerability management system.
Vulnerability scanning: 3) The vulnerability management system scans the endpoint for vulnerability information, including missing patches and outdated software, and 4) receives the scan results. 5) The vulnerability management system sends the collected vulnerability data to the reporting service for presentation to administrators.
Quarantine decision and enforcement: 6) The vulnerability management system shares the device patch level with the network access management system to be used for network access control. 7) The network access management system applies one of the following two enforcement actions: 7a) If the network device does not exceed the organizational patch threshold, the device is given network access and does not need to go through the remainder of the diagram. 7b) If the network device exceeds the organizational patch threshold, the network access management system performs quarantine actions on the endpoint and restricts network access. 8) The network access management system shares the missing patch information with the software and configuration management system.
Patching: 9) The software and configuration management system checks its trusted update source for patch updates, then 10) receives any new patches and updates its patch repository database. 11) Missing patches are deployed from the software and configuration management system to the connected endpoint. 12) The software and configuration management system receives the update that the patches have been installed successfully. 13) The updates that were applied are sent to a reporting server for administrator review. 14) The software and configuration management system communicates that updates were successfully applied to the endpoint.
Vulnerability scanning: 15) The network access management system initiates a rescan of the endpoint by communicating with the vulnerability management system. 16) The vulnerability management system rescans the endpoint and 17) collects updated vulnerability data. 18) The vulnerability management system sends updated endpoint vulnerability data to the reporting server and 19) shares device patch level information with the network access management server.
Network access granted: 20) The network access management server grants the endpoint network access.
1.3 Build Architecture Summary
Figure 1-2 depicts the high-level physical architecture of the NCCoE laboratory environment. The segmented laboratory network backbone models the separation that typically exists between subnetworks belonging to different parts of an enterprise, such as a backup site, shared services, a data center hosting widely used applications and services, and a workstation subnet consisting of user endpoints. While the majority of the nodes in the workstation subnet were virtual, the gray box notes physical machines.
The subnets were extended from the virtual lab to the physical lab by a Cisco switch. The switch had the workstation virtual local area network (VLAN) extended to it from VMware via a trunk port. The lab subnetworks were connected by a Cisco Firepower Threat Defense (FTD) firewall.
Figure 1‑2 Laboratory Configuration of Example Solution Architecture
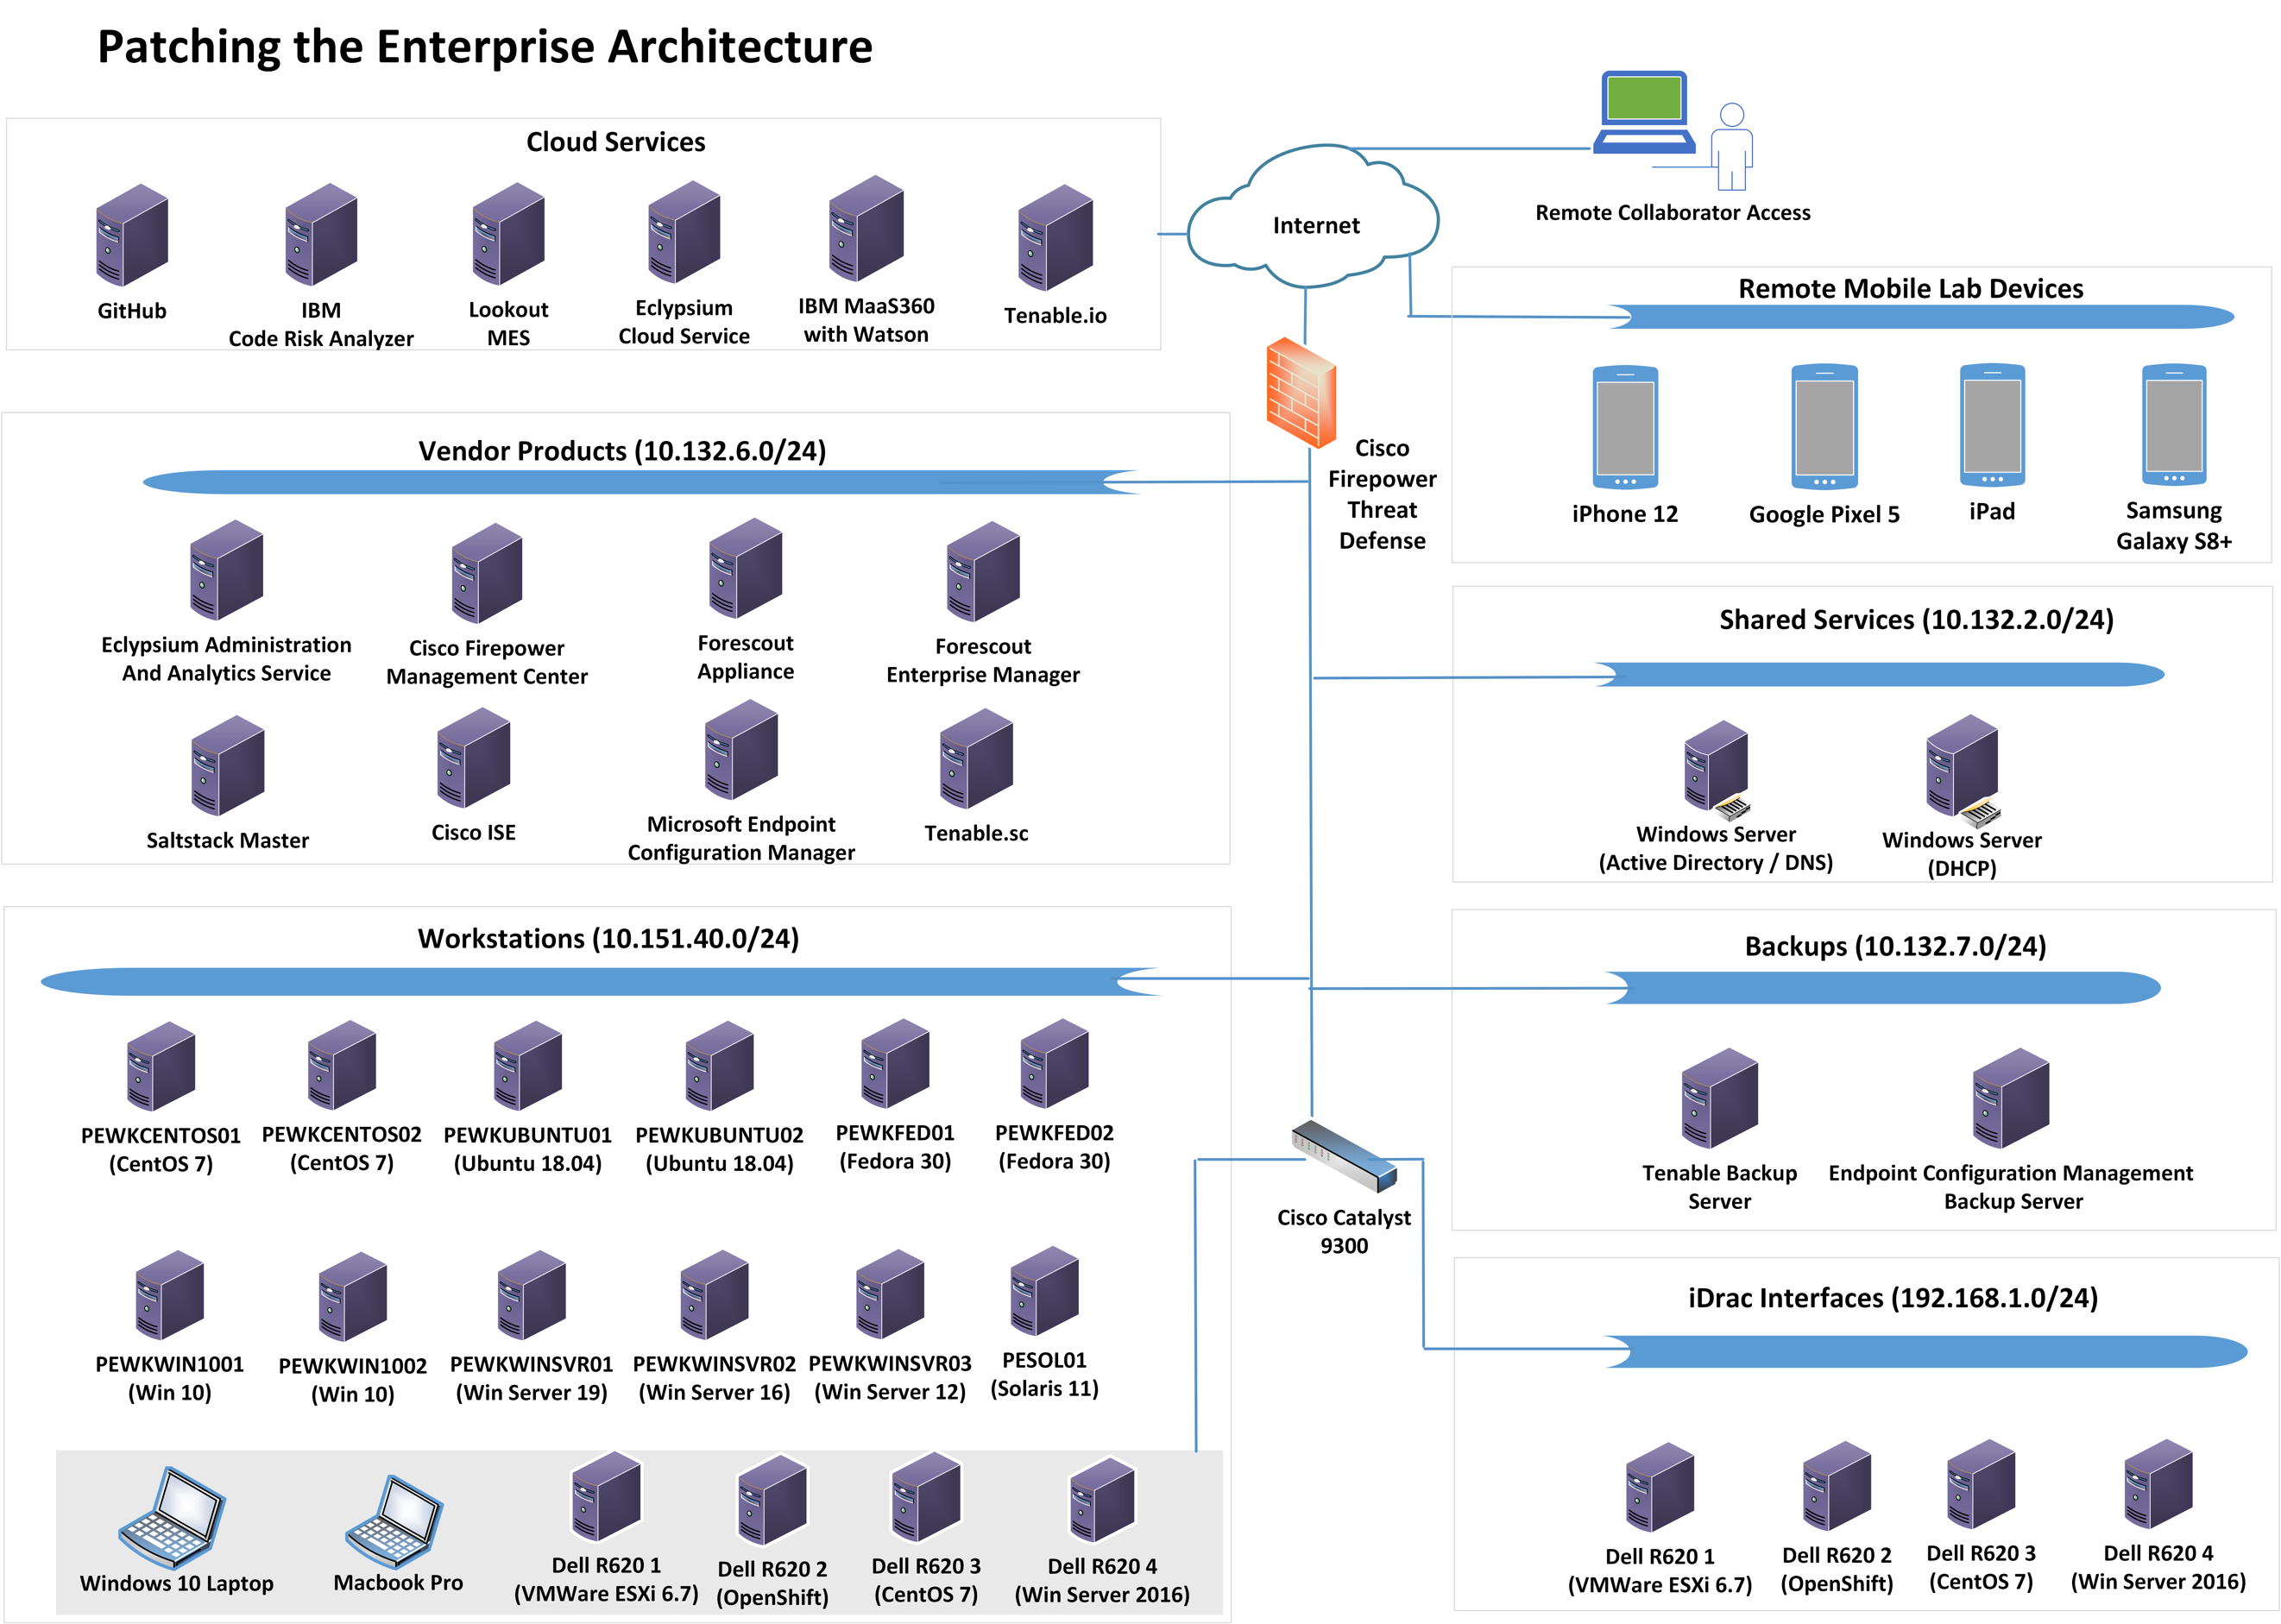
The NCCoE lab provided the following supporting infrastructure for the example implementation:
VMware ESX version 7.0, a shared NCCoE resource provided by the NCCoE IT Operations team to host the patching infrastructure’s virtual machine (VM) workloads and network infrastructure
a dedicated VLAN provided for external collaborator remote access to the VMware lab environment from NCCoE IT operations
a Windows 2016 server that provided Active Directory (AD) services, authenticated users and machines to the lab.nccoe.org domain, and provided Domain Name System (DNS) services
a Windows 2019 server that provided Dynamic Host Configuration Protocol (DHCP) services to the endpoint network
a Windows 2019 server that served as a remote backup site for the endpoint configuration management system
a CentOS 7 machine that served as a remote backup site for the Tenable vulnerability management system
iDrac interfaces that allowed for remote configuration of Dell R620 server blades
virtualized endpoints running the following OSs: CentOS, Fedora, macOS, Red Hat, Solaris, Ubuntu, Windows Enterprise, and Windows Server
a physical Windows 10 laptop and a physical Apple laptop running macOS to represent employee endpoints
a Microsoft Structured Query Language (SQL) server hosting the database for Microsoft Endpoint Configuration Manager
several Dell R620 machines that had Windows Server 2016, VMware ESXi, and two machines running CentOS 7 installed to represent physical end nodes. Of the two CentOS 7 machines, one was chosen to have OpenShift installed to represent a container management platform. The Docker repository was also run on this same OpenShift machine.
1.4 Implemented Products and Services
The following collaborator-supplied components were integrated with the supporting infrastructure to yield the example implementation:
Cisco Firepower Management Center (FMC) version 6.5.0.4 provided centralized management of the Cisco Firepower Threat Defense firewall. It supplied a web interface for firewall administrators.
Cisco Firepower Threat Defense (FTD) version 6.4.0 was the central firewall that connected the lab’s internal subnets and the external internet. Through communication with Cisco Identity Services Engine (ISE), the firewall provided network segmentation capabilities.
Cisco Identity Services Engine (ISE) version 2.7.0.36 was utilized to perform asset inventory and discovery. Using attributes that were collected by Cisco ISE, such as current user or patch level, the firewall enforced custom network access control policies.
Eclypsium Administration and Analytics Service version 2.2.2 was configured to assess firmware levels present on a device and report if a vulnerable version of firmware was running on a device. It could then download firmware updates to affected devices.
Forescout Platform version 8.2.2 provided asset inventory and discovery. Additionally, Forescout collected attributes associated with endpoints and, through policy, provided enforcement actions such as network access control via an integration with pxGrid, or service removal via custom scripts.
IBM Code Risk Analyzer (cloud-based service) provided vulnerability scanning and reporting for source code as part of the DevOps pipeline. Through an integration with GitHub, it scanned deployed code for vulnerabilities and produced a report of remediation actions. IBM, as part of the lab effort, provided source code hosted in GitHub to be ingested by the Code Risk Analyzer.
IBM MaaS360 with Watson (cloud-based service) provided asset inventory, vulnerability management, and software distribution to laptops and mobile devices. The user authentication module, part of the Cloud Extender module, was used to integrate IBM MaaS360 with AD. This allowed users to authenticate to MaaS360 with their domain-joined accounts.
Lookout Mobile Endpoint Security (cloud-based service) provided vulnerability scanning, assessment, reporting, and policy enforcement for mobile devices. An integration with IBM MaaS360 allowed custom attributes from Lookout to be used in MaaS360 policies.
Microsoft Endpoint Configuration Manager version 2002 provided device configuration and software distribution capabilities. Endpoint Configuration Manager allowed for software updates and software changes to be pushed to endpoints. Discovery capabilities were enabled to determine what endpoints existed on the network and domain.
Nessus version 8.14.0 provided on-premises vulnerability scanning of the architecture. Nessus logged into devices over the network, using supplied credentials, and enumerated vulnerabilities and missing patch information. This information was then presented to the administrator via the managing Tenable.sc tool.
Tenable.io (cloud-based service) provided vulnerability scanning and reporting for containerized applications. Tenable.io was configured to upload a repository from an OpenShift node and perform assessments.
Tenable.sc version 5.18.0 provided management of the lab Nessus scanner. Tenable.sc was configured to utilize the Nessus scanner to provide on-premises vulnerability scanning, asset inventorying/discovery, and reporting using dashboards. Scan data from Tenable.sc was ingested by other systems and was exported in the form of reports.
VMware vRealize Automation SaltStack Config version 8.3.0 provided device configuration and software distribution capabilities. SaltStack Config allowed for configuration changes to be made to devices by updating or removing software as well as updating settings such as network information.
Table 1-1 lists the collaborator-supplied product versions and system configurations that were utilized in the implementation, including the number of central processing units (CPUs) and the amount of random access memory (RAM) and hard disk drive (HDD) space in gigabytes (GB). All products were either deployed virtually via an Open Virtualization Appliance (OVA) or installed on VMs. In addition to these products, five cloud-based software-as-a-service (SaaS) offerings were also used for the build: IBM Code Risk Analyzer, IBM MaaS360 with Watson, Lookout Mobile Endpoint Security, Tenable.io, and a SaaS version of Eclypsium.
Table 1‑1 Product Versions and System Configurations Used
Product |
Version |
OS |
CPUs |
RAM |
HDD |
Deployed Via |
|---|---|---|---|---|---|---|
Cisco FMC |
6.5.0.4 |
N/A |
4 |
32 GB |
250 GB |
OVA |
Cisco FTD |
6.4.0 |
N/A |
4 |
8 GB |
49 GB |
OVA |
Cisco ISE |
2.7.0.36 |
N/A |
2 |
8 GB |
200 GB |
OVA |
Eclypsium Administration and Analytics Service (on-premises) |
2.2.2 |
CentOS 7 |
2 |
8 GB |
200 GB |
Installed application |
Forescout Appliance |
8.2.2 |
N/A |
6 |
14 GB |
200 GB |
OVA |
Forescout Enterprise Manager |
8.2.2 |
N/A |
4 |
12 GB |
200 GB |
OVA |
Microsoft Endpoint Configuration Manager |
2002 |
Windows Server 2019 |
4 |
8 GB |
240 GB |
Installed application |
Nessus |
8.14.0 |
CentOS 7 |
2 |
8 GB |
200 GB |
Installed application |
Tenable.sc |
5.18.0 |
CentOS 7 |
2 |
8 GB |
80 GB |
Installed application |
VMware vRealize Automation SaltStack Config |
8.3.0 |
CentOS 7 |
2 |
12 GB |
80 GB |
Installed application |
Sections 2 through 9 of this volume contain more information on each of these products and services, grouped by vendor. Note that the vendor sections are in order by the approximate sequence followed in this build for installing and configuring the products and services.
1.6 Typographic Conventions
The following table presents typographic conventions used in this volume.
Typeface/ Symbol |
Meaning |
Example |
|---|---|---|
Italics |
file names and path names; references to documents that are not hyperlinks; new terms; and placeholders |
For language use and style guidance, see the NCCoE Style Guide. |
Bold |
names of menus, options, command buttons, and fields |
Choose File > Edit. |
Monospace |
command-line input, onscreen computer output, sample code examples, and status codes |
|
Monospace (block) |
multi-line input, on-screen computer output, sample code examples, status codes |
% mkdir -v nccoe_projects
mkdir: created directory 'nccoe_projects'
|
blue text |
link to other parts of the document, a web URL, or an email address |
All publications from NIST’s NCCoE are available at https://www.nccoe.nist.gov. |
2 Tenable
In the first phase of our build, we used Tenable products to provide on-premises vulnerability scanning, asset inventorying/discovery, and reporting using dashboards. Tenable was leveraged to meet the device discovery, software/firmware discovery, and software/firmware assessment scenarios. Two Tenable products, Nessus Scanner and Tenable.sc, were used in the lab environment as part of this project. Also, Tenable.io, a SaaS-based cloud offering from Tenable, provided vulnerability scanning of container images to the lab environment during the second phase of the build. This section shows how each product was installed, configured, and used in the lab.
2.1 Nessus Installation and Configuration
Nessus is a vulnerability scanning engine that is used to scan endpoints, such as Linux, Windows, and macOS, VMware ESXi, and network switches for vulnerability data. We utilized Nessus to scan endpoints for vulnerability information and feed this information to Tenable.sc for reporting. Nessus can be deployed as a standalone server or managed by Tenable.sc. In our lab build, Nessus was managed by Tenable.sc. Since Nessus needed to be linked to Tenable.sc during Tenable.sc’s setup, Nessus was installed and set up first.
Nessus was installed on a CentOS 7 VM, with hardware details included in Section 1.4. More information on Nessus requirements can be found here. Installing Nessus 8.14.0 consisted of the following steps (with more detailed information available from the hyperlinked resources):
Download the Nessus executable from the Tenable download page. Note that you will need a Tenable account to download installation software.
Install Nessus by running the rpm installation command, then start the Nessus service.
Configure Nessus to be managed by Tenable.sc after installing Tenable.sc.
2.2 Tenable.sc
Tenable.sc is a vulnerability management product that collects information from Nessus and reports that information to administrators using dashboards and reports. Our build utilized Tenable.sc to manage a Nessus scanner and report on collected vulnerability data for scanned endpoints. This section assumes that the Nessus scanner from Section 2.1 was installed before installing Tenable.sc.
2.2.1 Tenable.sc Installation and Configuration
Tenable.sc was installed on a CentOS 7 VM, with hardware details included in Section 1.4. The Tenable site has more information on Tenable.sc requirements. Installing and configuring Tenable.sc 5.18.0 consisted of the following steps:
Download Tenable.sc from the Tenable site (note: a Tenable account is needed).
Install Tenable.sc using the appropriate rpm command and start the Tenable.sc service.
Configure Tenable.sc:
Add a Nessus scanner. Tenable.sc relies on vulnerability data collected from Nessus scanners to provide information on endpoint vulnerability levels.
Add a repository. A repository holds vulnerability data that is collected from Nessus scanners for organizational endpoints. Repositories provide data storage that can be restricted to appropriate users.
Add an organization. Organizations provide logical groupings for Tenable resources. Administrators can restrict access to organizations to ensure that only authorized personnel can view data.
Add a user with Security Manager permissions. The Security Manager role needs to be added before a scan can be run. By default, when installing Tenable.sc a local system administrator account is created, and that account is responsible solely for setting up organizations and repositories. A Security Manager account has the correct permissions to view scan data and initiate scans. More information on other Tenable.sc security roles can be found here.
Add endpoint credentials. Tenable.sc requires credentials to be loaded in order to obtain the correct access levels for vulnerability scan data to be collected. Missing results may be observed by scanning an endpoint without credentials. More information on credentials can be found here.
2.2.2 Tenable.sc Scan Setup and Launch
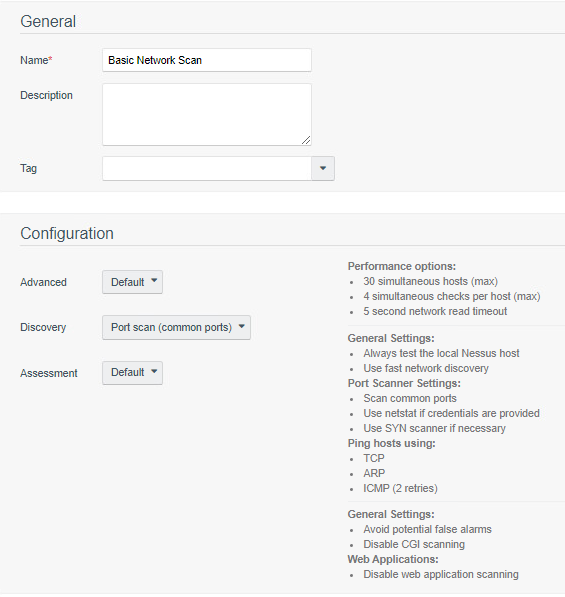
After installing Nessus and Tenable.sc, the next step was to set up a scan policy. Scan policies allow you to deploy template-based or custom scan options for assessing endpoints, including Windows, VMware ESXi, macOS, and Linux-based OSs, as well as networking equipment. Scan policies contain plugin settings and other advanced options that are used during active scans. For our build, Tenable recommended the Basic Network scan template with credentials to assess vulnerabilities, because it performs a full system scan that is suitable for a variety of hosts regardless of OS. Our build performed a credentialed scan to help Tenable enumerate missing patch information; other options were non-credentialed scans and agent-based scanning. More information on other types of Tenable.sc scan templates and when they may be used can be found here.
We used the options below when creating our scan policy. See https://docs.tenable.com/tenablesc/Content/AddScanPolicy.htm for more information on adding scan policies.
Template: Basic Network scan
Name: Lab Basic Scan
Advanced: Default
Discovery: Port scan (common ports)
Assessment: Default
The Report and Authentication tabs stayed at their default values, as credentials will be added in the active scan section.
The next step after creating a scan policy was to add that policy to an active scan. Active scans utilize the scan policy as well as user-supplied options to launch scans against endpoints. More information on creating an active scan is available here. We used the following options when creating our active scan:
Name: Credentialed Scan
Policy: Lab Basic Scan
Schedule
Frequency: Weekly
Time: 03:00
Timezone: America/New_York
Repeat Every: Saturday
Import Repository: Patching Lab Endpoints
Target Type: IP/DNS Name
IPs / DNS Names: 10.151.40.0/24
Credentials: Add all credentials created in step
After creating the active scan, click Submit. The example above would be scheduled to run automatically on Saturdays at 3 a.m.
Information on manually launching scans (ad-hoc) is available here.
2.2.3 Scan Results
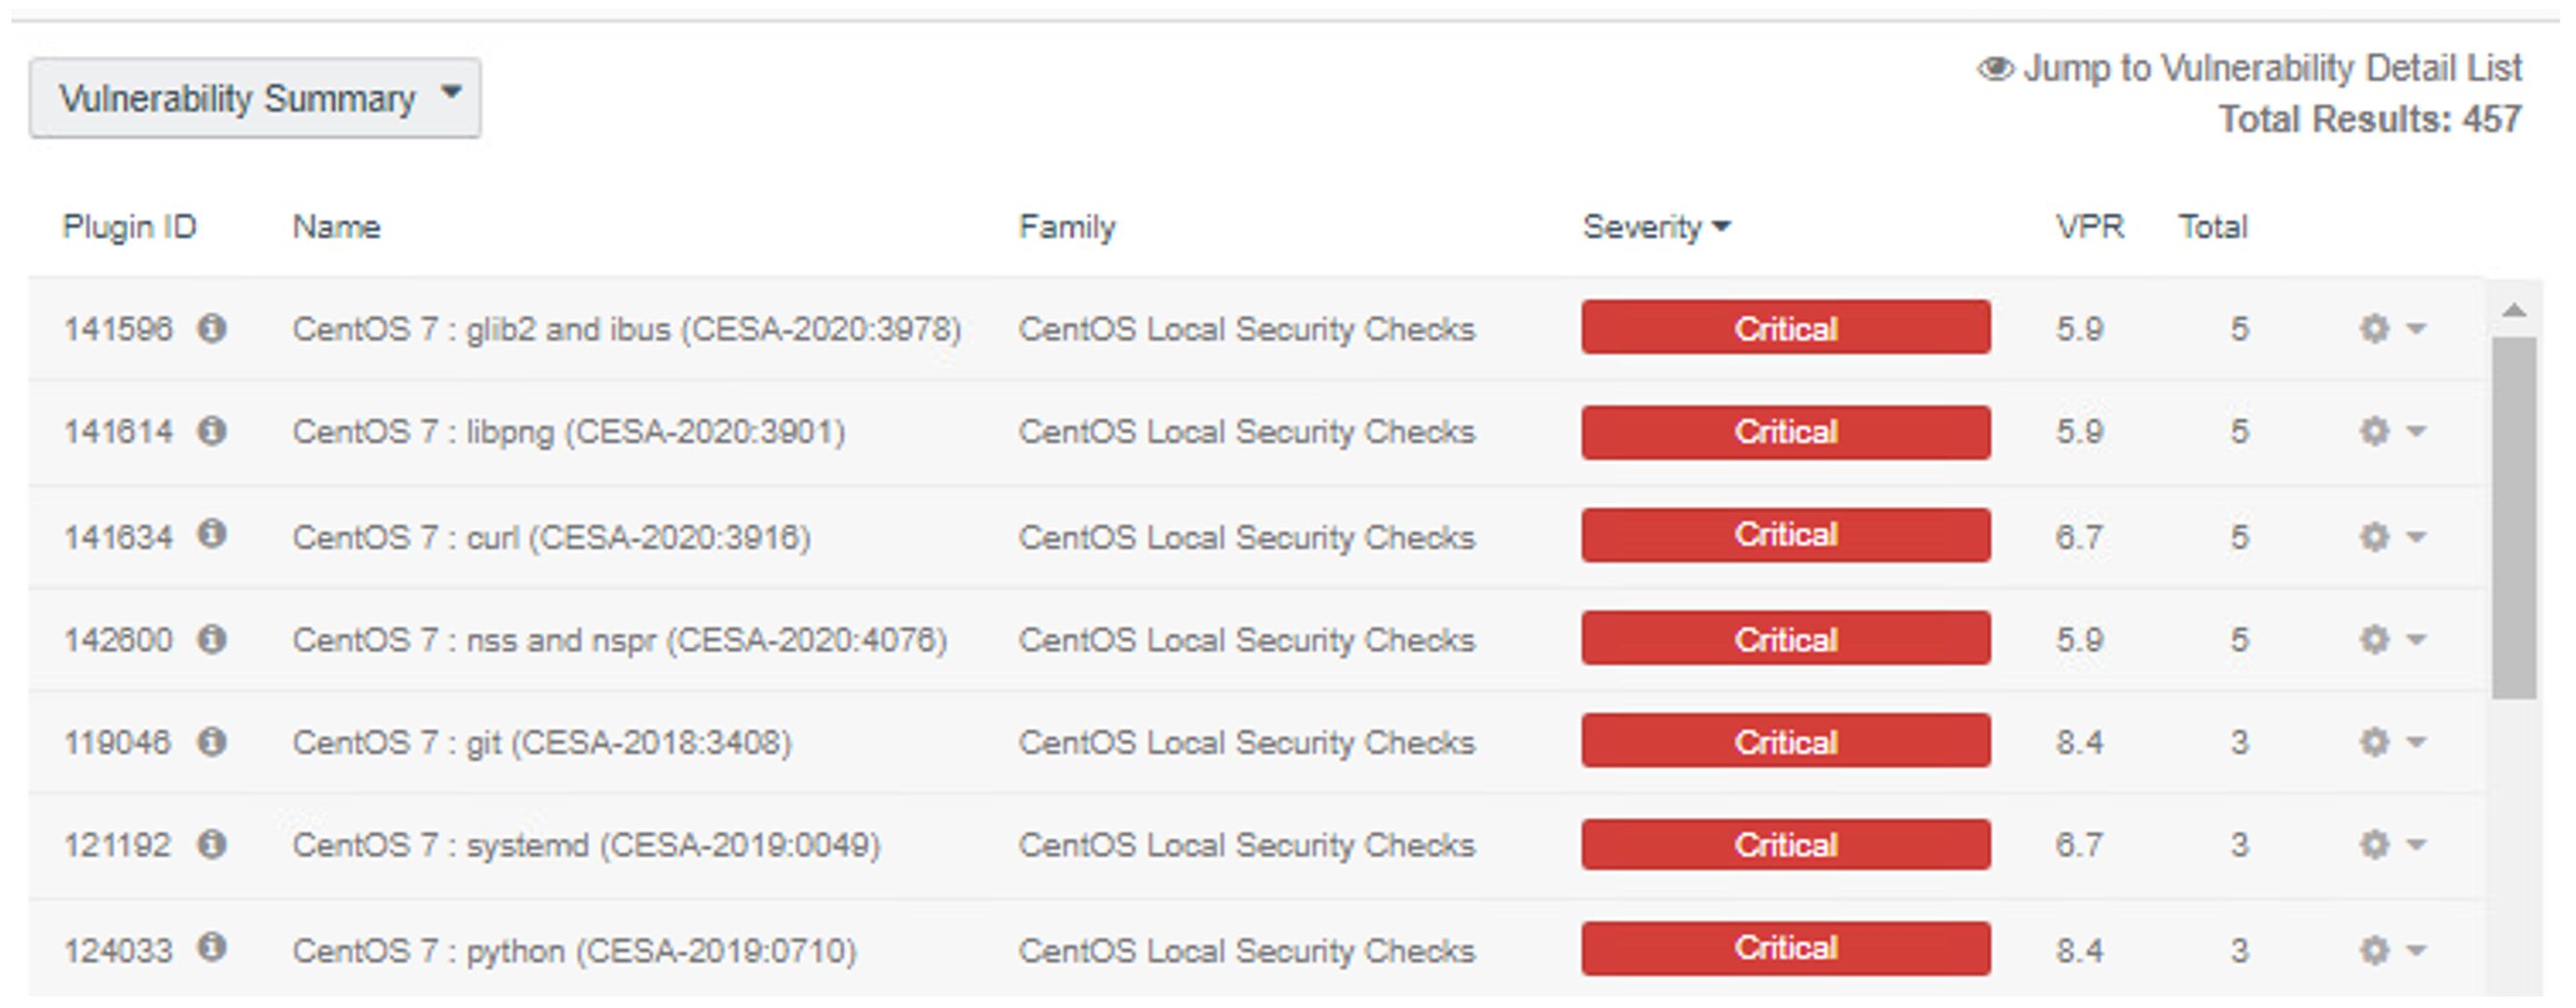
By default, when viewing scan results, the user is taken to the vulnerability summary page. This page contains information on observed vulnerabilities, and the results are sorted by observed Common Vulnerability Scoring System (CVSS) severity and the number of observed affected machines. Figure 2-1 shows vulnerability summary information from our build. The vulnerabilities can be viewed by package name and OS. The scan results can also be sorted by different types, such as IP address. This can be useful in allowing administrators to quickly see which vulnerabilities were discovered per asset.
Figure 2‑1 Vulnerability Summary Information
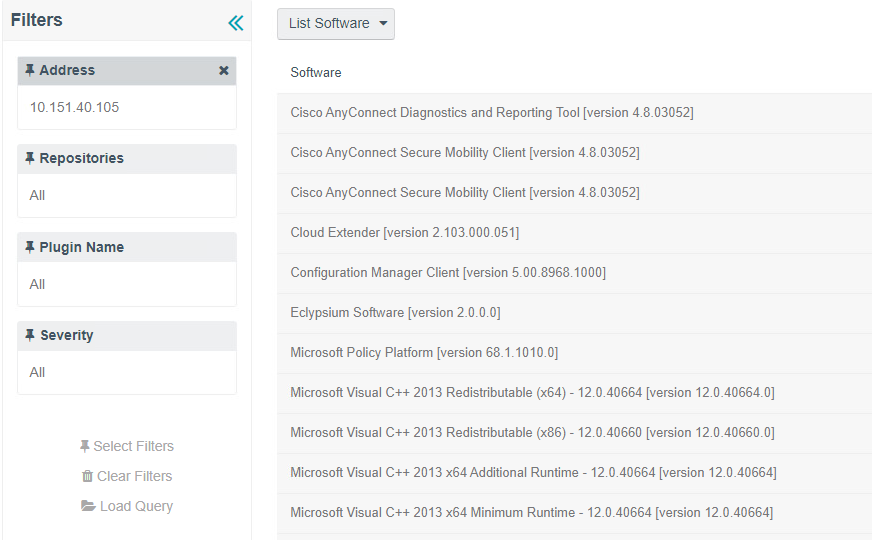
Sorting by IP Summary and then clicking the IP address of a machine allows for additional filters to be applied to scan results. Another filter that could be utilized for software discovery is clicking on List Software while searching for a specific IP address. This filter shows all the software that is currently running and discovered on a machine, as the example in Figure 2-2 illustrates.
Figure 2‑2 Applying Filters to Scan Results
2.2.4 Tenable.sc Dashboards
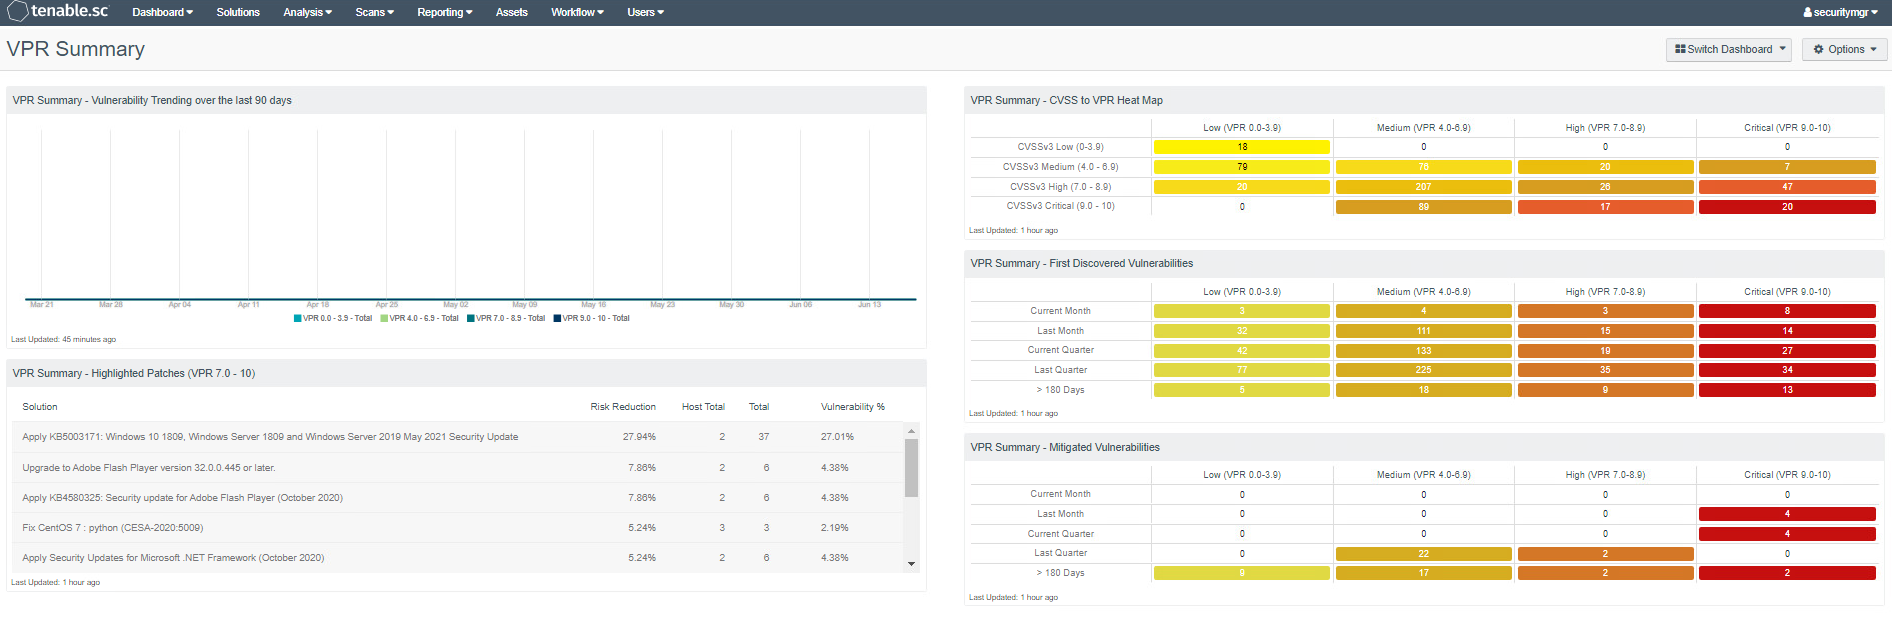
Tenable.sc provides graphical representations of information that is obtained via vulnerability scans. Dashboards can be customized with different widgets to allow organizations to quickly observe vulnerability information. We utilized Tenable.sc’s reporting dashboards to help prioritize which assets to remediate first and meet the firmware and software assessment scenarios. Directions for adding a dashboard are available here. We used two dashboards: the Vulnerability Prioritization Rating (VPR) Summary dashboard and the Worst of the Worst - Fix These First! dashboard.
The VPR Summary dashboard was utilized to help administrators prioritize which systems in the lab should be remediated first. VPR combines threat intelligence, machine learning, research insights, and vulnerability metrics to dynamically measure risk. A higher number on the VPR dashboard indicated which systems should be immediately addressed. Figure 2-3 shows the VPR dashboard from the build.
Figure 2‑3 Tenable VPR Summary Dashboard
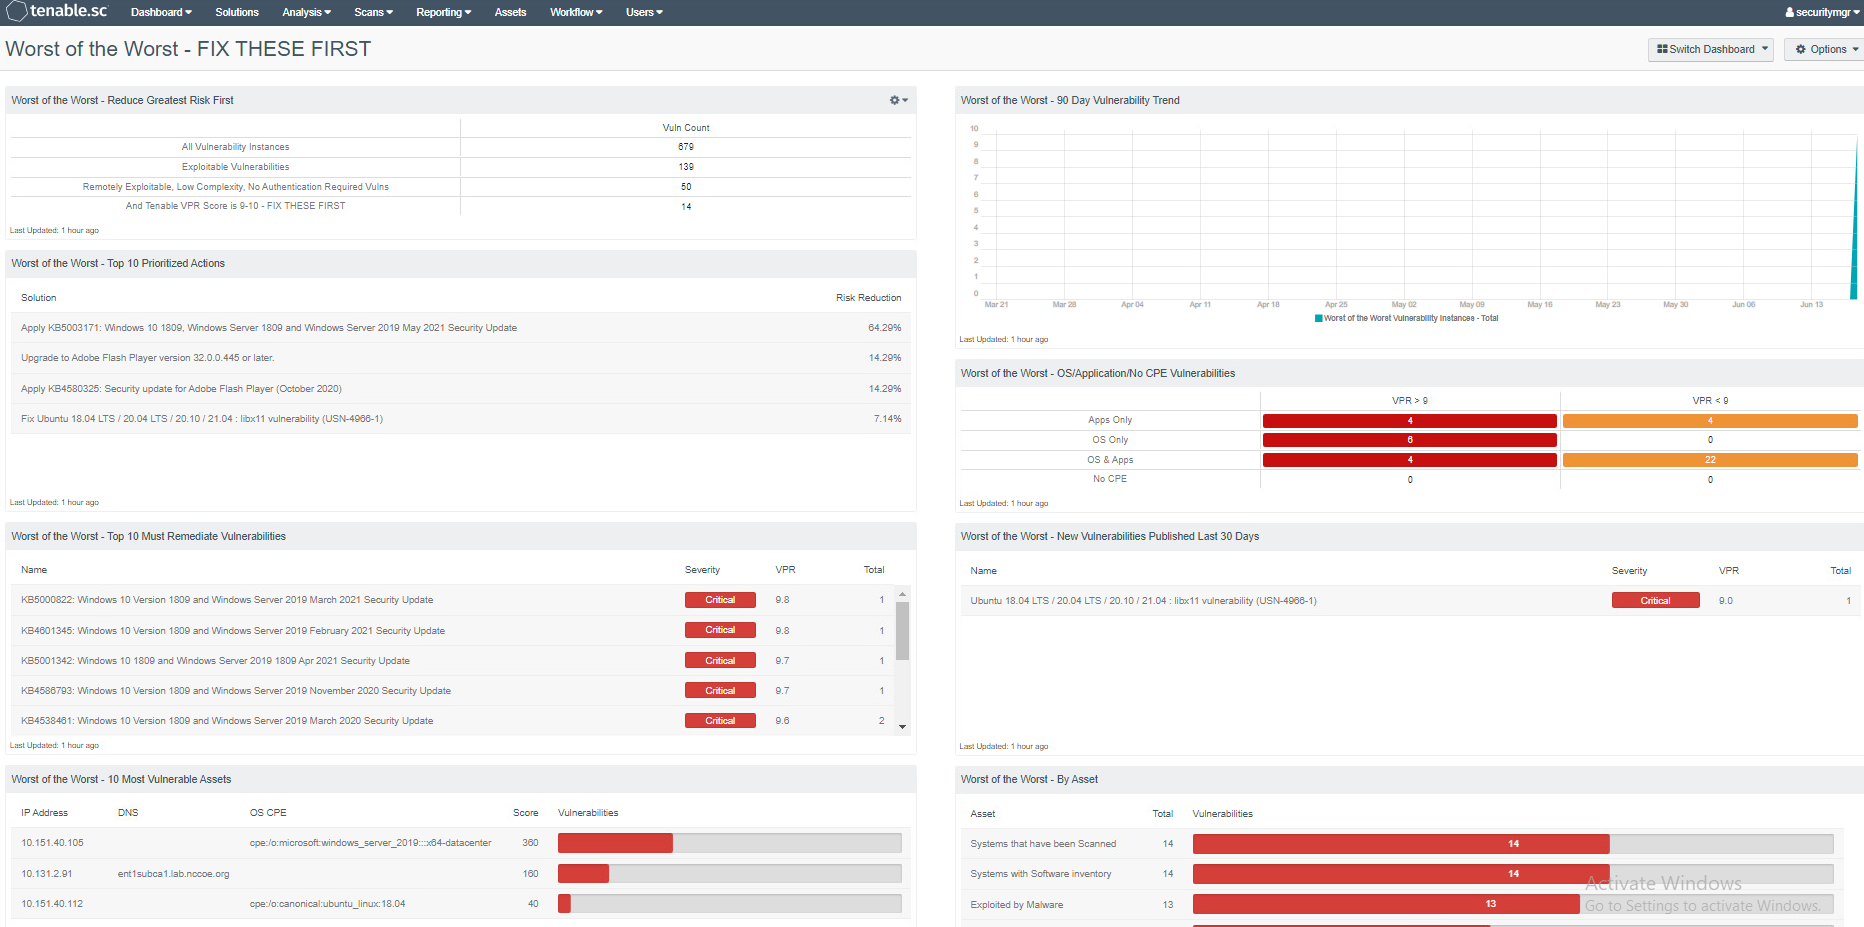
The Worst of the Worst – Fix These First! dashboard was used to help system administrators prioritize remediation efforts. The dashboard allows system administrators to gain insight into the top 10 vulnerabilities affecting systems and the top 10 remediation actions that should be taken. The dashboard also shows a list of the most vulnerable assets. Figure 2-4 shows an example of the Worst of the Worst dashboard, with the top 10 most vulnerable assets and exploitable vulnerabilities.
Figure 2‑4 Tenable Worst of the Worst – Fix These First! Dashboard Example
2.2.5 Tenable.sc Reporting
Tenable.sc also provides the ability to export vulnerability data to reports. The difference between dashboards and reports is that reports are meant to be exported and used outside of the Tenable.sc web console. With reports, data can be exported as a comma-separated values (CSV) file for ingestion by other systems, or as PDF files to be reviewed by management for compliance or vulnerability management purposes. Our build utilized reports to demonstrate how software and firmware assessment data could be shared with security managers to help to prioritize remediation efforts and actions.
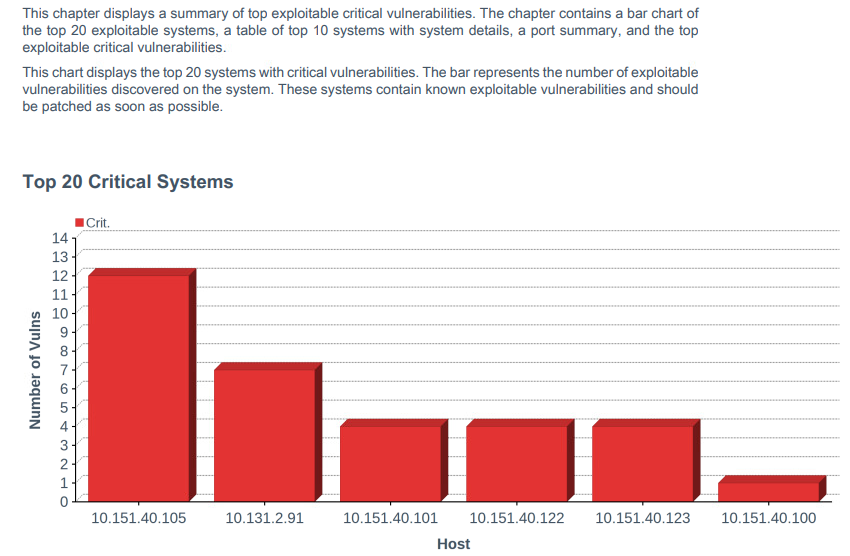
Tenable reports can be scheduled to run after a scan or be scheduled to run during certain times of the week. To launch a report on demand (manually start), follow the instructions here. Once the report is ready and the user clicks on the results, the report automatically downloads in the browser. Figure 2-5 shows a portion of the Critical and Exploitable Vulnerabilities report from our build that detailed the top 20 critically affected systems.
Figure 2‑5 Exploitable Vulnerability Summary
More information about reports, other report templates, and custom report creation can be found here.
2.2.6 Tenable.sc Integrations
Tenable.sc provides for integrations with third-party software via its representational state transfer (REST) application programming interface (API). The vulnerability data that is collected by Tenable can be shared with other systems such as configuration management or access control systems to automatically apply remediation actions. More information on the Tenable API can be found here. The following two example integrations with Tenable.sc were implemented in the lab:
Cisco ISE: This integration allowed Cisco ISE to leverage vulnerability data collected by Tenable.sc. Cisco ISE initiated a scan when new devices joined the network. The CVSS scores observed by Tenable were then sent to Cisco ISE, and devices that were over the score threshold were automatically quarantined from internal access. See Section 5.2.5 for additional information on the Cisco ISE integration.
Forescout Platform: This integration allowed Forescout to leverage vulnerability data collected by Tenable.sc in order to quarantine endpoints. A Forescout policy was created that specified that devices with CVSS scores over a certain threshold would be quarantined from the network. Forescout leveraged an integration with Cisco ISE via pxGrid to perform network enforcement actions. Section 7.2.8 contains additional explanation of the integration.
2.2.7 Tenable.sc Ongoing Maintenance
All Tenable components should be kept up to date. You must have an active Tenable account to download updated software. Software for all Tenable components, including Nessus and Tenable.sc, can be downloaded from https://www.tenable.com/downloads. Follow the directions on these pages to upgrade Tenable.sc and upgrade Nessus.
Note that while Nessus plugins are updated automatically without user intervention, there is an option to manually update them. Keeping plugins up-to-date allows Tenable to identify all of the latest vulnerabilities.
2.3 Tenable.io
Tenable.io is a cloud-based platform that organizations can use to perform vulnerability scanning and reporting for their on-premises and cloud-based endpoints. In our build we used Tenable.io to provide container security for a CentOS 7 VM running Red Hat’s OpenShift container orchestration software.
The platform system requirements for endpoints to run the Container Security (CS) Scanner software can be found here.
2.3.1 Tenable.io Configuration
Tenable.io is operated using an online portal. It provides a Get Started page that walks administrators through initial setup steps, such as configuring scans and linking a Nessus scanner. These steps were not needed to perform the capabilities implemented in the lab demonstration.
Administrators will need to speak with their Tenable representative to ensure access to the CS dashboard before continuing. Without access to this dashboard, they will not be able to add a connector to upload registry images or review the results from completed scans.
2.3.2 Performing Container Scans
Container registry users need to perform the following high-level steps in order to begin running container scans. For more information on getting started running the CS Scanner, please consult the following page.
Download and install the CS Scanner Docker image from the Tenable.io Portal. During download, you will be presented with a username and password. Please make note of them, as they will be needed during the installation.
Generate API keys. API keys will be needed in order for the CS Scanner tool to securely interact with and upload data to Tenable.io.
Set environmental variables. The following environmental variables were created and exported:
TENABLE_ACCESS_KEY – This was created in step 2. It is used to allow the container security tool to connect with Tenable.io.
TENABLE_SECRET_KEY – This was generated during the API key creation process. It is used to allow the tool to connect with Tenable.io.
IMPORT_REPO_NAME – This is the name of the repository that you would like to export. Note that this name is what will appear in the container security dashboard of Tenable.io.
REGISTRY_URI – This is the URI of the registry that you would like to import.
REGISTRY_USERNAME – This is a machine account on the system that contains the correct privileges to read from the registry.
REGISTRY_PASSWORD – This is the password for the account that will read from the registry.
IMPORT_INTERVAL_MINUTES – This is how often you want the Tenable.io scanner to import and scan images. The lab implementation configured the scan to run every 1440 minutes. The scan by default will run in a manual, ad-hoc manner.
Configure and run the Tenable.io CS Scanner. This involves running a docker command with the environmental variables that were previously set, then importing the registry. The registry is automatically imported after a one-line command is run, without further interaction from the user.
2.3.3 Container Scan Results
After performing the scan from Section
2.3.2, the container image data will
populate inside of Tenable.io. To view scan
results,
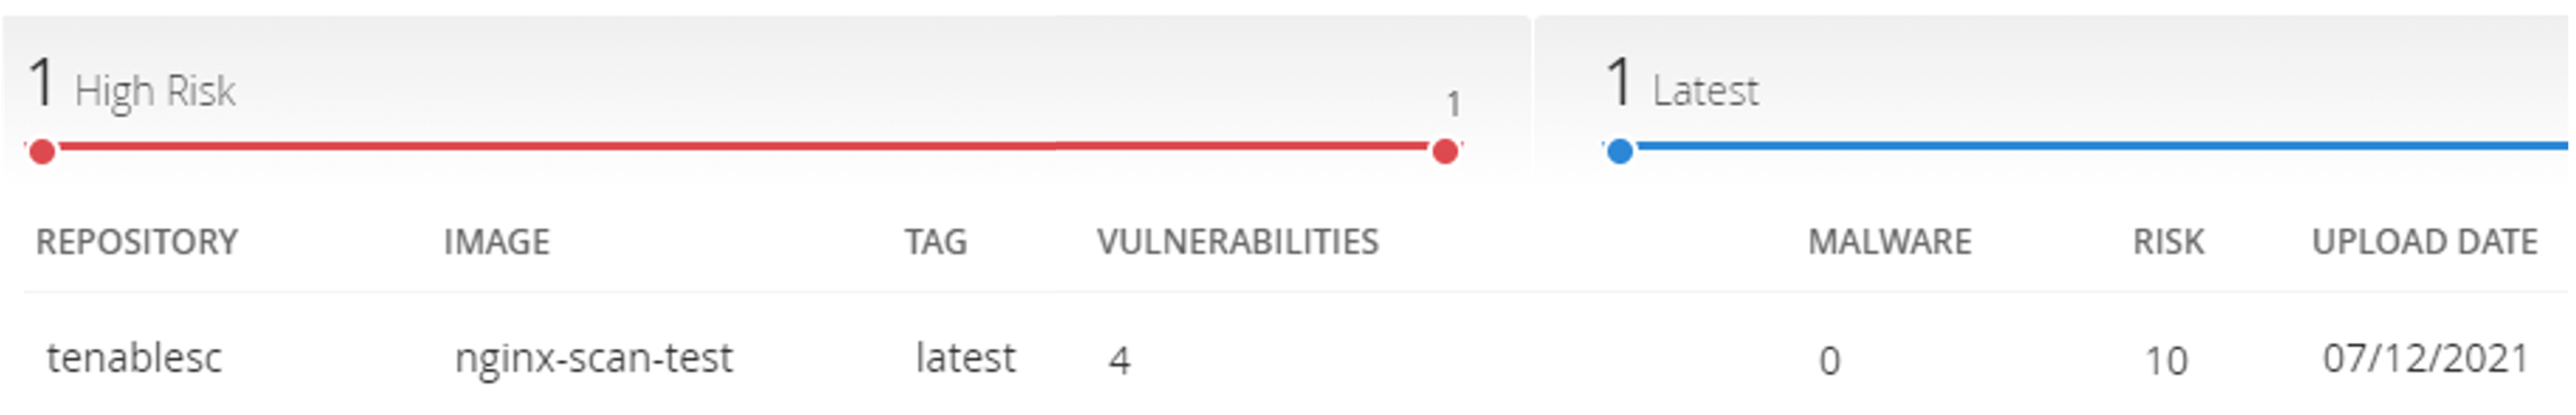
a user logs in to Tenable.io and navigates to Menu  > Container Security > Images tab. This tab presents the user
with the repository and image name, the associated number of
vulnerabilities or malware, risk score, and date of upload, as Figure
2-6 depicts.
> Container Security > Images tab. This tab presents the user
with the repository and image name, the associated number of
vulnerabilities or malware, risk score, and date of upload, as Figure
2-6 depicts.
Figure 2‑6 Example of Container Image Data
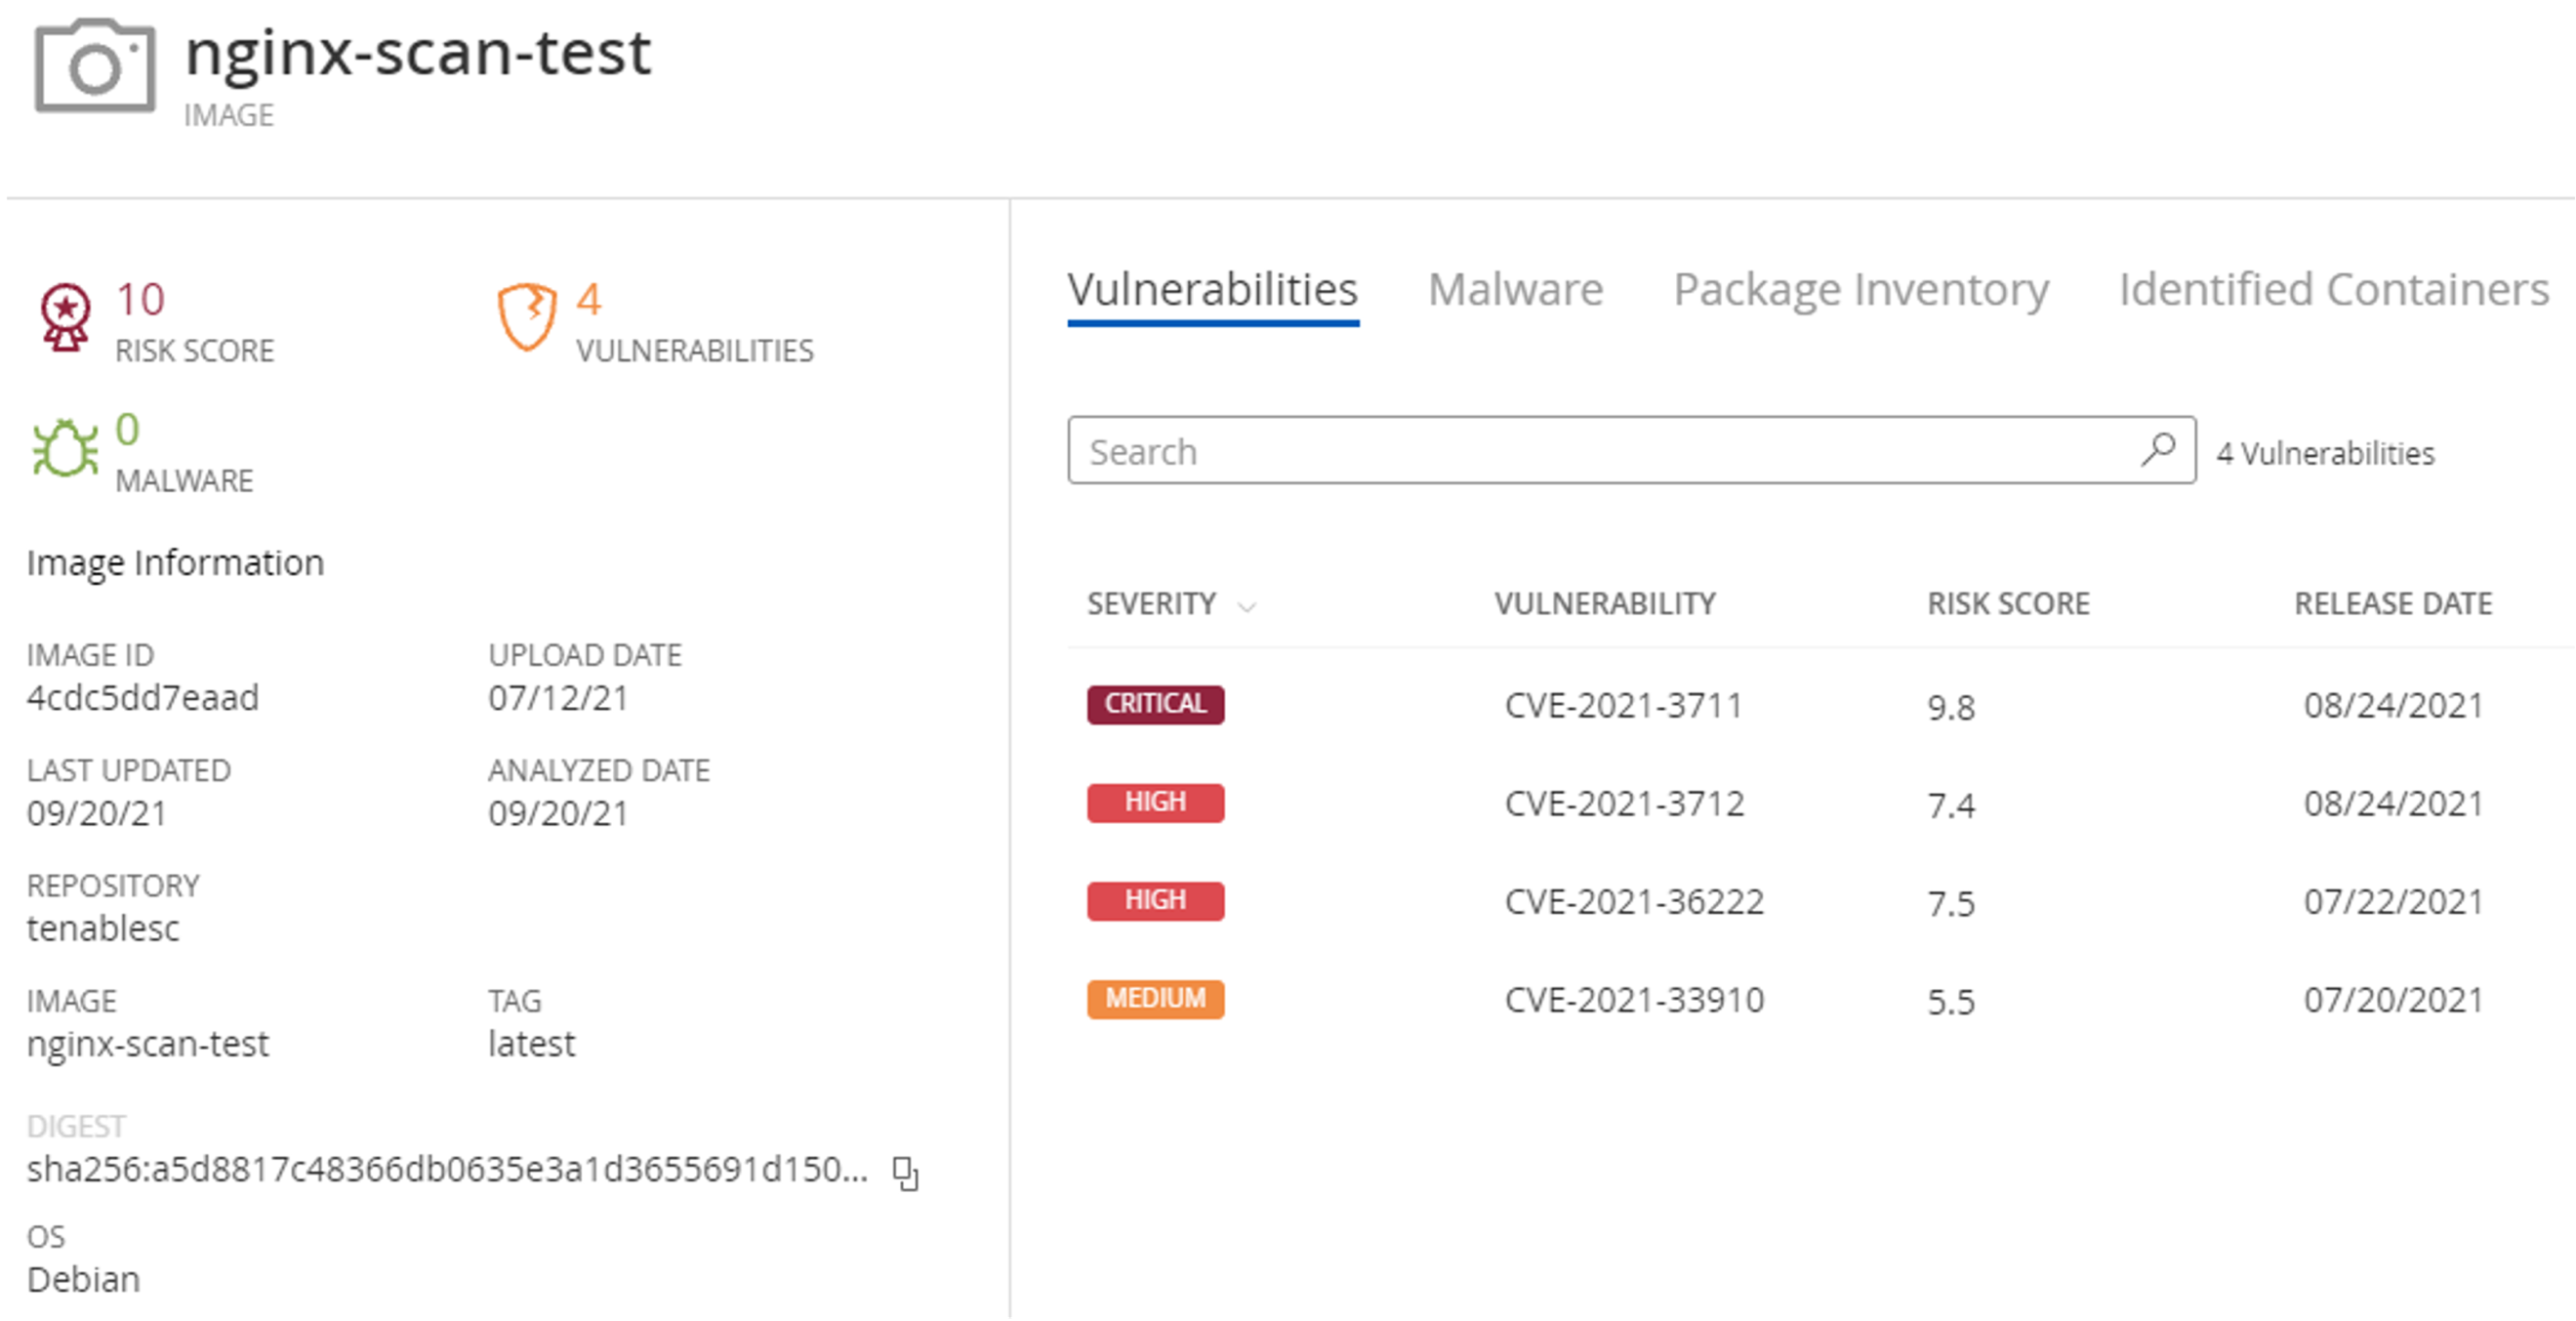
The scan results can be further drilled into by clicking on the repository that you would like additional information on. Under this new view, administrators can see the actual vulnerabilities and Common Vulnerabilities and Exposures (CVE) scores associated with containers as well as malware, package inventory, and identified containers. Figure 2-7 shows a view of the vulnerabilities associated with the lab instance’s uploaded registry.
Figure 2‑7 Example of Container Vulnerability Information
2.3.4 Tenable.io Maintenance
Tenable.io is a SaaS offering with updates automatically provided and installed by Tenable, who maintains the platform.
3 Eclypsium
Eclypsium provides monitoring and alerting for software and hardware components for an enterprise, along with advanced capabilities such as firmware integrity checking and updating. This section provides information on Eclypsium installation and usage. In this build, we utilized Eclypsium to provide agent-based identification of hardware and firmware for our laptop, desktop, and server endpoints while also monitoring the firmware for vulnerable or end-of-life versions. We utilized both the on-premises and cloud-hosted versions of Eclypsium. Both solutions offered the same experience, with the cloud product receiving updates faster and automatically.
3.1 Eclypsium Installation and Configuration
Two machines were required for the on-premises installation: one for the main console and database, and the other for data processing. The console machine should be accessible by a fully qualified domain name (FQDN) DNS entry.
The steps below are a basic overview of the installation. You will receive an installation guide from your Eclypsium representative with more detailed instructions.
Provision two machines that meet or exceed the hardware requirements in the installation guide.
Download the Eclypsium installation script and your license to the same folder.
Perform the installation.
Install Transport Layer Security (TLS) certificates by copying the private key, public TLS certificate, and the full certificate chain to the /opt/eclypisum/certs directory. The TLS certificate was generated and signed by our internal Lab certificate authority (CA).
The SaaS version of Eclypsium comes fully provisioned and installed.
3.2 Eclypsium Scanning
Eclypsium scanning is agent-based, so the binary must be downloaded and installed on the target machine and registered to the Eclypsium before scanning can begin. To download the Eclypsium agent go to Deployment > Download to find the binary for your chosen computing platform. Eclypsium supports installer binaries for Windows, Windows Server, macOS, and Debian or RPM Package Manager (RPM) based Linux systems. You must also use an access token (a random character string) for the registration. This token is used both to ensure that only desired endpoints are registered, and optionally to register devices in groups depending on the token used. Device tokens can be managed by navigating to Administration > Tokens.
After downloading the binary onto an endpoint and generating a host registration token, the following commands were run, as an example on a CentOS 7 machine, to install the application and register the host with the console:
yum install eclypsium*.rpm

EclypsiumApp -s2 <DOMAIN> <REGISTRATION_TOKEN>
To launch an ad-hoc or manual scan, navigate to Devices > Device List and click the Scan button.
To schedule a recurring scan, perform the following steps:
Navigate to Settings > Scan.
Click Schedule under the Scan Schedule field.
Fill out the Custom Scan Schedule box with the information shown below.
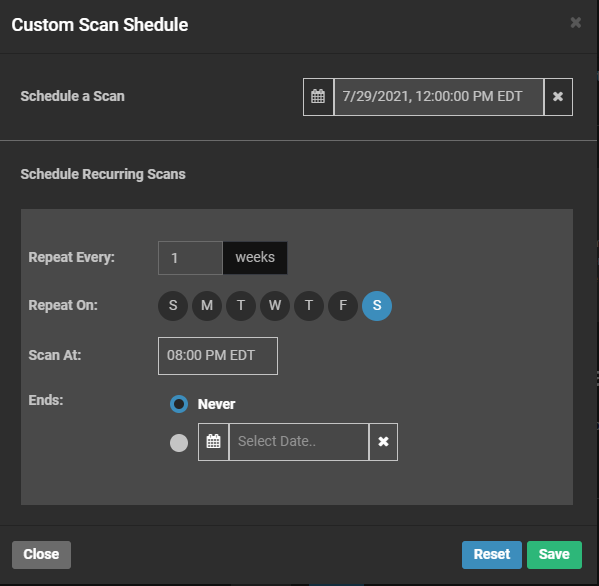
Click Save.
The above options create a scan that will run weekly on Saturdays at 8 p.m. ET. The scan schedule can be changed so that scans run more than once per week by selecting additional days or be repeated at a different weekly interval by changing the Repeat Every field.
3.3 Eclypsium Reporting
Eclypsium’s main dashboard (Figure 3-1) provided firmware assessment capabilities to the build. The main dashboard provided a quick view into monitored devices, devices at risk, and the integrity of installed firmware. The Devices pane displayed information on the devices that were actively being monitored by the Eclypsium agent and presented that information grouped by device type (Clients, Servers, Network). The Risk pane displayed information regarding systems that were affected by vulnerable firmware versions with high CVSS scores. The Risk pane also showed all vulnerable devices and devices that were running outdated firmware. The Integrity pane showed devices with integrity failures and baseline deviations. Eclypsium keeps a running database of good firmware hashes to compare to an installed firmware hash to check for malicious or potentially compromised firmware versions.
Figure 3‑1 Eclypsium Main Dashboard
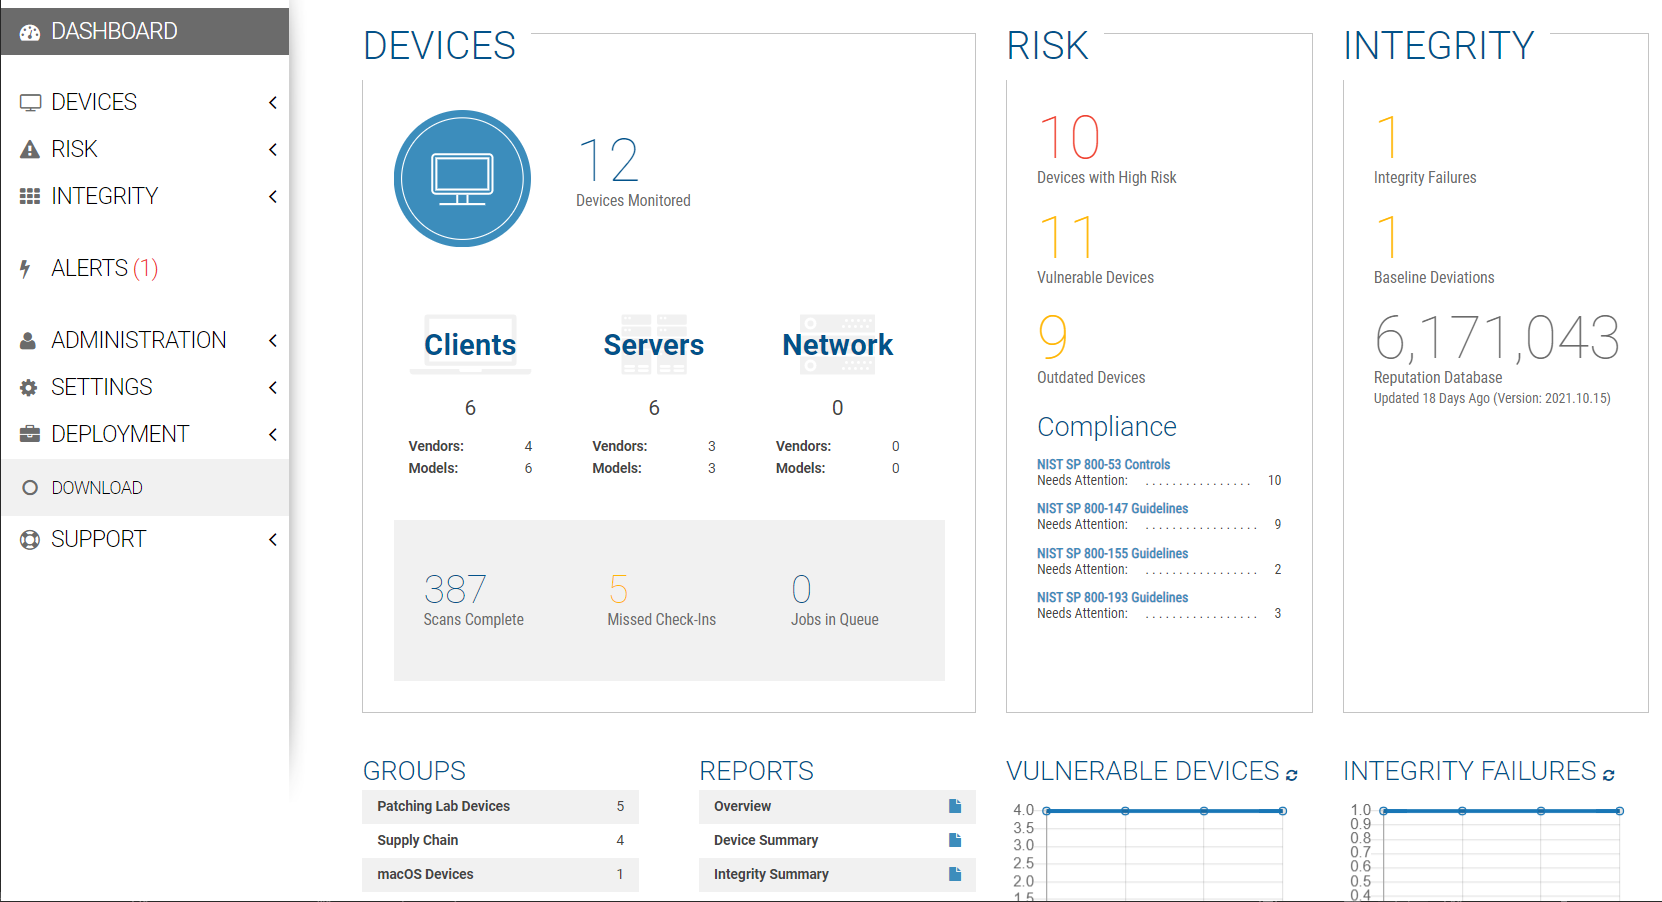
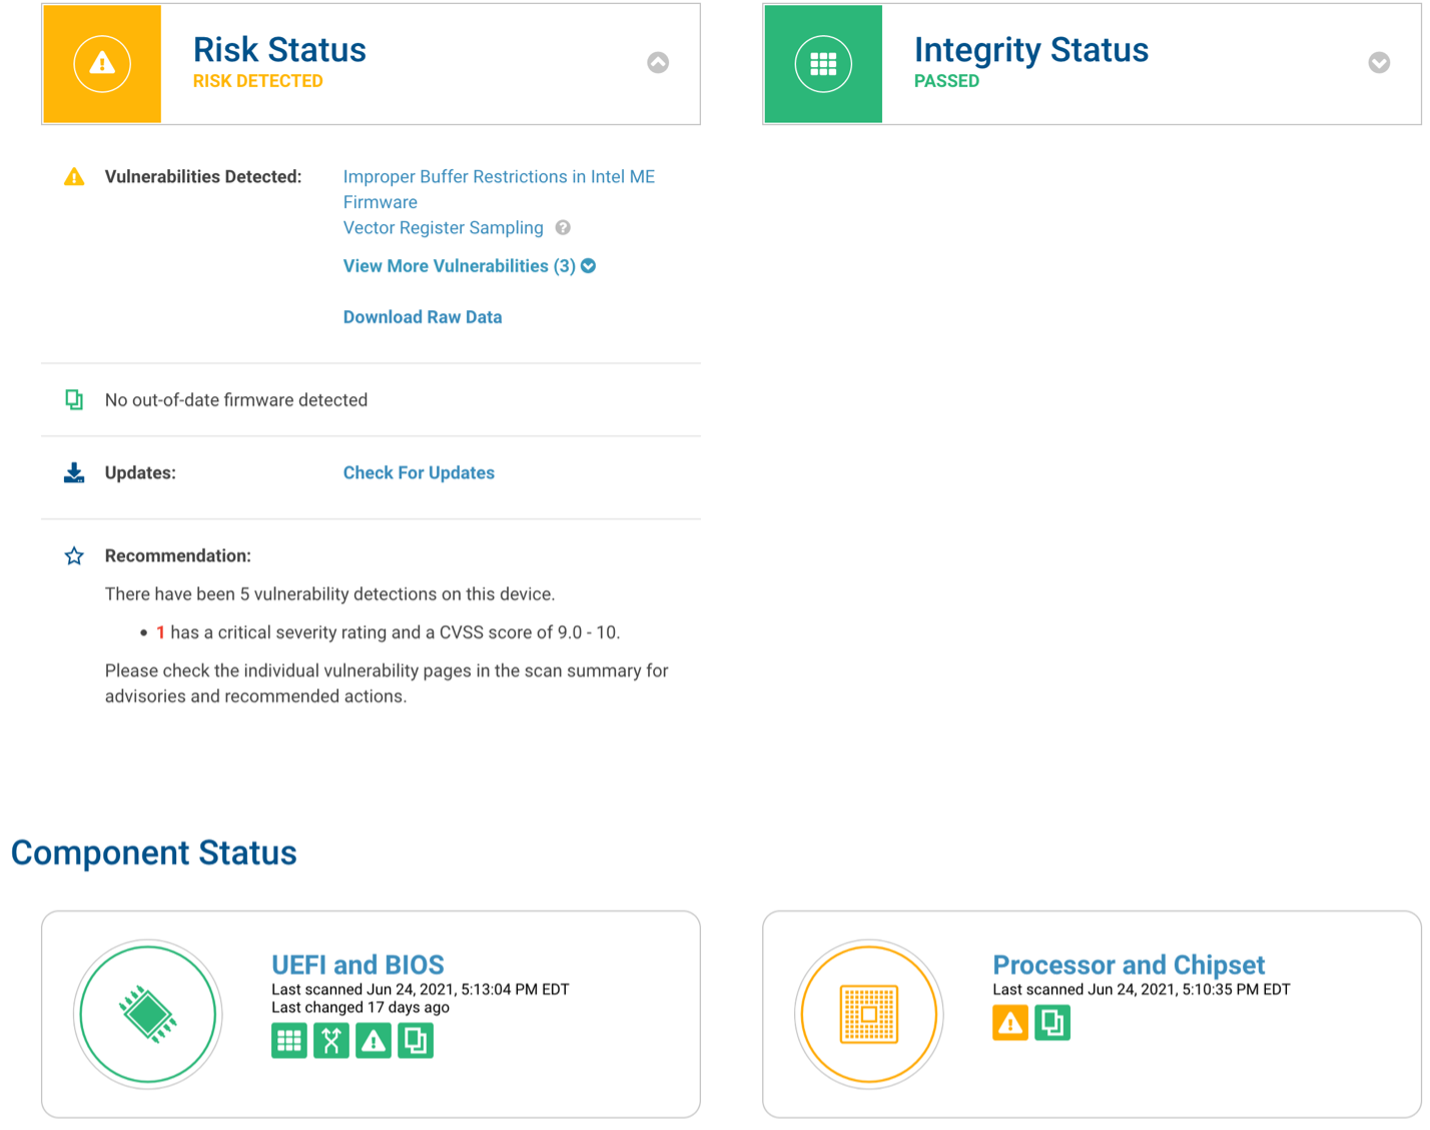
Figure 3-2 provides an example of details found on a scanned device. The device registration steps were performed, and a scan was conducted automatically. Although there were vulnerabilities found in the chipset firmware, Eclypsium determined that no updates were available. Additionally, Eclypsium provided vulnerability and integrity information for device components such as the CPU, Basic Input/Output System (BIOS), and Peripheral Component Interconnect (PCI) devices; this was outside the scope of this project.
Figure 3‑2 Eclypsium Dashboard Device Details
3.4 Updating Firmware
There is an update script from Eclypsium for automatically finding firmware updates for endpoints. The script downloads the new firmware, and then the administrator performs the update manually with the downloaded file. After obtaining the script (currently a python file) from Eclypsium, follow these steps:
Ensure the endpoint you want to update the firmware on has the required python dependencies installed so it will be able to execute the script.
Put the script on the machine and run it. It will automatically find and download the latest firmware update file.
Run the downloaded file to update the firmware.
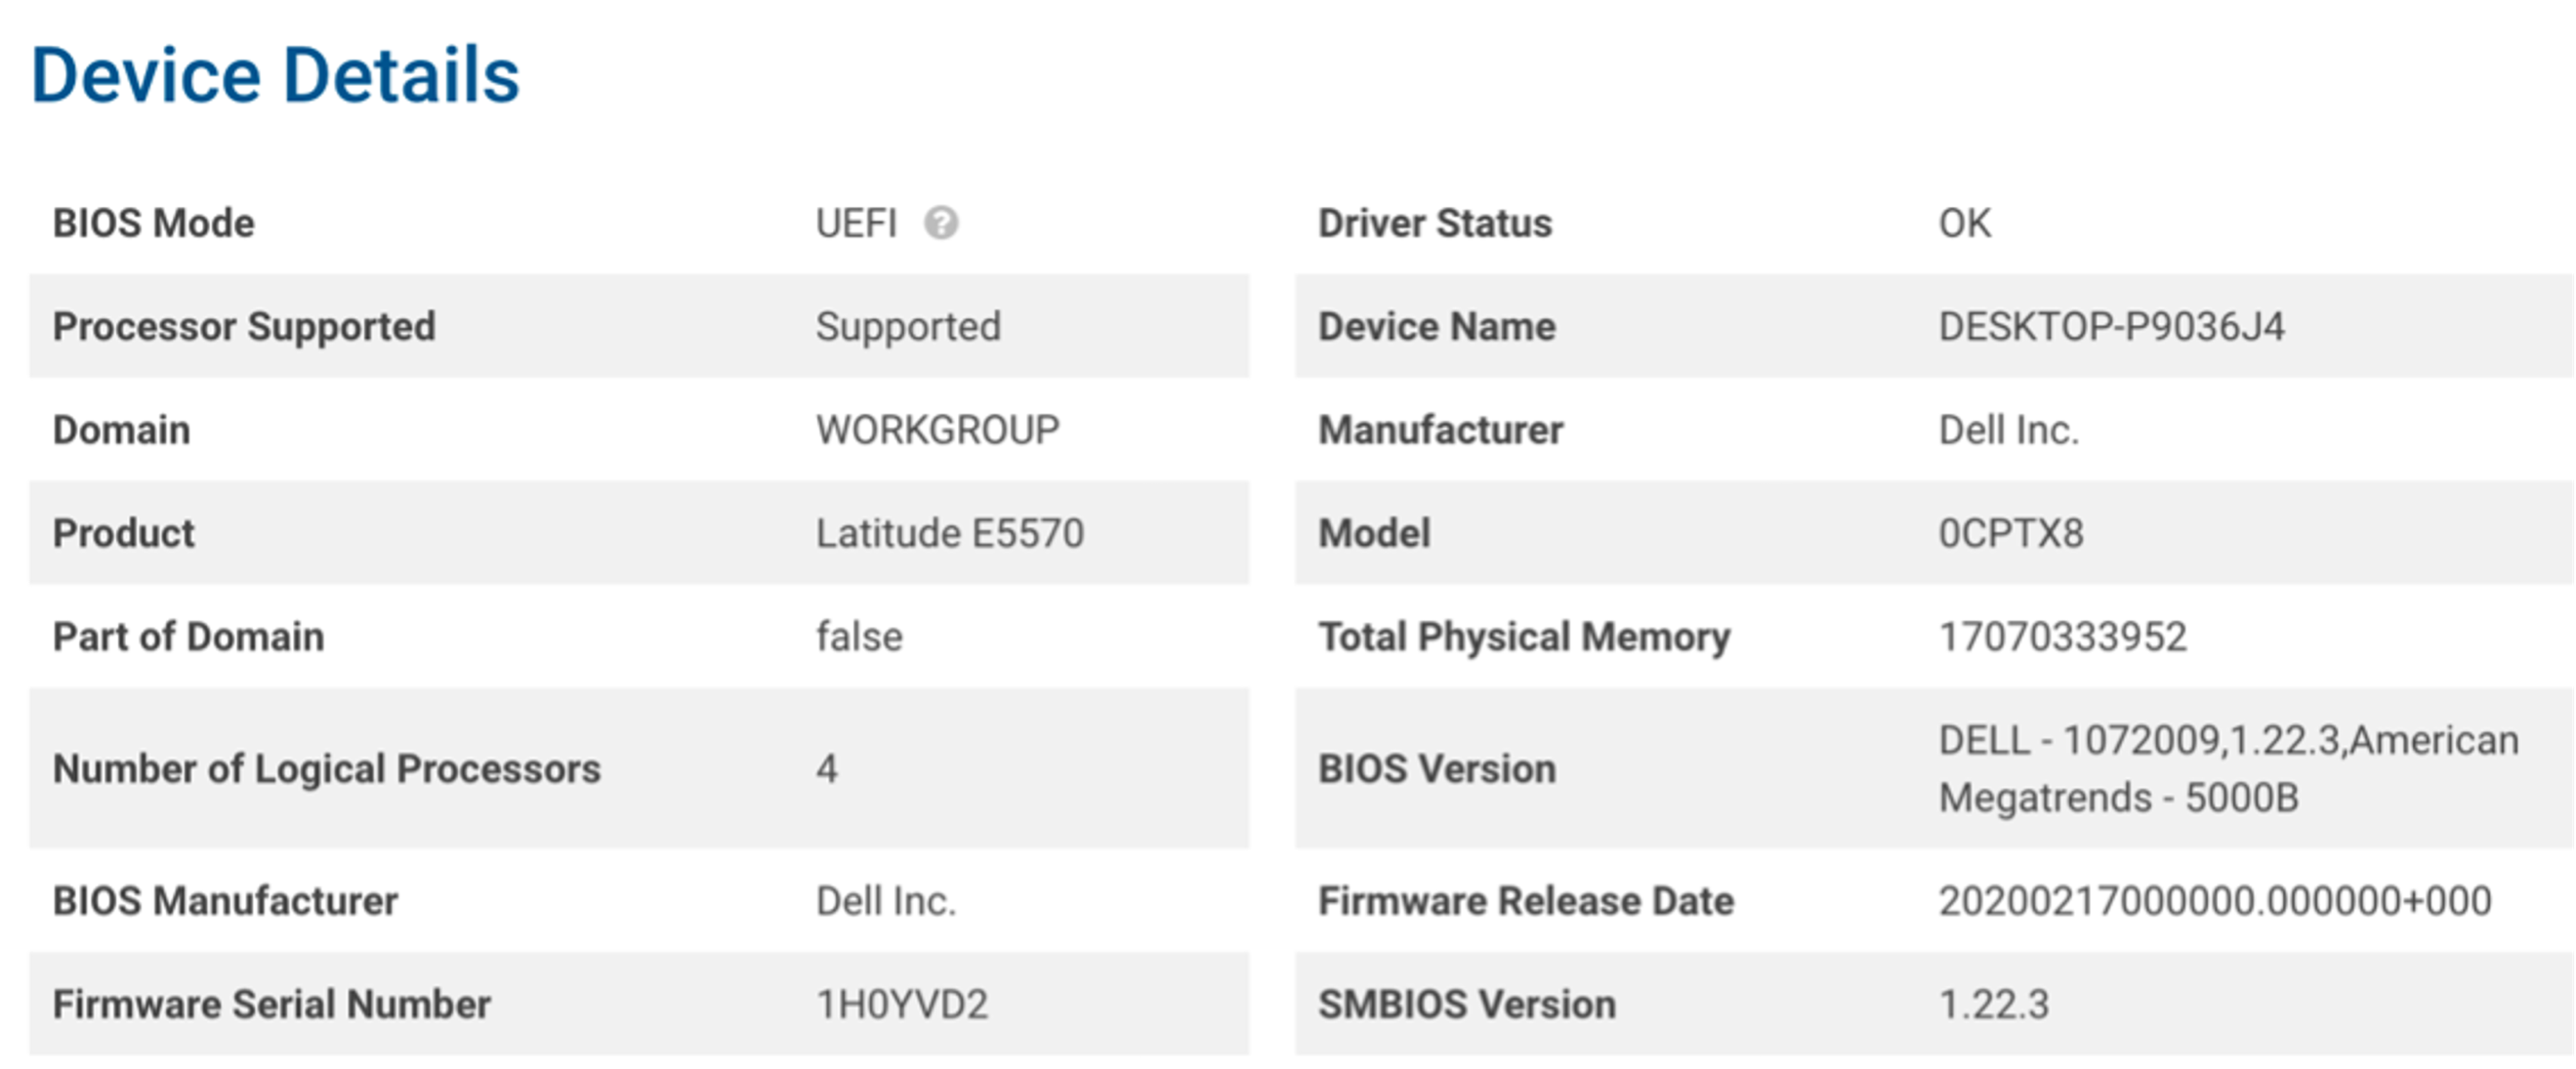
Figure 3-3 and Figure 3-4 show the characteristics of a System Management BIOS (SMBIOS) before and after running the Eclypsium firmware update script. Note that the SMBIOS Version has changed from 1.11.4 to 1.22.3 after running the update script and manually installing the downloaded firmware binary.
Figure 3‑3 SMBIOS Before Eclypsium Firmware Update Script
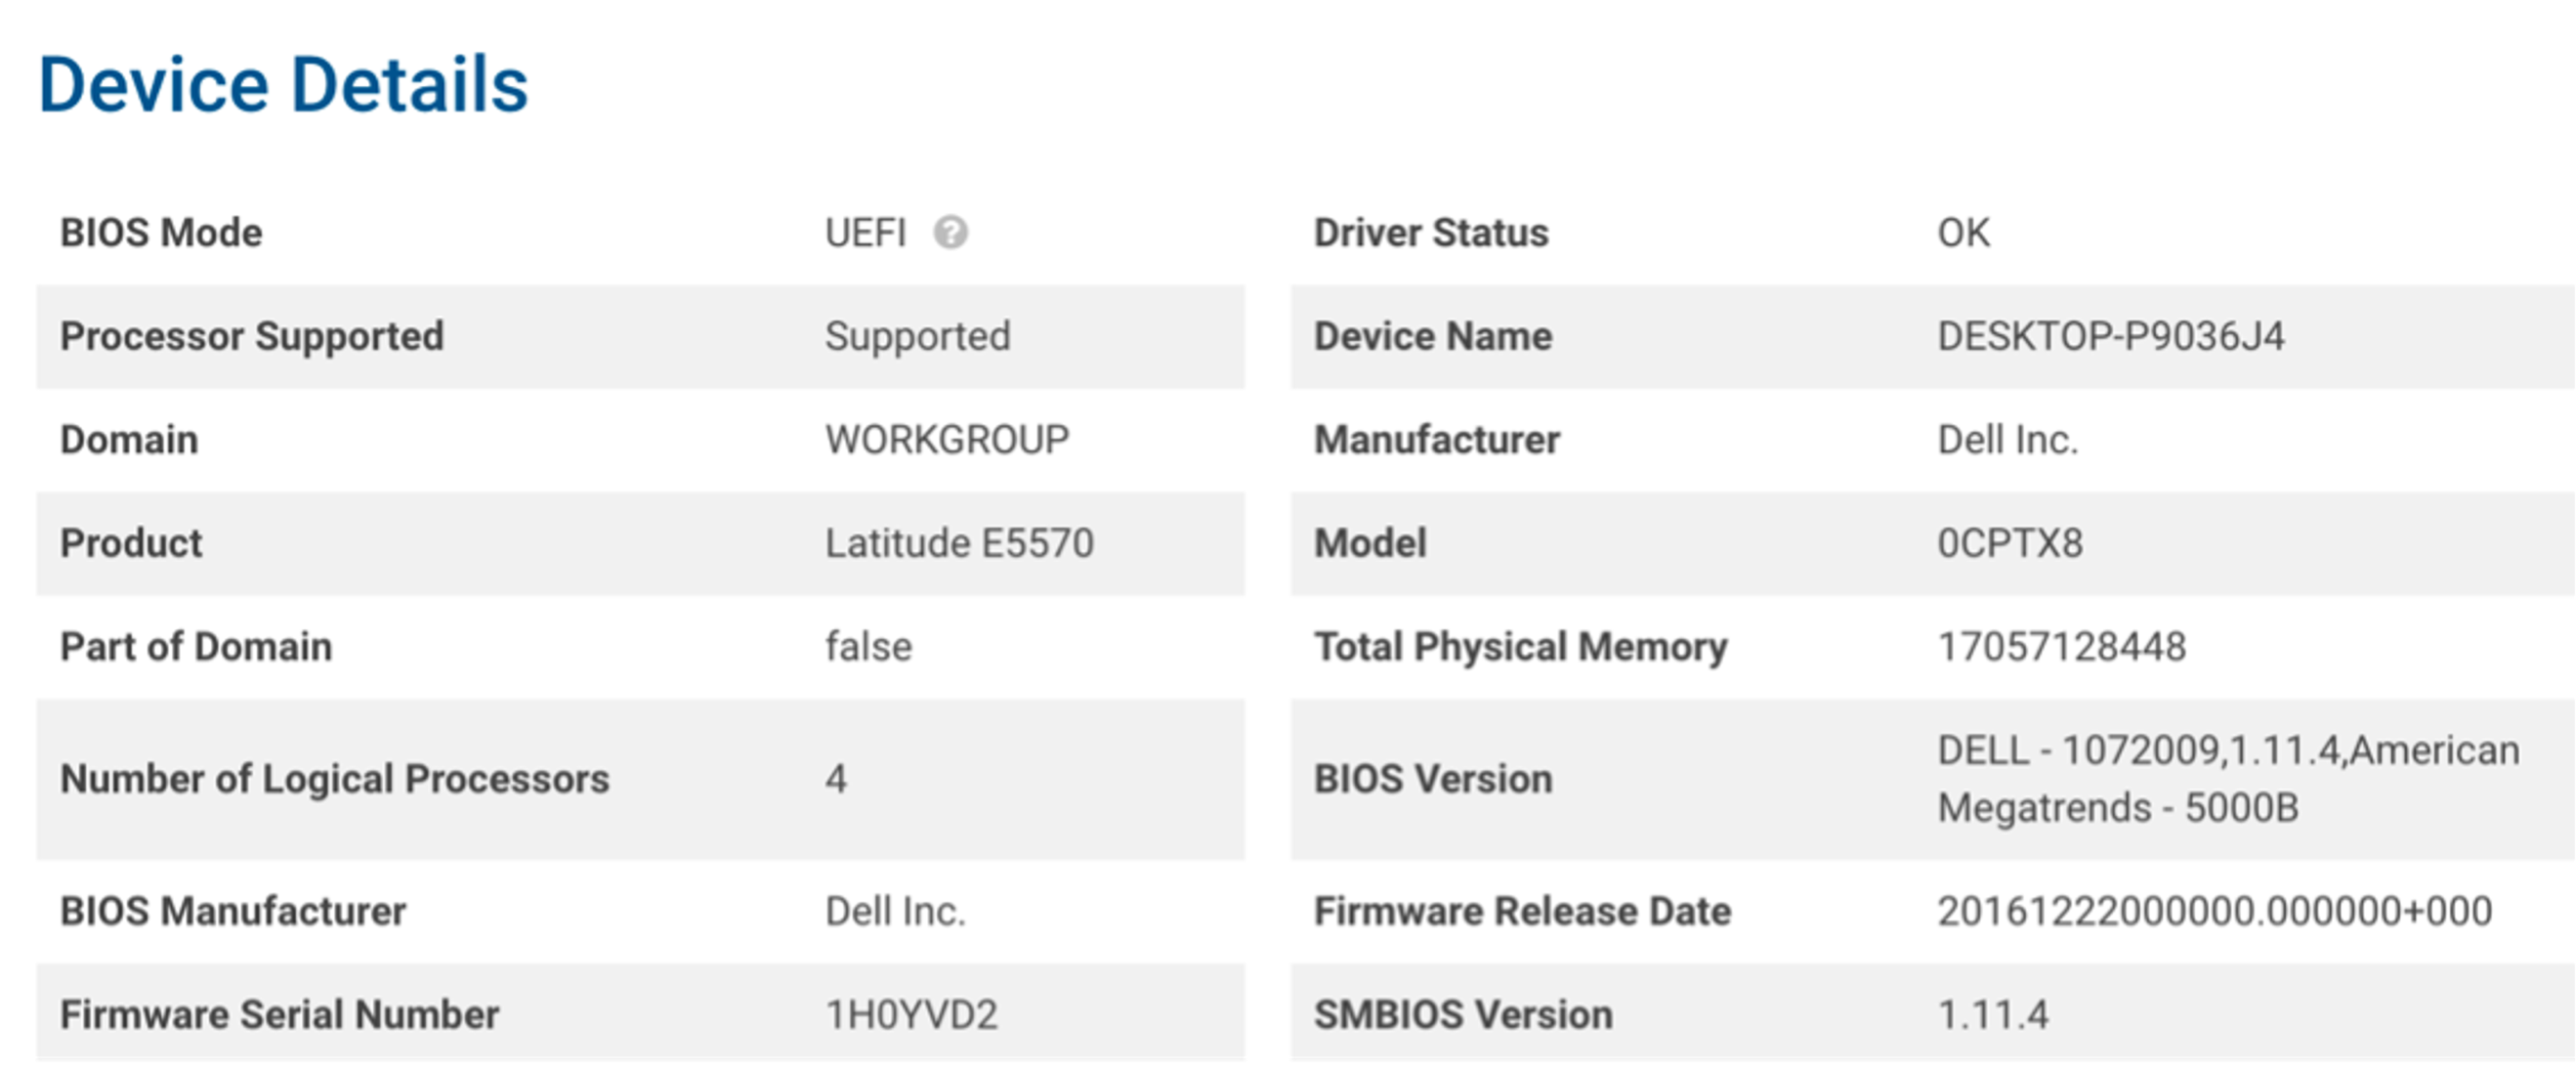
Figure 3‑4 SMBIOS After Eclypsium Firmware Update Script
3.5 Updating Eclypsium
The Eclypsium on-premises upgrade process required downloading a script and running it in the same folder Eclypsium was installed in. Our experience with updating Eclypsium was a successful one-step process. After running the script and restarting the Eclypsium service, the dashboard was updated. Eclypsium provides materials to customers on how to update their on-premises installations.
The cloud-hosted version of Eclypsium updates automatically, with no user interaction required. The on-premises version of Eclypsium is not updated automatically because it is tied closely to environment policies. Eclypsium users will receive a notification on the main console screen when updates are available. Managed endpoints can be configured to automatically update the installed endpoint driver or update manually if needed.
4 VMware
In our build we used VMware vRealize Automation SaltStack Config 8.3.0 to provide configuration management, vulnerability management, and patch deployment. SaltStack Config was used to manage Windows workstations and servers, a macOS laptop, and Linux/Unix-based VMs and servers. A full list of OSes that SaltStack Config can manage can be found here.
VMware vRealize Automation SaltStack Config is deployed with a “Salt master” server that manages endpoints via an installed agent referred to as the “Salt minion”. In the build, the following SaltStack Config server components were deployed on a single VM running CentOS 7:
Salt master: The Salt master service provided the main connection between SaltStack Config and the targeted endpoints running the minion agent. The Salt master plugin also communicated with the backend PostgreSQL database to access stored jobs and job configuration files.
Returner as a Service (RaaS): RaaS provided the communication between the SaltStack Config web user interface and connected Salt master nodes.
PostgreSQL database: RaaS used a PostgreSQL database to store minion data, the output from job returns, event data, files, local user accounts, and settings for the user interface.
Redis database: RaaS used a Redis database for temporary storage for items such as cached data. It also used this database to hold queued work for deployment.
4.1 VMware vRealize Automation SaltStack Config Installation and Configuration
VMware vRealize Automation SaltStack Config and its components listed above were installed via the SaltStack installer script on a CentOS 7 VM, with hardware details included in Section 1.4. SaltStack Config has the following software dependencies:
OpenSSL
Extra Packages for Enterprise Linux (EPEL)
Python cryptography
Python OpenSSL library
More information on SaltStack Config requirements can be found here.
The SaltStack Config installation process consists of the following steps:
Obtain the SaltStack Config installer zip file from your SaltStack representative.
Unzip the zip file on the desired installation node.
Run the setup_single_node.sh script.
Allow port 443 access for reaching the SaltStack Admin Web graphical user interface (GUI).
Allow port 4505 and 4506 access for communication between the Salt master and minion agents.
More information on installing SaltStack Config can be found here.
4.2 Salt Minion Agent
The Salt minion agent is how SaltStack Config communicates with endpoints to perform configuration. The minion agent needs to be installed on any endpoints that will be managed by SaltStack Config. The minion agent is available for various OSs and can be found here along with OS-specific installation instructions.
The minion agent can be installed and configured with the following steps:
Edit the minion agent with the IP address of the Salt master server. Note that by default, the minion will use the DNS name of ‘salt’ when trying to connect to the Salt master server. On Linux-based systems the configuration file located under /etc/salt/minion can be edited to use custom IP addresses or hostnames instead. On Windows-based systems, this information can be edited using the minion configuration wizard.
Accept the minion key.
The Salt minion agent uses a public/private key pairing for communicating with the SaltStack Config server. The key generation process takes place automatically on the client system, and the minion public key is automatically sent to the Salt master server. The public key of the minion agent will need to be accepted on the Salt master server so that secure communication can take place. Steps for accepting a new minion key can be found here. Note that jobs will not be able to be issued to endpoints unless the minion key is accepted in the SaltStack Config console.
4.3 SaltStack Config Jobs
SaltStack Config uses jobs to run remote execution tasks on endpoints. The build utilized these jobs to provide configuration management capabilities. Jobs were created, scheduled, and executed via the SaltStack Config web console.
For brevity, and because jobs are highly customizable, this guide includes one example of creating and running a job. The example job demonstrates removing 7zip version 19 from a Windows endpoint in an emergency mitigation scenario, where an administrator chooses to remove a vulnerable product that cannot be patched. The following are the steps used in the build to set up and execute this job:
Click Config > File Server.
Click base from the saltenv drop-down menu. Base corresponds to one of the default file directories that are created to hold configuration files.
Type windows/7zip.sls for the path name.
In the field name below, add the information in the screenshot, then click SAVE.
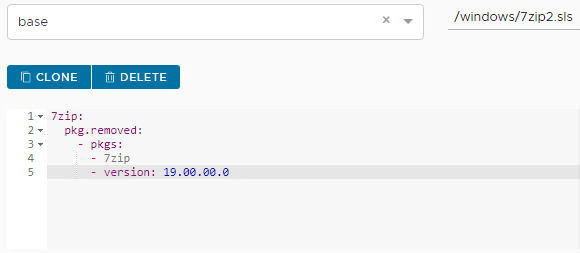
Next, click Config > Jobs, then click Create Job. Edit the fields listed in Table 4-1 so they have the specified values.
Table 4‑1 Specified Values for Creating “Uninstall 7zip” Job Using SaltStack Config
Field |
Value |
Explanation |
|---|---|---|
Name |
Uninstall 7zip |
This is the name of the job. |
Command |
Salt |
The salt command allows for all salt functions to be loaded and available for choosing. |
Targets |
Windows |
This field allows for different groups of machines to have configurations applied to them. The default way that SaltStack groups machines is by OS; however, other target groups can be created based on device attributes. |
Function |
state.apply |
The state.apply function allows for custom state files or .sls configuration files to be applied to an endpoint. |
Environments |
Base |
Base corresponds to one of the default file directories that are created to hold configuration files. |
States |
windows.7zip |
The states field corresponds to the file with the configurations that are to be pushed down to the endpoint. In this example, this corresponds to the uninstallation of 7zip configuration file. |
Click Minions, then select the Windows Target Group.
Click Run Job. Under the Job drop-down menu, select Uninstall 7zip.
Select Run Now.
4.4 SaltStack SecOps
SaltStack SecOps, an add-on component for vRealize Automation SaltStack Config, was utilized to provide vulnerability and patch management capabilities. SaltStack SecOps can be configured to run scheduled assessments of endpoint vulnerabilities with the following steps:
Click Protect > Policies under the SaltStack Config Web GUI.
Click Create Policy.
Enter “Endpoint Scan”.
Under Targets, select All Minions. This performs a scan of all connected network endpoints regardless of OS. A scan targeting a specific OS or other defined target group could be performed instead by selecting a different value.
Under Type, choose Repeat Date & Time, and fill out the other options as shown.
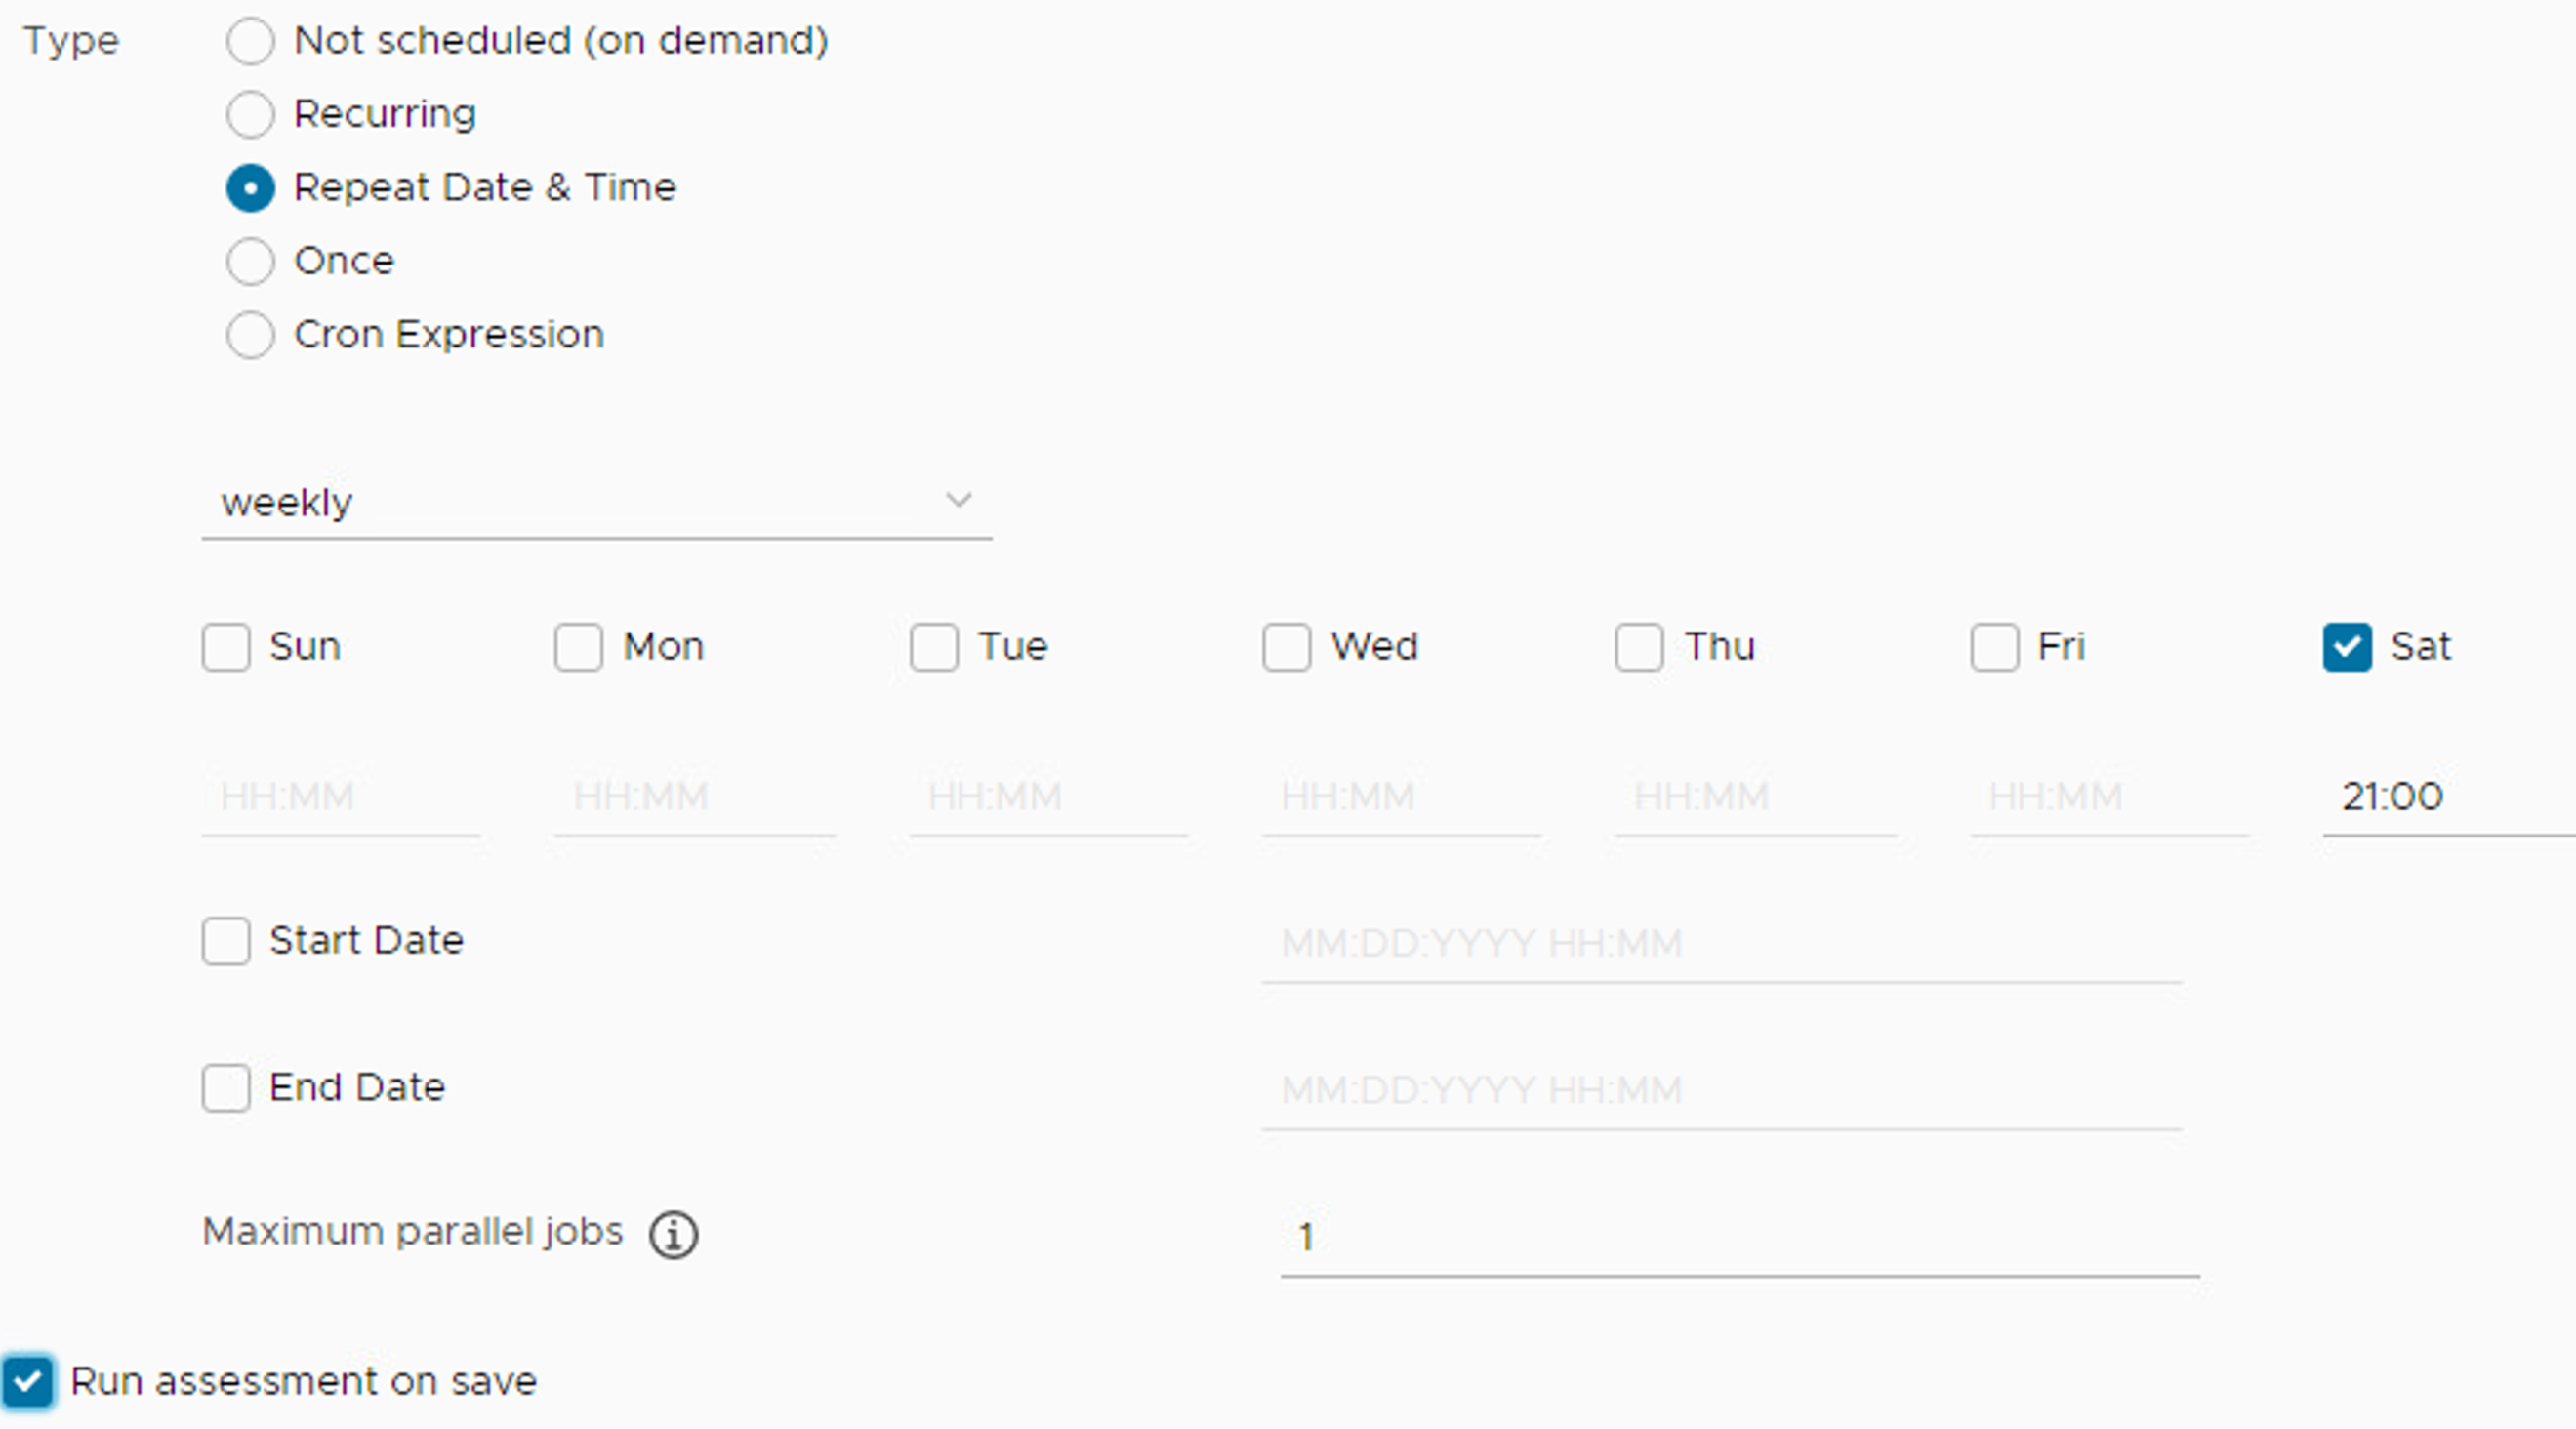
Make sure that Run assessment on save is checked.
Click Save. The above scan will automatically run and be scheduled to run weekly on Saturdays at 9 p.m. without further user interaction.
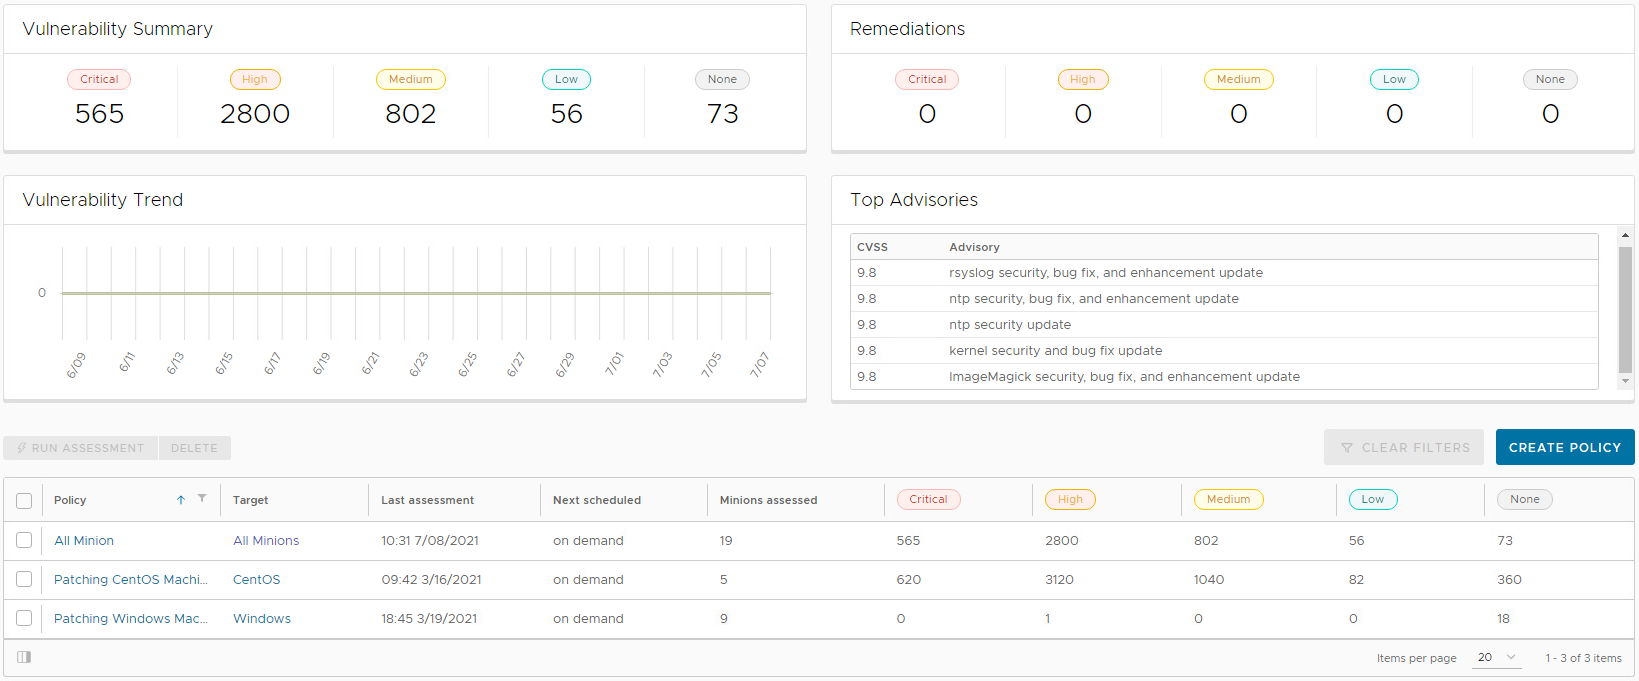
After running the scan, the Vulnerability Summary and Top Advisories dashboard begins to populate, as captured in Figure 4-1. The image shows that the SaltStack SecOps engine has started collecting vulnerability information and categorizing it by severity level. The Top Advisories dashboard shows vulnerabilities detected in the scan that have the highest CVSS score. In the scan, the top advisories all have scores of 9.8.
Figure 4‑1 SaltStack SecOps Vulnerability Summary and Top Advisories Dashboard
SaltStack SecOps can also be used to remediate endpoints. To do so, follow these steps:
Click the “Endpoint Scan” policy that was created previously.
From the resulting list, either single remediations can be selected, or you can choose to select all remediations.
When the desired patches are selected, click Remediate.
4.5 vRealize Automation SaltStack Config Maintenance
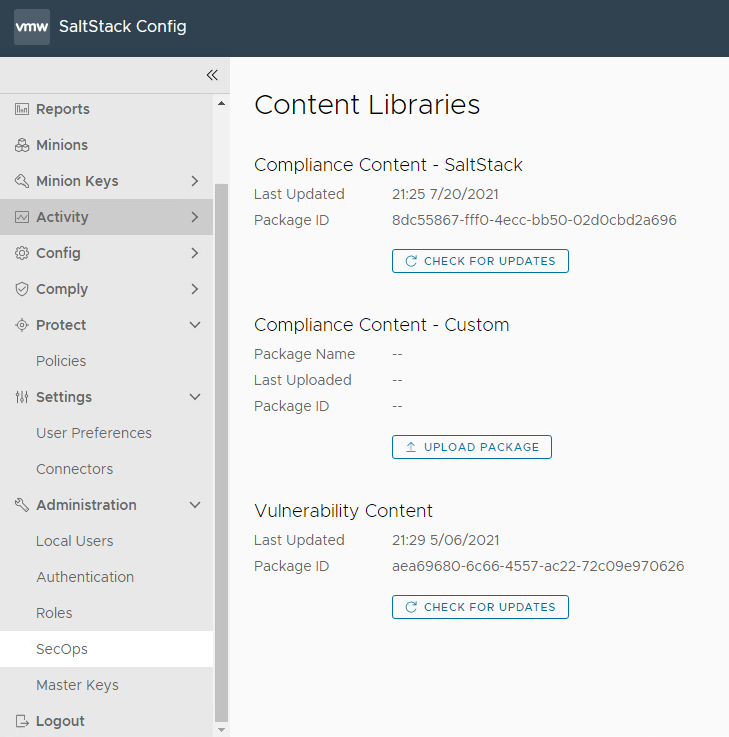
All SaltStack Config components should be kept up to date. You are required to have an active VMware account to download updated software. Software for all SaltStack Config components can be downloaded from here. To upgrade SaltStack Config, follow the directions in Section 10 (Upgrade from a previous version) of Installing and Configuring SaltStack Config.
SaltStack vulnerability data is kept up to date automatically without user interaction. To perform a manual check for updates, perform the following steps:
Log in to the SaltStack web console.
Navigate to Administration > SecOps.
Click CHECK FOR UPDATES under the Vulnerability Content section.
5 Cisco
In this implementation, we used the Cisco FTD firewall to provide network access management capabilities and Cisco ISE to provide device discovery capabilities. The Cisco FMC product was utilized to manage Cisco FTD. All Cisco products in the build were virtual appliances that were deployed in VMware ESX via Open Virtualization Formats (OVFs) downloaded from the Cisco website.
5.1 Cisco FTD and FMC
Cisco FTD is a next-generation virtual firewall that was used to provide networking to the patching architecture. The build utilized Cisco FTD 6.4.0 to enforce network access control using firewall rules. Cisco FTD was deployed and managed in the lab via a separate Cisco FMC VM. This section walks through installing and configuring Cisco FTD and Cisco FMC.
5.1.1 Cisco FMC Installation
Cisco FMC was utilized to manage an instance of Cisco FTD. With this in mind, it is suggested to set up FMC first. Installing and setting up the FMC virtual appliance involved the following steps:
Download the FMC VM tar file from the Cisco Downloads page. Note that you will need a Cisco account to download it.
Perform initial configuration of the FMC. This included tasks like accepting the End User License Agreement (EULA), setting a password, and configuring network settings.
5.1.2 Cisco FTD Installation
For our build, installing the Cisco FTD VM consisted of the following steps:
Deploy the Cisco FTD VM using the VMware vSphere web client.
Complete the Cisco FTD VM setup using the command line interface (CLI). This included performing initial configuration, such as setting up network information, user credentials, management mode, and firewall mode. In our build, we chose no for “Enable Local Manager” to ensure that the FTD was managed by the FMC from Section 5.1.1. The FTD was set to routed firewall mode, which allowed for IP-based separation between subnets.
Register Firepower Threat Defense to the Firepower Management Center. This included configuring network information for the management port, which was the IP address that the management center VM communicated with.
5.1.3 Licensing Cisco FTD with Cisco FMC
When first logging into the Cisco FMC, a license needs to be applied to the Cisco FTD instance. Instructions can be found here. The smart licensing feature allows for individual features to be licensed to meet organizational needs. The license types listed in Table 5-1 were applied to our build, and they granted the specified capabilities.
Table 5‑1 License Types and Granted Capabilities for Cisco FTD
License Type |
Granted Capabilities |
|---|---|
Base |
User and application control, switching, routing, network address translation (NAT) |
Threat |
Intrusion detection and prevention |
Malware |
Threat intelligence for detecting malware |
URL Filtering |
Category and reputation-based uniform resource locator (URL) filtering |
AnyConnect VPN Only |
Remote access virtual private network (VPN) configuration |
5.1.4 Cisco FTD Initial Network Configuration
After licensing the Cisco FTD instance, the next step is to configure networking information for the firewall interfaces. Security zones need to be created; they allow firewall interfaces to be grouped together in order to apply configuration and policy. To create security zones, perform the following steps:
Choose Objects > Object Management.
Choose Interface from the list of object types.
Click Add > Security Zone.
Enter a name.
Select Routed from Interface Type.
Click Save.
The security zones described in Table 5-2 were created in support of our build:
Table 5‑2 Security Zones Created for Cisco FTD
Security Zone |
Zone Description |
|---|---|
Outside Zone |
Contained the wide area network (WAN) interface that sat between the firewall and the internet gateway |
Endpoints |
Contained the interface that communicated with all lab endpoints that represented end user devices and servers |
Shared Services |
Contained shared common services such as DHCP and DNS |
Patching Products |
Contained all deployed patching products and services |
The next step is to edit each firewall interface with the correct IP address for your organization and the appropriate security zone:
Select Devices > Device Management and click Edit (
 ) for your FTD device. The Interfaces page is selected
by default.
) for your FTD device. The Interfaces page is selected
by default.Click Edit (
) for the interface you want to edit.Enable the interface by checking the Enabled check box.
Under the Security Zone drop-down, select the correct security zone.
Under the IPv4 tab, enter the appropriate IP address information.
Click Ok.
Click Save.
The last step is to enable network address translation (NAT). Since private IP addresses cannot traverse the public internet, a NAT rule needs to be created to allow the public IP address for the firewall to be used for external network traffic from internal network endpoints using private IP addresses. To create a NAT policy, perform the following steps:
Select Devices > NAT.
Click New Policy > Threat Defense NAT to create a new policy. Give the policy a name, optionally assign devices to it, and click Save.
Click Edit (
) to edit the Threat Defense NAT policy.Click Add Rule, then select Auto NAT Rule.
Under Interface Objects, leave any under Source Interface Objects, and place Outside_Zone under Destination Interface Objects.
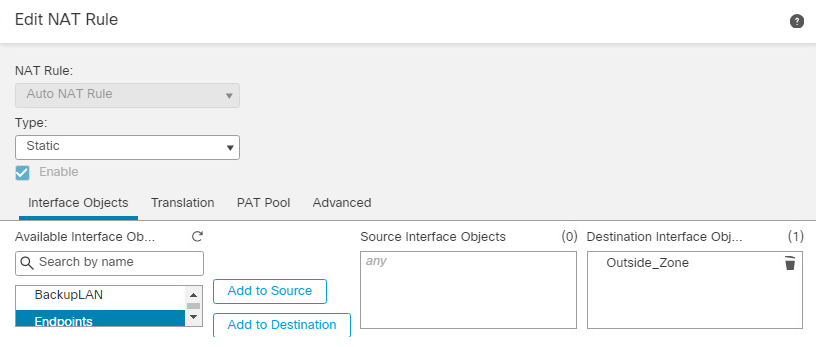
Under the Translation tab, select IPv4-Private-10.0.0.0-8 under Original Source, and under Translated Source select Destination Interface IP.
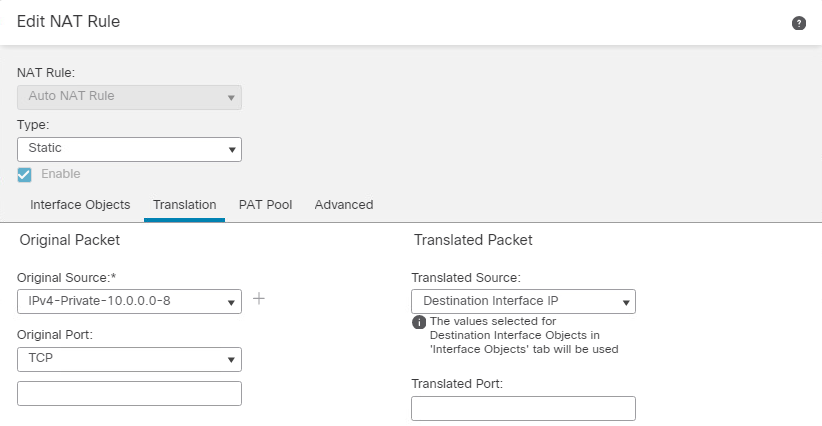
Click Ok, then click Save.
Click Deploy > Select Device > Deploy to deploy the NAT policy.
5.2 Cisco Identity Services Engine
Cisco ISE is a network administration product that allows for enforcement of administrator-created security and access control policies. Cisco ISE captures attributes about devices, such as IP address, MAC address, and OS in order to enforce custom policies. Cisco ISE can be deployed as a standalone system or as a primary and secondary node for high-availability deployments. Our build utilized a single ISE VM node set in standalone deployment.
5.2.1 Cisco ISE Installation
The installation process for deploying a virtualized version of Cisco ISE requires you to download the OVA from https://software.cisco.com/download/home and deploy it using VMware. Note that you will need a Cisco account to be able to download software from Cisco. Follow the steps here for deploying the Cisco ISE OVA template.
After deploying the ISE OVA, launch the VM console from VMware. At the Cisco ISE CLI, type setup to start the ISE setup wizard. Use it to configure hostname and IP address information and to create admin credentials for the Web Admin portal.
Lastly, Cisco ISE needs to be licensed. Follow the guidance here to find more information on licensing your ISE deployment.
5.2.2 Cisco ISE Initial Configuration
After performing initial setup and licensing, the next step is to ensure that the Cisco ISE deployment node has the correct settings and profiling configuration services running. Perform the following steps:
Click Administration > System > Deployment.
Under the General Settings tab, ensure that the options shown below are selected.
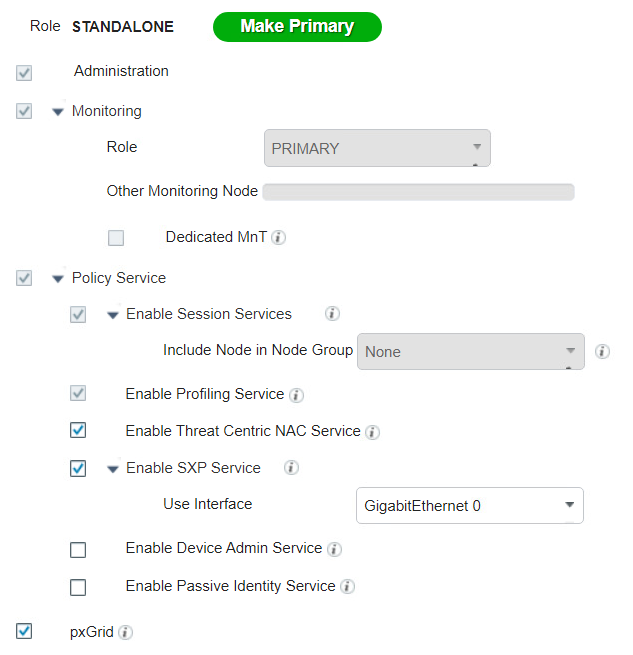
Under the Profiling Configuration tab, ensure the following options are selected. Note that a description of the various profiling services can be found on the Profiling Configuration tab. When you are done selecting the options, click Save.
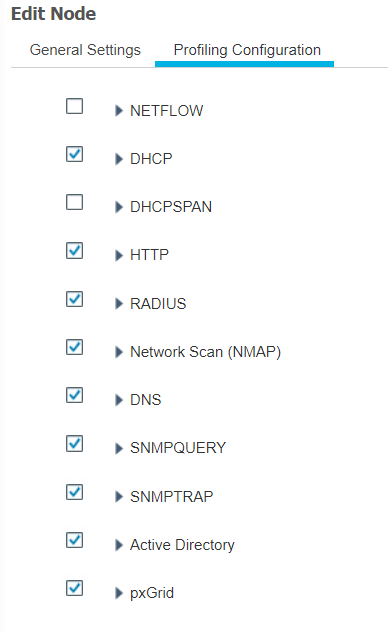
For our build, Cisco ISE needed to have an integration with AD services to perform authentication of endpoint users to the network. Cisco ISE used AD as a trusted store to authenticate users and machines to the network. To perform the integration between Cisco ISE and AD, follow the guidance here.
5.2.3 Configuring AnyConnect VPN Using Cisco FTD and Cisco ISE
By default, Cisco ISE cannot make any policy enforcement actions for devices that are not actively authenticated against it. This means that devices that are not using 802.1X authentication or the AnyConnect VPN client will not have full device attributes collected nor be subject to ISE policy rulesets. Our build utilized AnyConnect VPN integration between the Cisco FTD and Cisco ISE to demonstrate authenticating two hosts to Cisco ISE. The example assets chosen to be connected to the VPN were a Windows 10 and CentOS 7 VM. Please follow the steps here for setting up the integration.
5.2.4 Cisco Security Group Tags (SGTs)
Cisco security group tags (SGTs) are user-designated tags that can be used to group and classify devices. Each tag is then used to represent logical group privileges to inform the access policy. SGTs were used by the build to restrict access to devices that did not meet the desired organization patch level. This section covers setting up the Quarantine SGT and sharing SGTs with Cisco FTD.
First, add the Quarantine SGT to Cisco ISE with these steps:
Click Work Centers > Trust Sec > Components > Security Groups.
Click Add.
Under Name, type: Quarantined_Systems.
Under Description, type: Quarantine Security Group.
Ensure the Propagate to ACI option is checked.

After adding the Quarantine SGT, it needs to be shared with the Cisco FTD. SGTs are not shared between ISE and FTD by default. ISE will have to be added as an identity source to the firewall. This communication between the firewall and ISE takes place using pxGrid. The process for setting up SGT sharing from ISE to the firewall involves:
making sure that SGTs are published via pxGrid by Cisco ISE,
exporting the ISE pxGrid and monitoring (MNT) system certificates for importation to FTD, and
adding ISE as an identity source on the firewall.
The build used this integration to perform network access control on devices that were given the Quarantine SGT by ISE. This SGT was given by assessing an endpoint’s current patch level. See this page for step-by-step guidance on adding Cisco ISE as an identity source.
5.2.5 Cisco ISE Integration with Tenable.sc
For our build, Cisco ISE contained an integration with Tenable.sc to perform automated scanning of endpoints as they were authenticated to ISE. ISE could then take the highest CVSS score that was associated with an endpoint and, via policy, enforce network restrictions through sharing SGTs with the Cisco firewall. The build used this capability to scan devices as they connected to the network and determine whether a quarantine action should take place.
The steps for integrating ISE with Tenable.sc consist of the following:
Create a machine account for ISE to log in into Tenable.sc to launch a scan. The device is referred to as a machine account since it is used by a service and not a person.
Export the Tenable.sc Root and System certificates and import them to Cisco ISE. This step is to ensure there are no errors when Cisco tries to contact Tenable over Hypertext Transfer Protocol Secure (HTTPS) for API calls.
Configure third-party threat integrations on Cisco ISE. This will start the process of creating the integration with Tenable, including creating a Tenable adapter.
Configure the Tenable adapter. The adapter is the way Cisco ISE will communicate with Tenable, so it needs to be configured to provide login credentials and connection options.
Configure an authorization profile. This configures Cisco ISE to assess vulnerabilities via the newly created Tenable adapter.
Step-by-step guidance on integrating Cisco ISE with Tenable.sc is available here. Note: Your ISE instance will need to be version 2.7 or higher.
Once the integration between Cisco ISE and Tenable is configured correctly, vulnerability data is viewable for connected endpoints. To view vulnerability data for connected devices, go to Context Visibility > Endpoints > Vulnerable Endpoints. The collected device information, such as the example in Figure 5-1, shows the affected IP address, current user, Tenable plugin ID, and CVSS score.
Figure 5‑1 Cisco ISE View of Vulnerability Data for Connected Devices
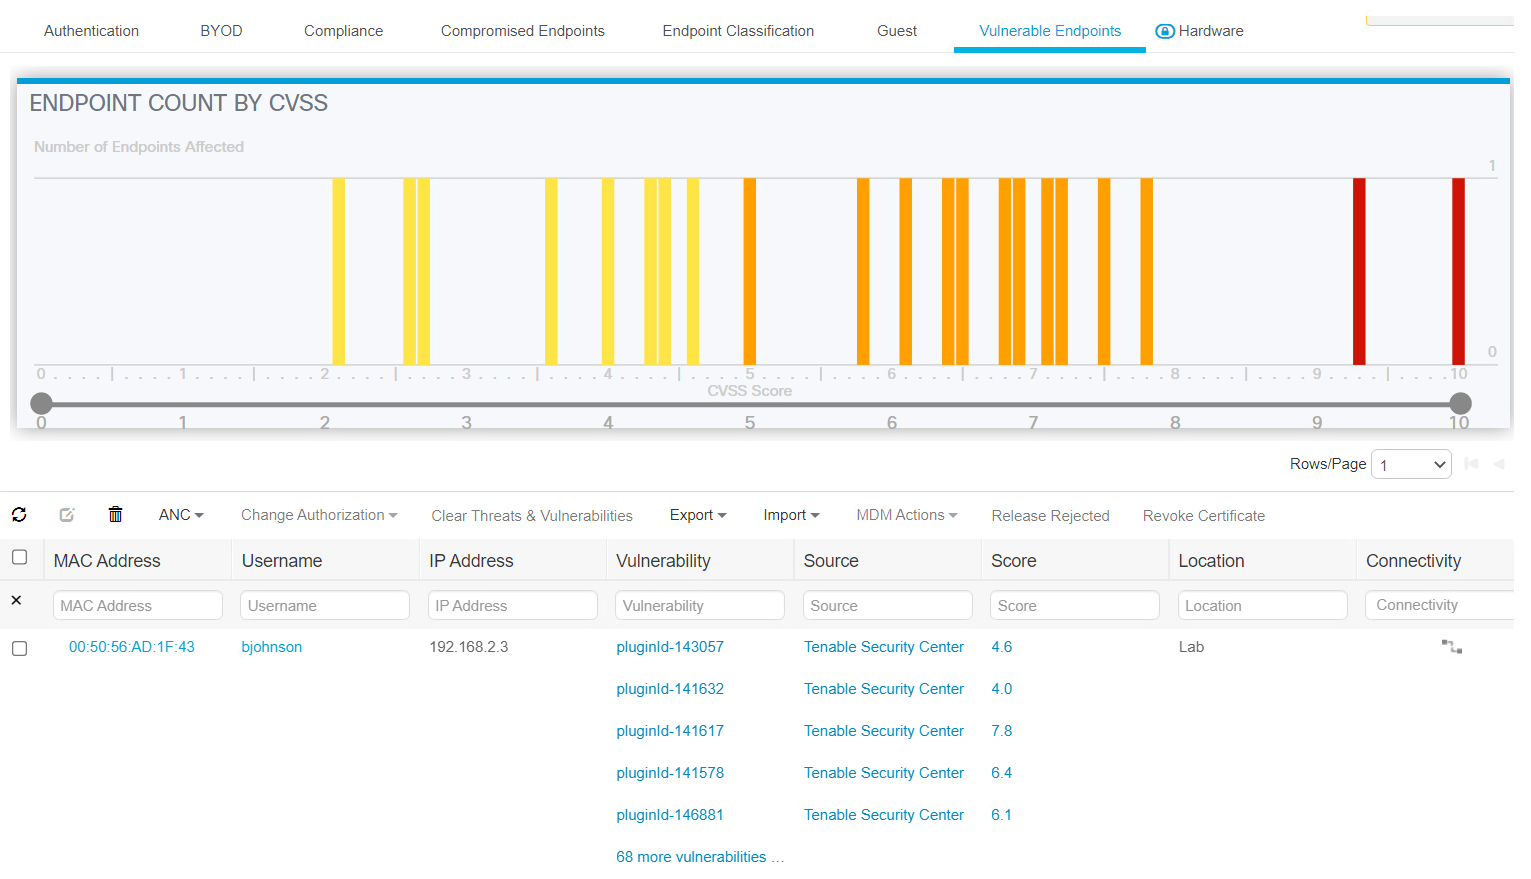
The highest CVSS score associated with a device was utilized by the patching lab to create policy that would restrict network access to devices with a vulnerability that exceeded a CVSS threshold score of 7. This threshold was designed to block devices that have high and critical severity scores.
5.2.6 Cisco ISE Integration with Cisco Catalyst 9300 Switch
For our build, Cisco ISE contained an integration with a physical Cisco Catalyst 9300 switch located in the lab network. This allowed Cisco ISE to perform 802.1x port-based authentication for devices that were connected via ethernet. The build used this capability to authenticate devices to the network and then later scanned authenticated devices to ensure they were at the appropriate patch level. The example implementation applied 802.1x authentication to port 40 of a 48-port switch.
The following is an abbreviated version of the steps we performed in the lab to integrate ISE with the Cisco Catalyst 9300 switch. For more detailed guidance, consult the following Cisco guide.
Access the admin console of the Cisco switch via a physical connection or remote protocol.
Go to global configuration mode by typing
config tand then enter the following:aaa new-model ! aaa group server radius ise server name ISE ! aaa authentication dot1x default group ise aaa authorization network default group ise aaa accounting update newinfo periodic 1440 aaa accounting dot1x default start-stop group ise ! aaa server radius dynamic-author client 10.132.6.12 server-key password ! aaa session-id common switch 1 provision c9300-48p ! radius-server attribute 6 on-for-login-auth radius-server attribute 6 support-multiple radius-server attribute 8 include-in-access-req radius-server attribute 25 access-request include radius-server attribute 31 mac format ietf upper-case radius-server attribute 31 send nas-port-detail ! radius server ISE address ipv4 10.132.6.12 auth-port 1645 acct-port 1646 key password
Configure interface 40 by typing
interface Gi10/40at the switch terminal and then entering the following information:switchport mode access authentication event fail action next-method authentication event server dead action authorize vlan 1345 authentication event server dead action authorize voice authentication event server alive action reinitialize authentication host-mode multi-auth authentication open authentication order dot1x mab authentication priority dot1x mab authentication port-control auto authentication periodic authentication timer reauthenticate server authentication violation restrict mab dot1x pae authenticator dot1x timeout tx-period 10 spanning-tree portfast
Add the Cisco Switch to ISE by navigating to Administration > Network Resources > Network Devices and clicking the Add button.
In the Network Devices field, fill out the information shown below to ensure that Cisco ISE knows the IP address of the switch, network device group information, and has a name and description for the new device.
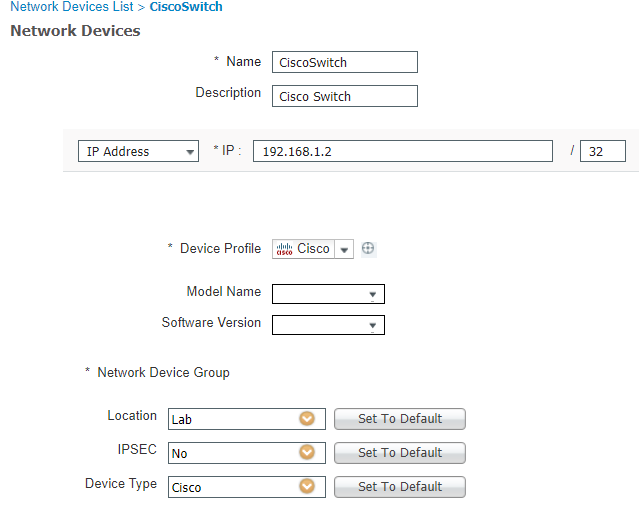
Ensure the RADIUS Authentication Settings box is checked, then fill out the information shown below. Please note that the Share Secret field corresponds with the RADIUS server key field from the last line of the configuration in step 2.
Next, select the checkbox by SNMP Settings, and fill out the information depicted below.
Click Save.
5.2.7 Cisco ISE Policy Sets
Cisco ISE policy sets are policy-based rules that are written to group devices together. Group devices can then have access control policies applied. Our build utilized policy sets to create rules that would apply network access control policies to devices that did not meet the appropriate patch level. Guidance for setting up policy sets can be found here.
5.2.7.1 VPN Policy Set
The following policy set was created for the build to enforce network restrictions on VPN devices that did not meet the desired patching threshold. As a reminder, VPN devices were chosen because network enforcement can only be performed on actively authenticated devices. The following steps walk through setting up the patching example policy set:
In the Cisco ISE Web Console, click Policy > Policy Sets.
Click the Add icon.
Under the Policy Set Name field, enter: “VPN”.
Click the plus (+) button under the Conditions field.
In the Editor field, select Click to add an attribute field.
Click the Network Device Button
 .
.Click the Device Type attribute.
Under the Choose from list or type drop-down, select All Device Types#VPNDevice.
Click the Use button.
Click the arrow under View on the newly created VPN Policy.
Under the Authorization Policy – Global Exceptions tab, add the rule depicted below. It indicates that if an endpoint has a vulnerability with a CVSS score greater than 7, the device receives the Quarantined_Systems security group tag. This rule was placed into the Global Exceptions tab because it allows these rules to be checked first. This is important, as it allows rules in this category to override any rules that may grant network access to a device.

5.2.7.2 Wired 802.1x Policy Set
The following policy set was created for the build to enforce network restrictions on wired 802.1x connected devices that did not meet the desired patching threshold. The following steps walk through setting up the patching example policy set:
In the Cisco ISE Web Console, click Policy > Policy Sets.
Click the Add icon.
Under the Policy Set Name field, type: Wired.
Click the plus (+) button under the Conditions field.
In the Editor field, select Click to add an attribute field.
Click and drag over the Wired_802.1X and Wired_MAB conditions from the Library field.
Click the Use button.
Click the arrow under View on the newly created Wired policy.
Under the Authentication Policy tab, add the policy depicted below. It allows Cisco ISE to authenticate 802.1x users against an identity store. The identity store we used was our AD users.
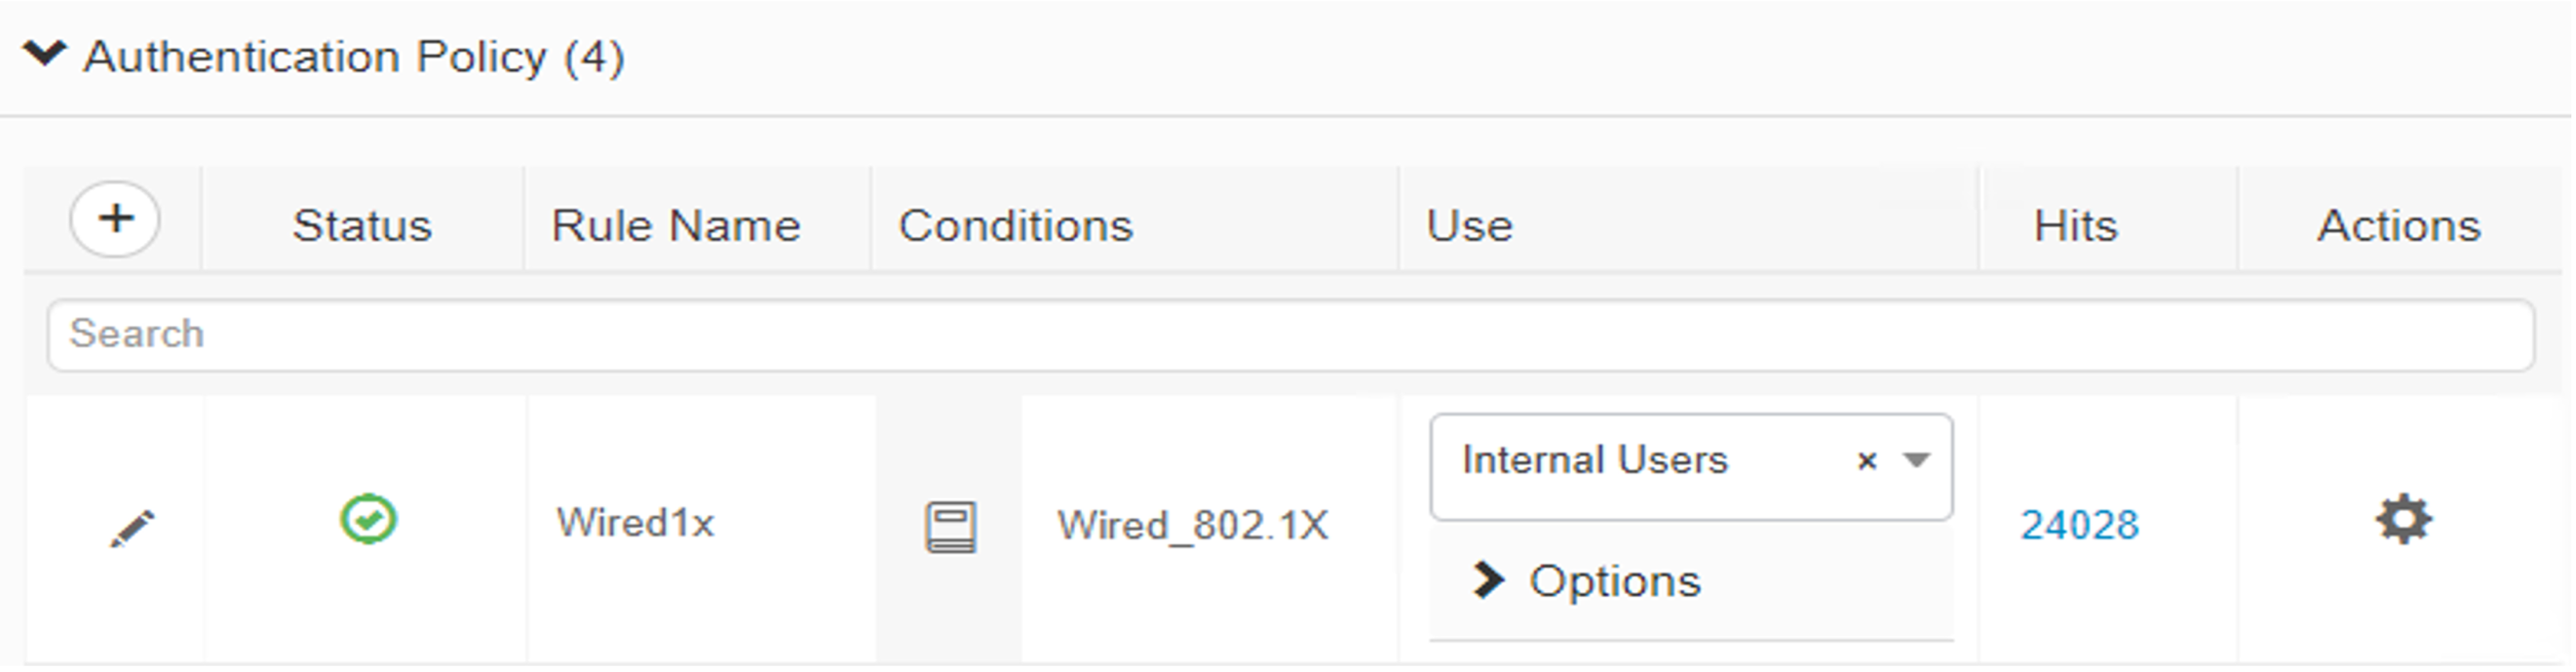
Under the Authorization Policy tab, three new rules need to be created, as the screenshot below depicts. The Posture-NonCompliant rule says that devices that are assessed and deemed not compliant should be assigned the Quarantined_Systems security group tag. The Posture rule says that devices that are marked compliant should be permitted access to the network and assigned an employee group tag. The Posture-Unknown rule states that devices that have an unknown posture, meaning the device has yet to be assessed by Cisco ISE, should be redirected to install the posture assessment module.
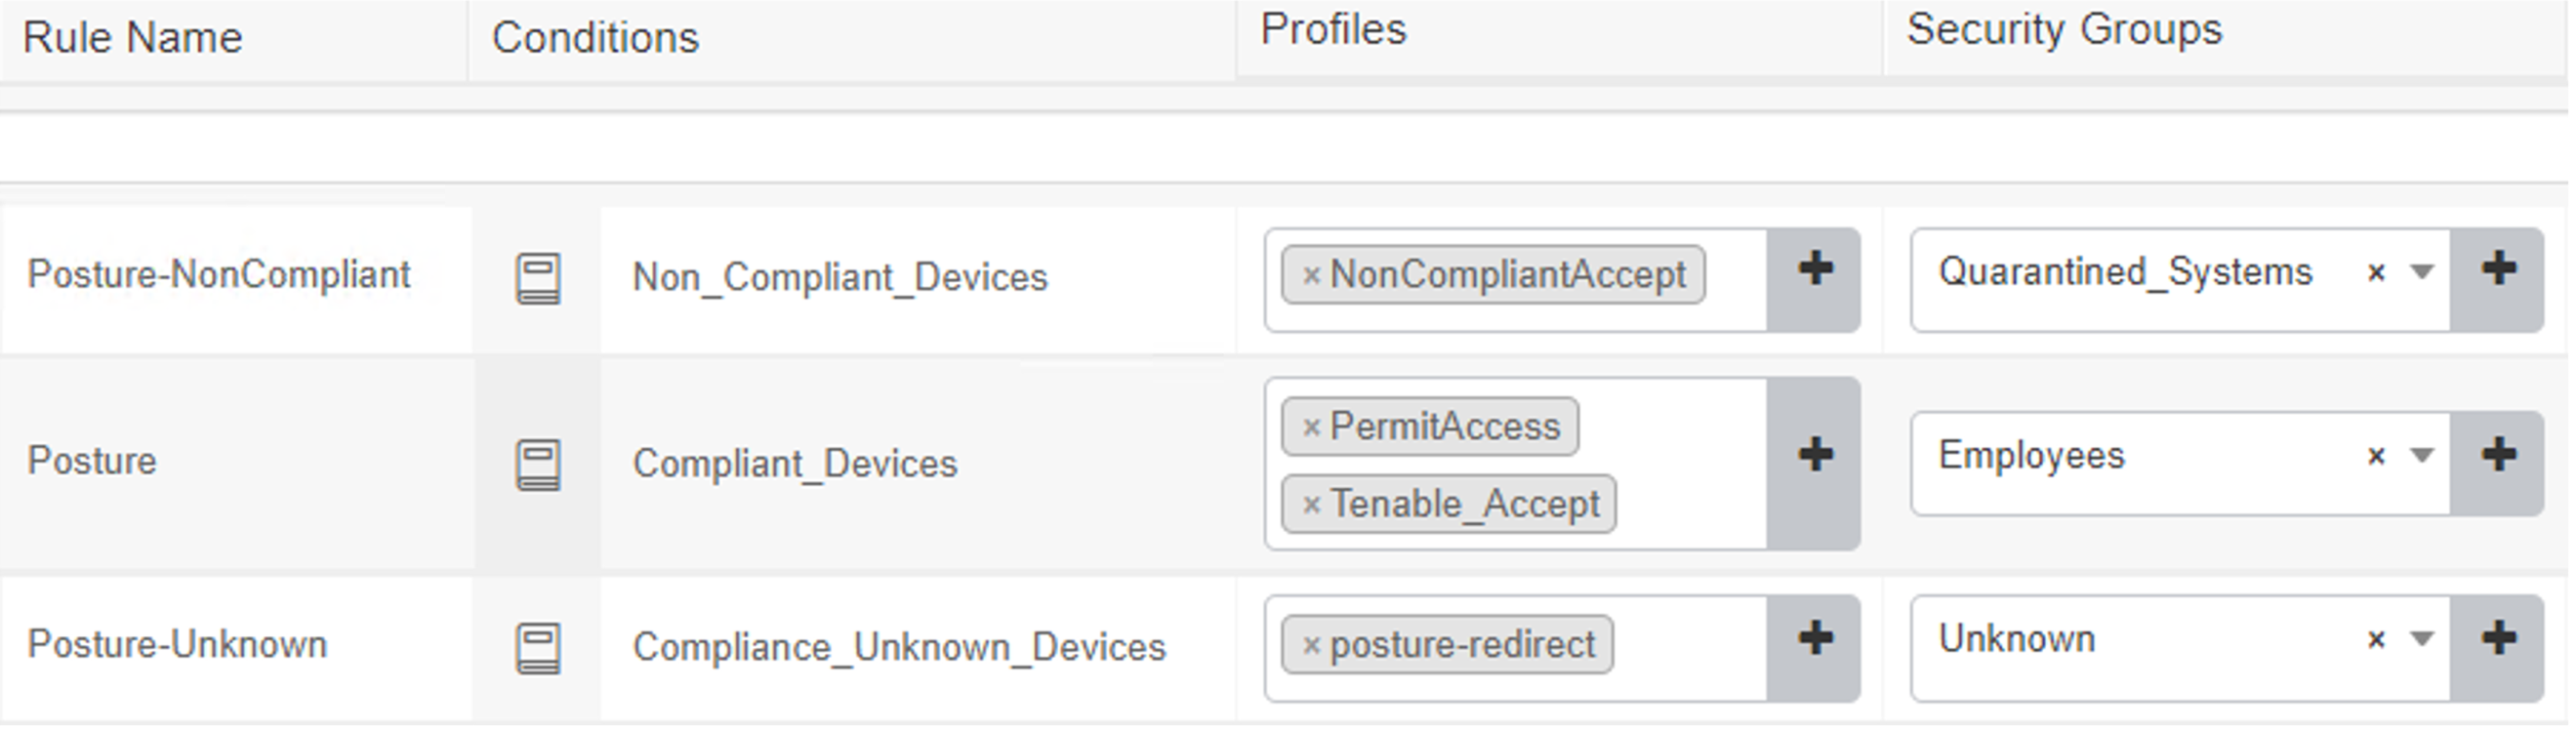
5.2.8 Client Provisioning Policy
The Cisco AnyConnect module is used by ISE to perform posture assessments of 802.1X and VPN connected devices. To ensure that users can be provisioned with the latest version of the AnyConnect module, the Client Provisioning Policy needs to be set up for Windows and macOS devices. Our build downloaded the Cisco AnyConnect Module to the machine administrating ISE, from the following Cisco download page, and uploaded the resource during the creation of the Client Provisioning Policy.
Under the Client Provisioning Policy field, the Windows and MAC OS fields were edited as shown in Figure 5-2 to provide access for endpoints to download the AnyConnect Module. For more detailed information regarding setting up Client Provisioning Resources, please consult the following page.
Figure 5‑2 Examples of Client Provisioning Policies
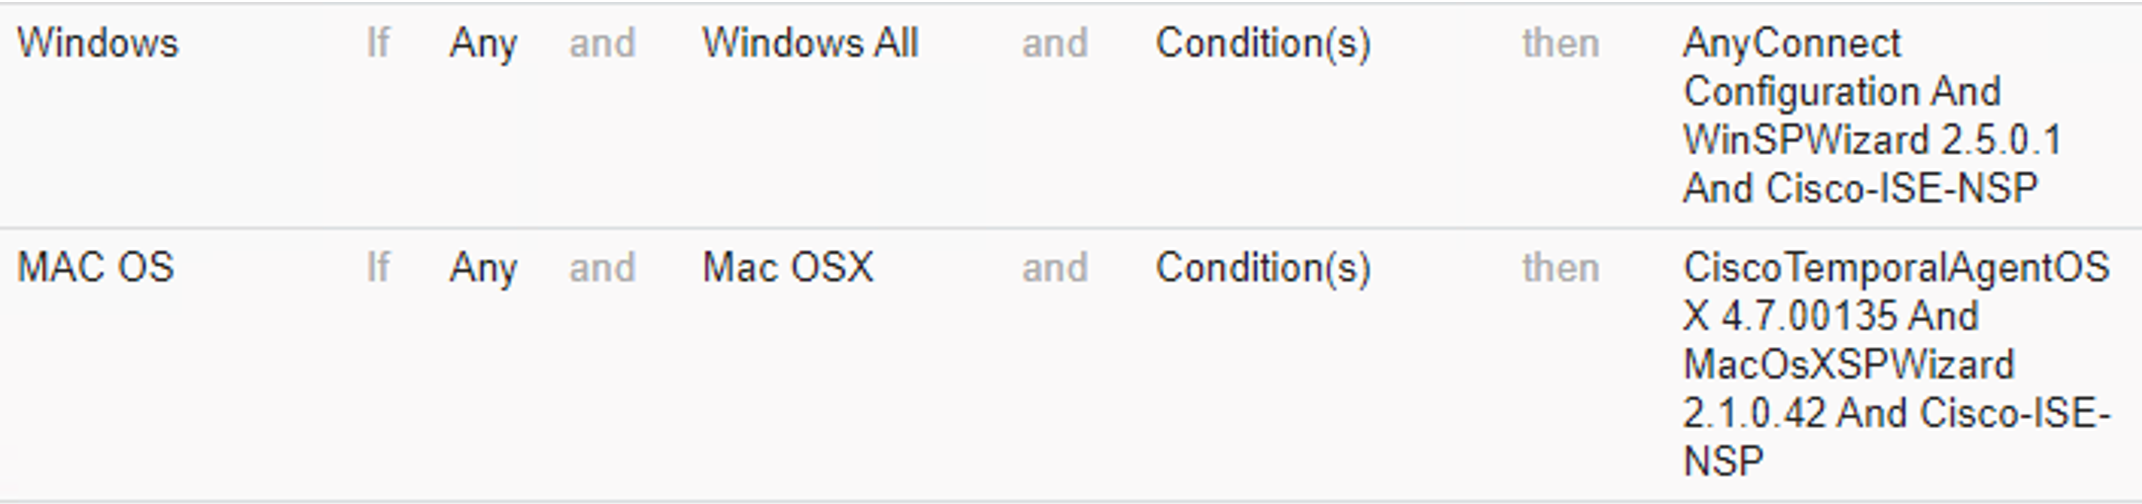
5.2.9 Posture Assessment
The lab instance utilized Cisco ISE’s ability to perform posture assessments to determine the patch level of connected devices. This collected information was used to meet the use case for isolating unpatchable assets. We configured ISE to perform a posture assessment of a physical Windows laptop. The posture assessment agent was configured to check if Windows Update reported any missing critical patches before letting a device join the network. The steps below provide an overview of the work performed in the lab instance to configure Posture Assessment; more information can be found at the following page.
In the Cisco ISE Web console, click Policy > Posture.
Under the last rule in the list, click the drop-down arrow by the Edit button and click Insert New Policy.
In the policy field, fill out the information as shown below and click Save. The policy states that users from any policy group running any version of Windows using the AnyConnect Compliance Module will be subjected to a WinPatching rule that will check for Windows updates.

Click Policy > Policy Elements > Posture > Patch Management Condition to add a new patch management condition. This step configures AnyConnect to check for missing patches for Important and Critical updates on endpoints against Windows Update Agent. Configure the Patch Management Condition with the information shown below.
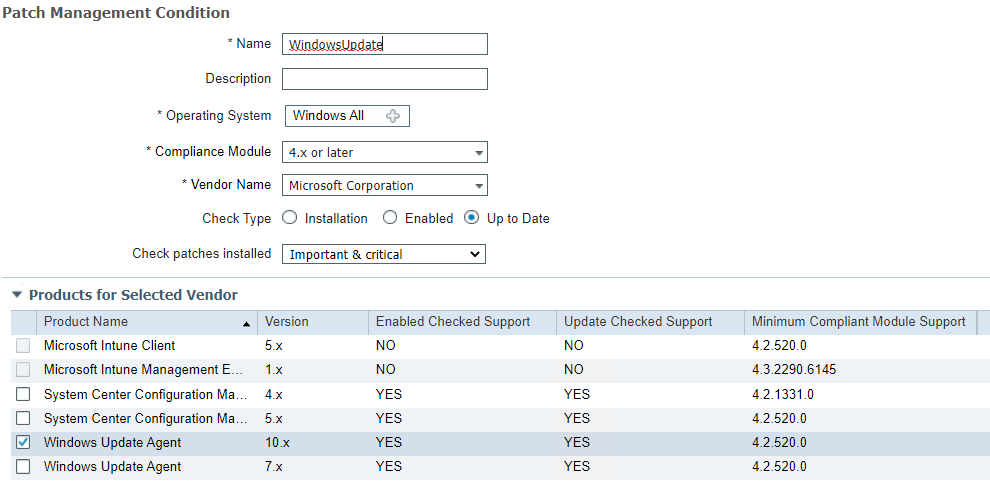
Next, in the ISE interface click Policy > Policy Elements > Results > Posture > Remediation Action. This step configures ISE to perform remediation actions on devices that are deemed non-compliant. Under the last rule in the list, click the drop-down arrow by the Edit button and then click Insert New Requirement. Add the following:

Click Save to save the new requirement.
5.2.10 Cisco FTD Firewall Rules
The Cisco FTD firewall rules were used to enforce network restrictions on the quarantined systems using the Quarantined_Systems security group tag in our build. The following steps create a basic enforcement rule:
On the Cisco FMC web console, click Policies > Access Control.
Click New Policy.
Fill out the New Policy Form with the information below. The default action for the policy is network discovery. Network discovery allows for traffic to be monitored by the firewall only without blocking traffic. This monitored traffic is then collected and can be utilized by network admins to create organizational firewall rules. Once firewall rules are in place for your organization, this item can be changed to block all traffic.
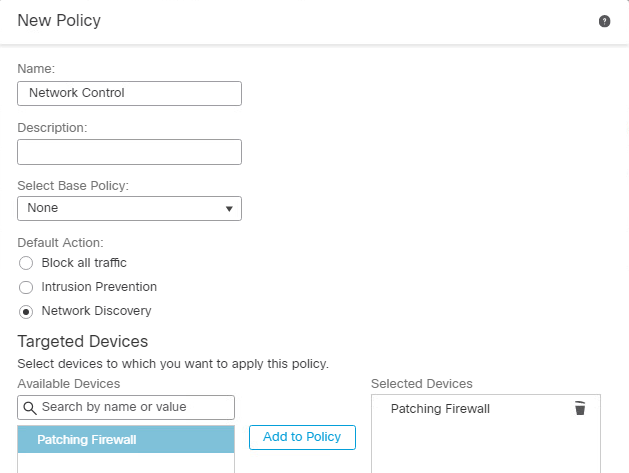
Click Save.
Click the edit button
 on the newly created rule.
Click the Add Rule button.
Under the Zones category, add the information in the screenshot below. The rule states that traffic that is coming from anywhere will be allowed to the VendorProducts zone, which contains the vendor-supplied patching products that were utilized in this build. This rule ensures that quarantined systems can still receive patches and updates from the appropriate patching system.
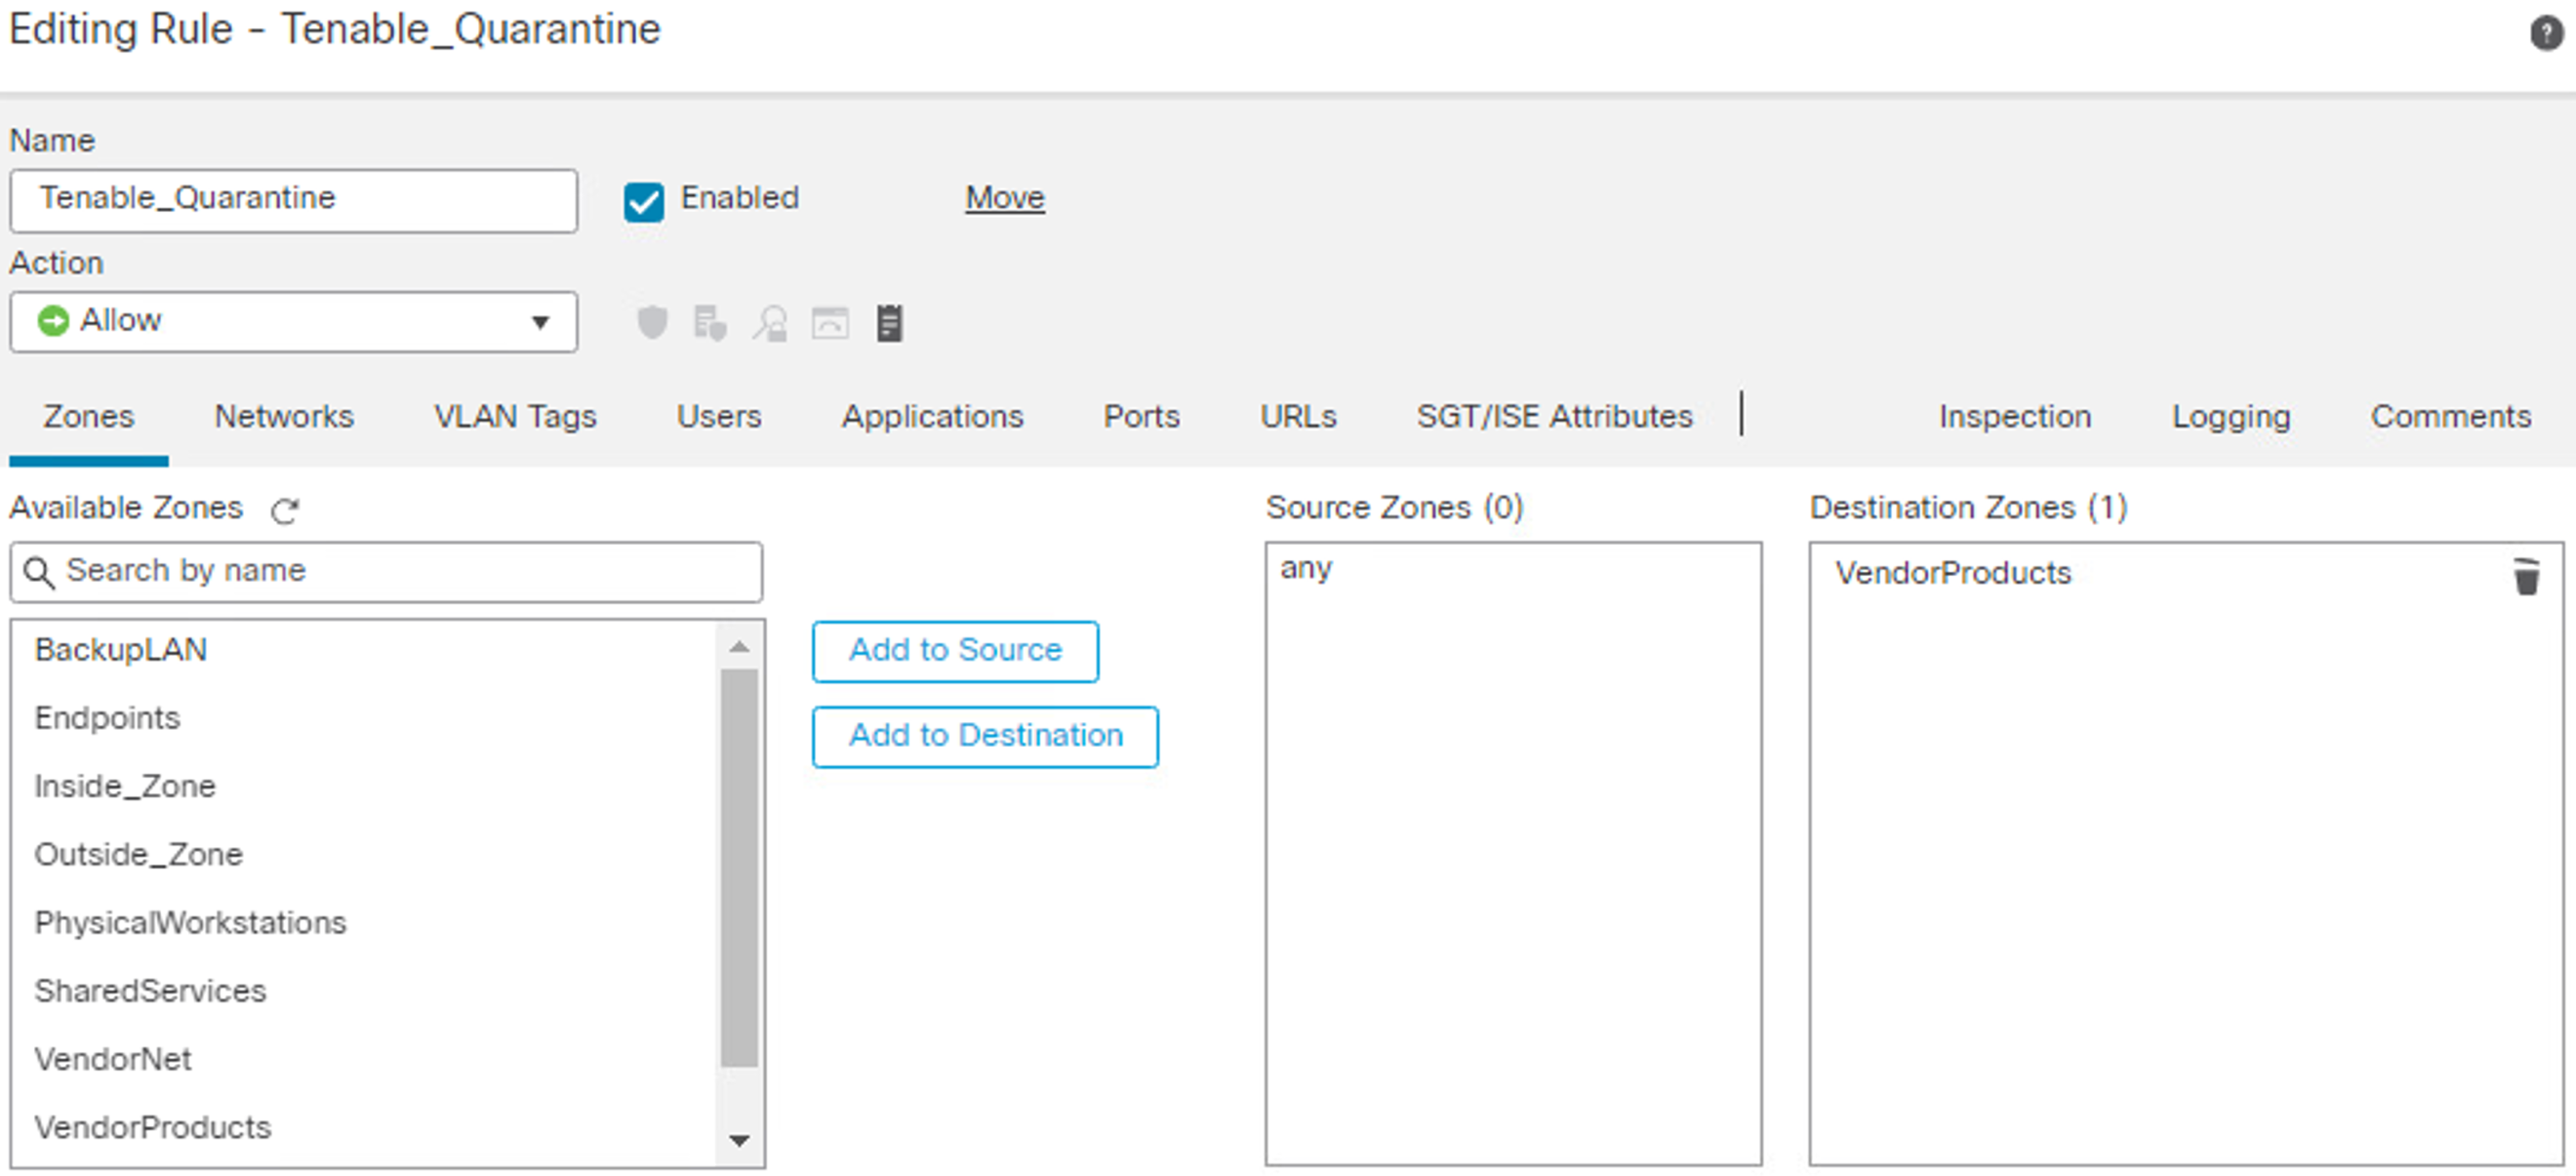
Under the SGT/ISE Attributes tab, fill out the fields with the information in the screenshot. This applies the network access control from step 7 only to traffic that originates from a machine with the Quarantined_Systems security group tag.
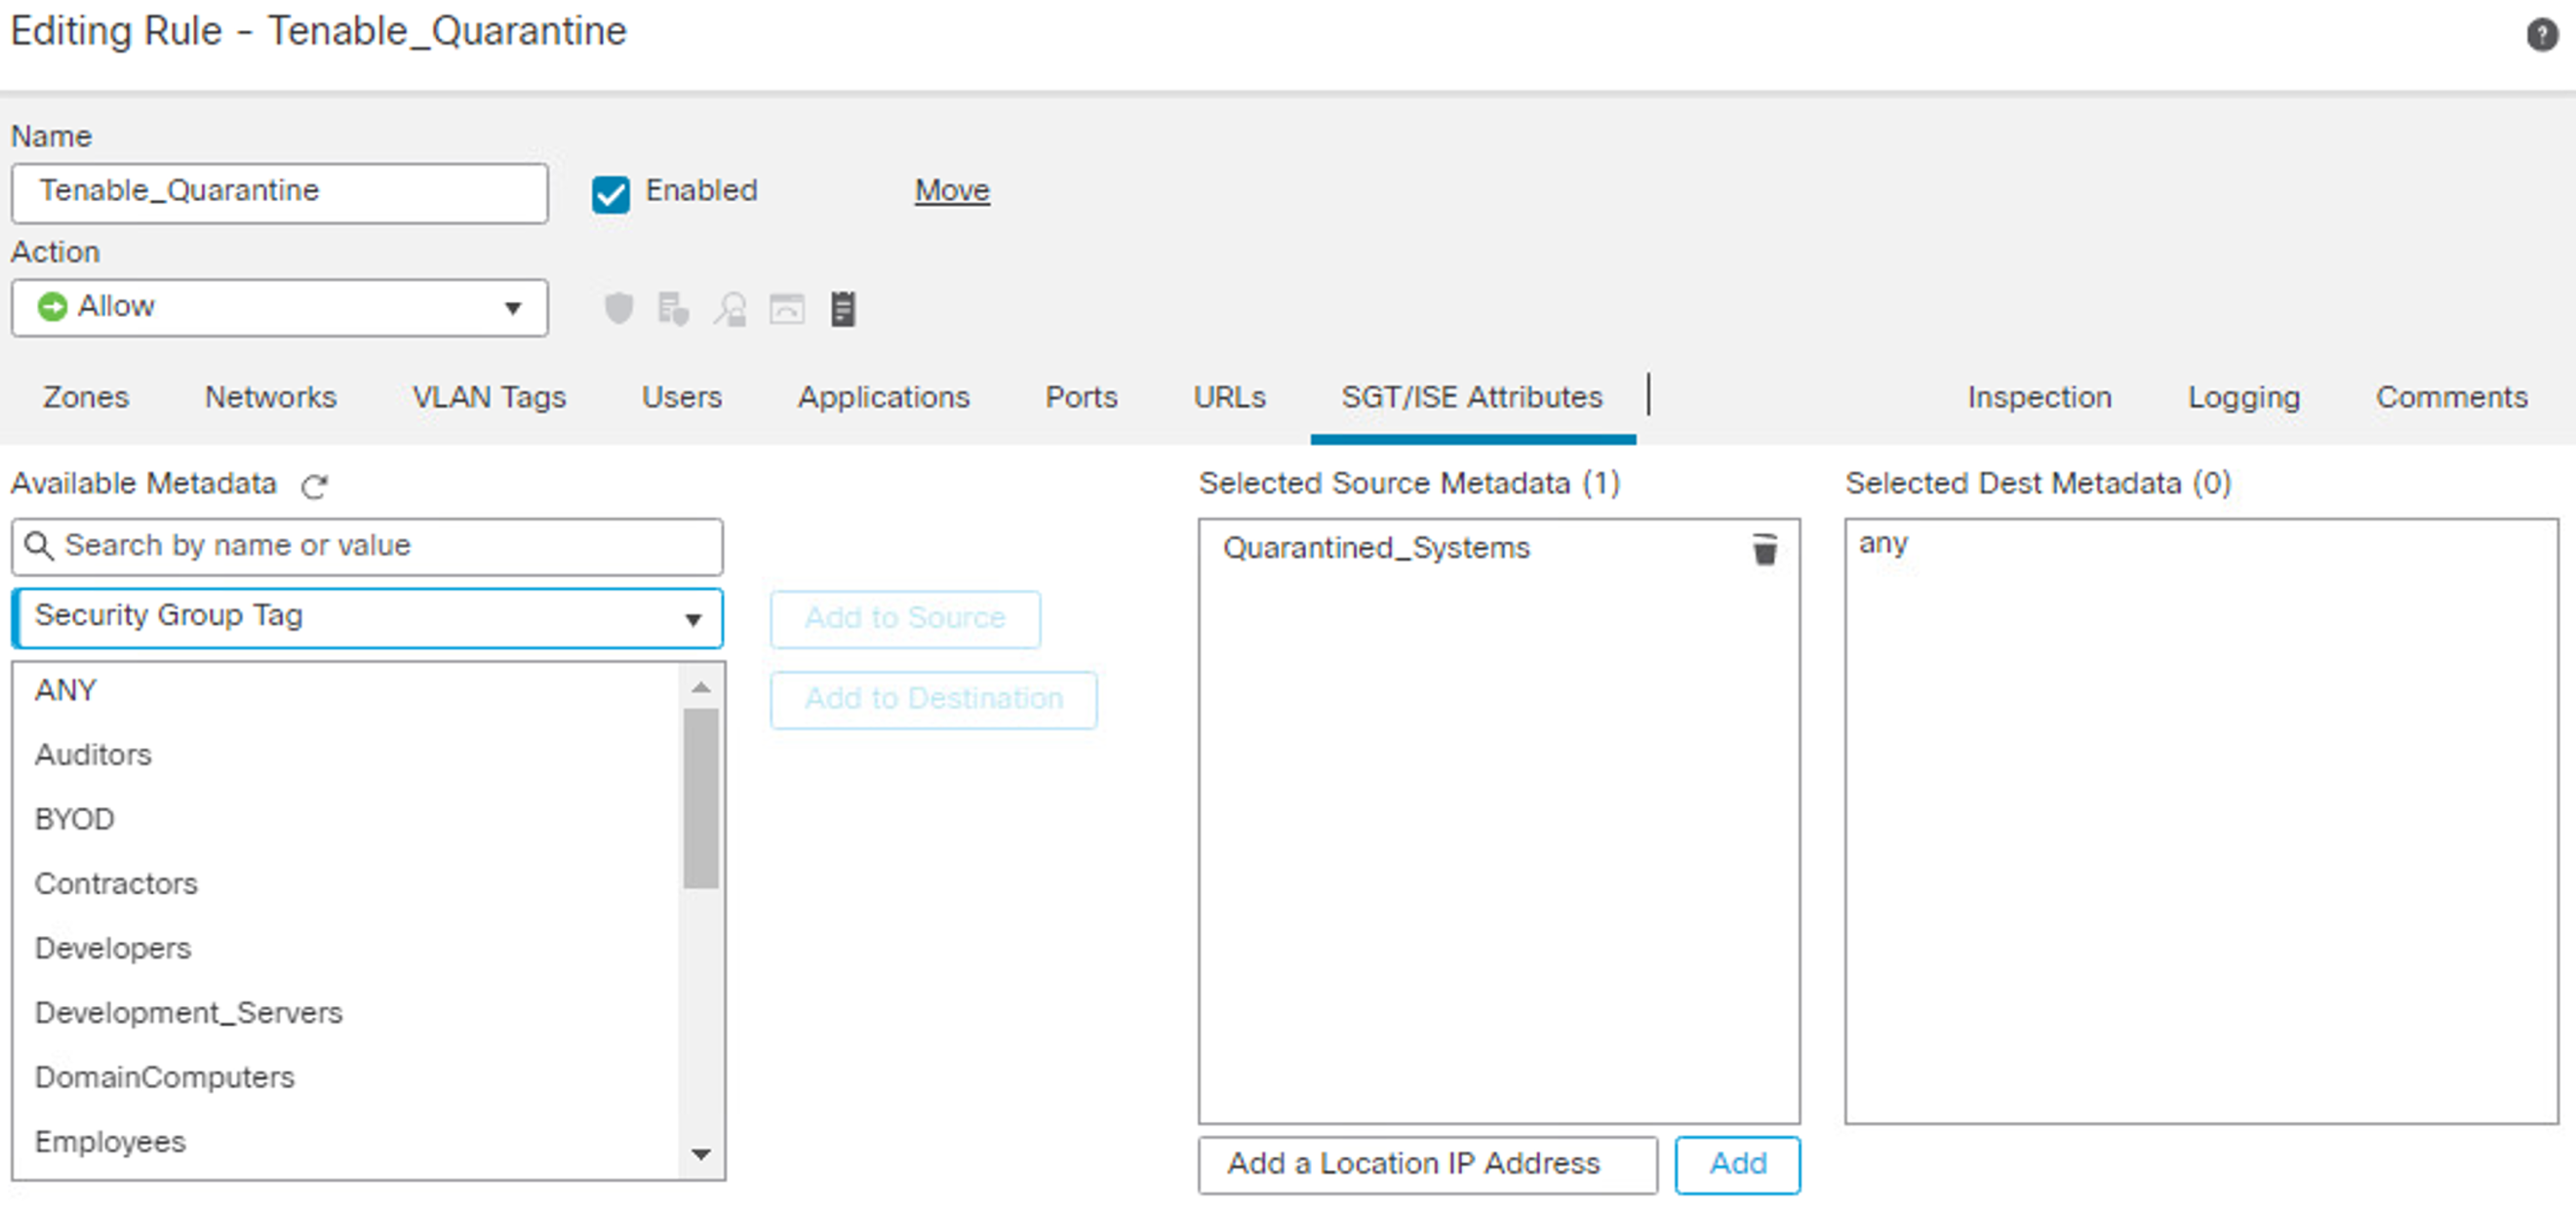
Click Save.
Click the Add Rule button to add an additional rule.
Edit the Zones tab with the information in the screenshot. This rule causes any traffic that has the Quarantined_Systems security group tag to be blocked from traversing the network.
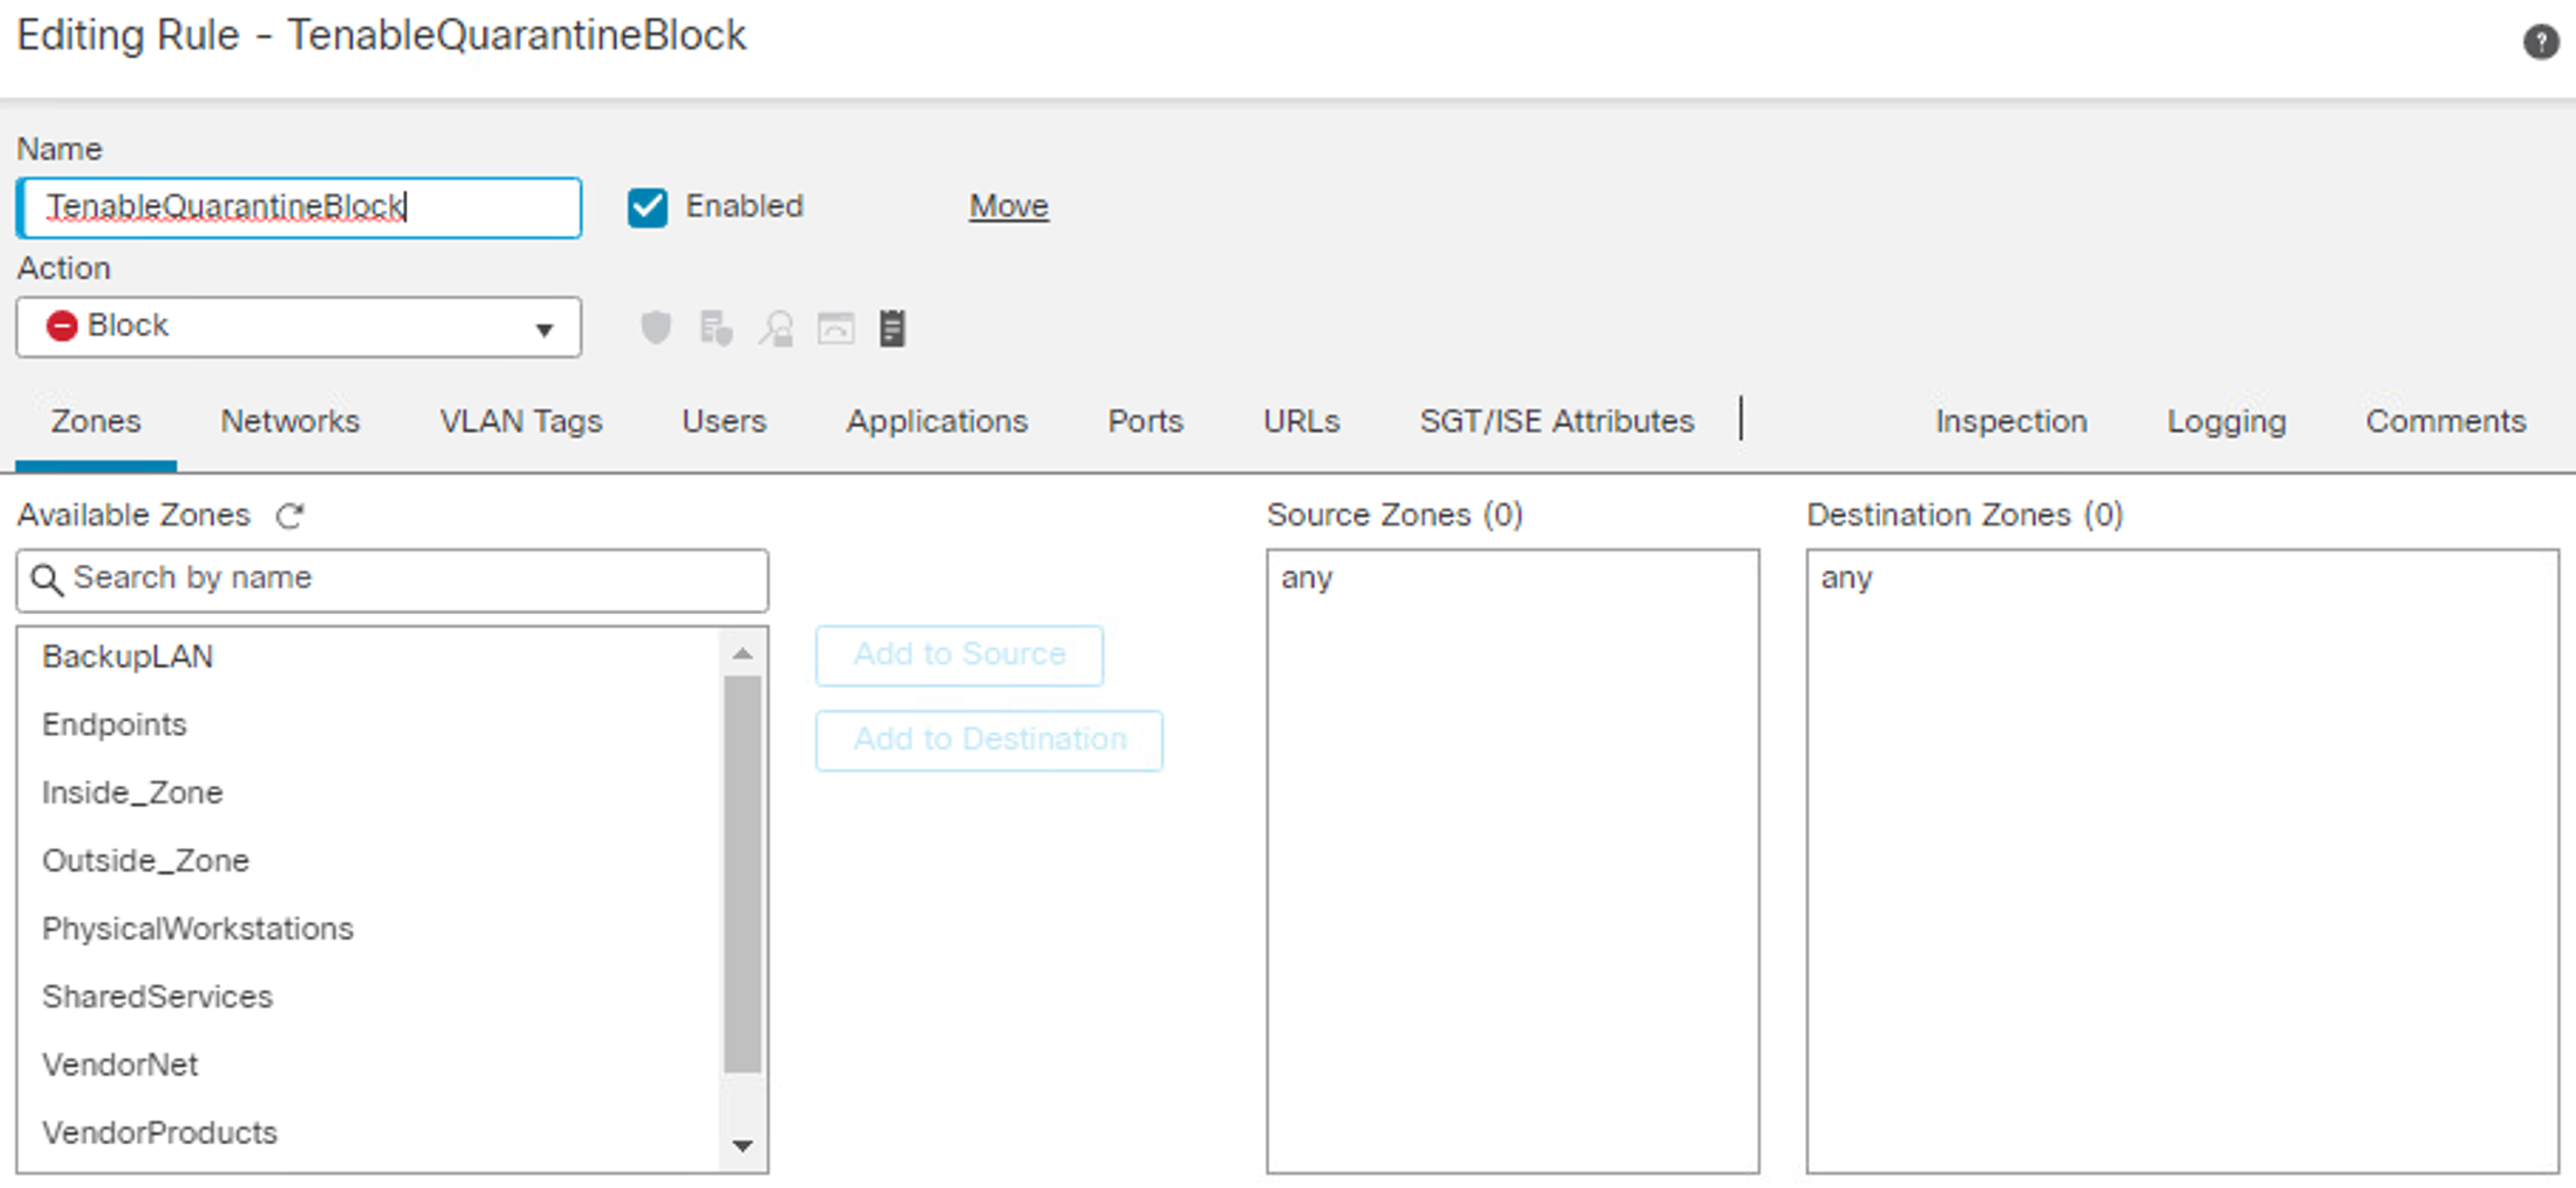
Under the SGT/ISE Attributes tab, add the Quarantined_Systems security group tag to Selected Source Metadata, like in step 8.
6 Microsoft
In this implementation, we used Microsoft Endpoint Configuration Manager to perform configuration management, including software and firmware patching. Microsoft Endpoint Configuration Manager also provided discovery capabilities for endpoints and the capability to respond to emergency scenarios, such as providing a temporary mitigation or an emergency patch.
6.1 Microsoft Installation and Configuration
Our implementation utilized a standalone deployment of Microsoft Endpoint Configuration Manager with a separate instance of the database server running Microsoft SQL 2019. The Microsoft Endpoint Configuration Manager was configured to manage multiple Windows-based hosts within the lab environment. The standalone server hosting the Microsoft Endpoint Configuration Manager and the SQL Server were running Windows Server 2019. Each of these servers was joined to the lab Domain Controller, allowing Microsoft Endpoint Configuration Manager to utilize the services the Domain Controller provided. Information on how to determine the correct deployment for your environment can be found here.
Our implementation of Endpoint Configuration Manager consisted of multiple components, including:
Windows Server Update Services (WSUS), an update service primarily used for downloading, distributing, and managing updates for Microsoft Windows-based systems. Information on how to deploy the WSUS role on Windows Server 2019 can be found here.
Microsoft SQL Server, which served as a database for the Endpoint Configuration Manager sites. The sites are where most of the data for the Endpoint Configuration Manager product is stored. Information on how to deploy Microsoft SQL Server 2019 can be found here.
Microsoft Endpoint Configuration Manager site server, which hosted the core functionality of Endpoint Configuration Manager. Microsoft Endpoint Configuration Manager sites are used to manage endpoints. Information on how to deploy the Endpoint Configuration Manager sites can be found here.
Microsoft Endpoint Configuration Manager console, which was needed to perform administration tasks and was the interface for interacting with the Endpoint Configuration Manager sites. Information on how to deploy the Endpoint Configuration Manager console can be found here.
6.2 Device Discovery
In our implementation, we utilized Heartbeat Discovery, AD System, and AD Group Discovery. Heartbeat Discovery functioned by having the Microsoft Endpoint Configuration Manager agent on the endpoint periodically communicate with the Microsoft Endpoint Configuration Manager server. AD System and AD Group Discovery took advantage of the Enterprise Patching domain and retrieved domain information from the directory server on computers joined to the domain and groups.
More information on how to set up device discovery capabilities can be found here.
6.3 Patching Endpoints with Microsoft Endpoint Configuration Manager
For our implementation, Microsoft Endpoint Configuration Manager was configured to support software updates to Windows devices. More information on how to do this can be found here.
Our deployment relied on third-party updates to deploy non-Microsoft-based software updates. The implementation subscribed to update catalogues that supported software updates for firmware. More information on how to configure third-party updates can be found here.
Although there are multiple methods for distributing patches, our deployment utilized the manual method for deploying software updates. This method applied to both third-party updates and updates from Microsoft. This was achieved by first downloading the software updates we wanted to deploy from the “All Software Updates” view, as Figure 6-1 shows. From this view you can download the software updates you want to deploy.
Figure 6‑1 All Software Updates View for Microsoft Endpoint Configuration Manager
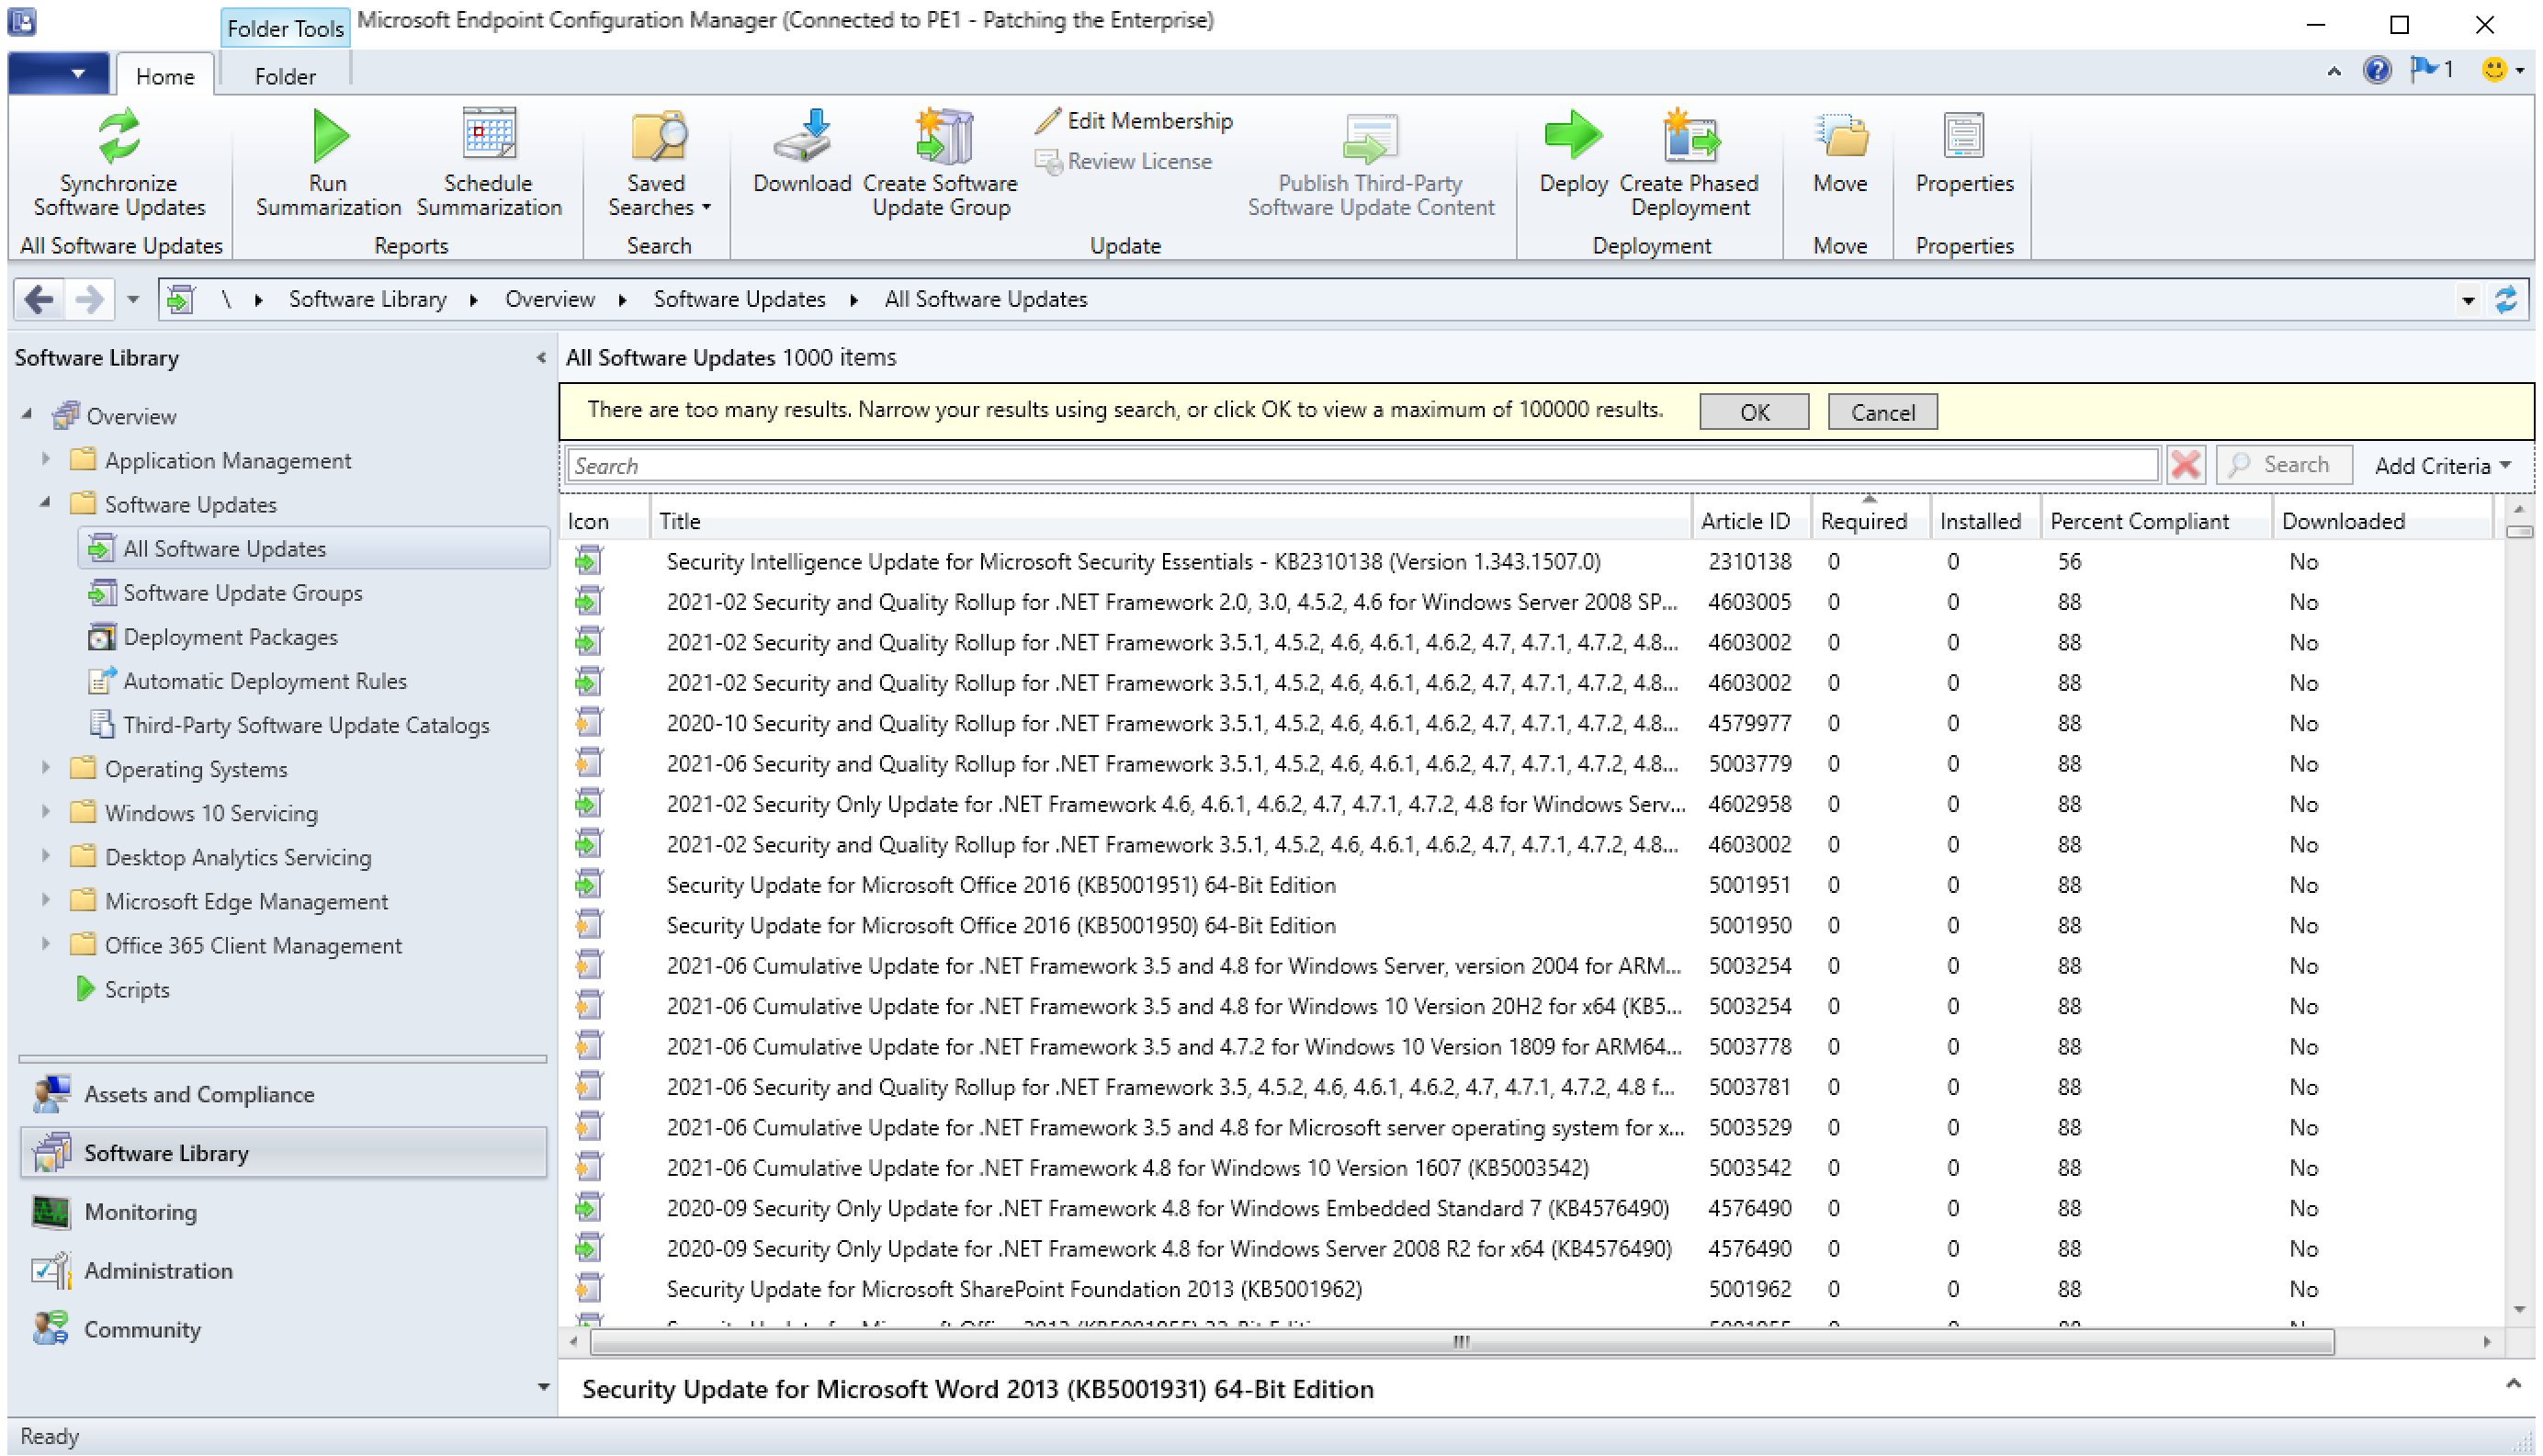
From this view you can download the software updates you want to deploy. The next step we performed was creating a new deployment package. Figure 6-2 provides an example of this.
Figure 6‑2 Creating a New Deployment Package with Microsoft Endpoint Configuration Manager
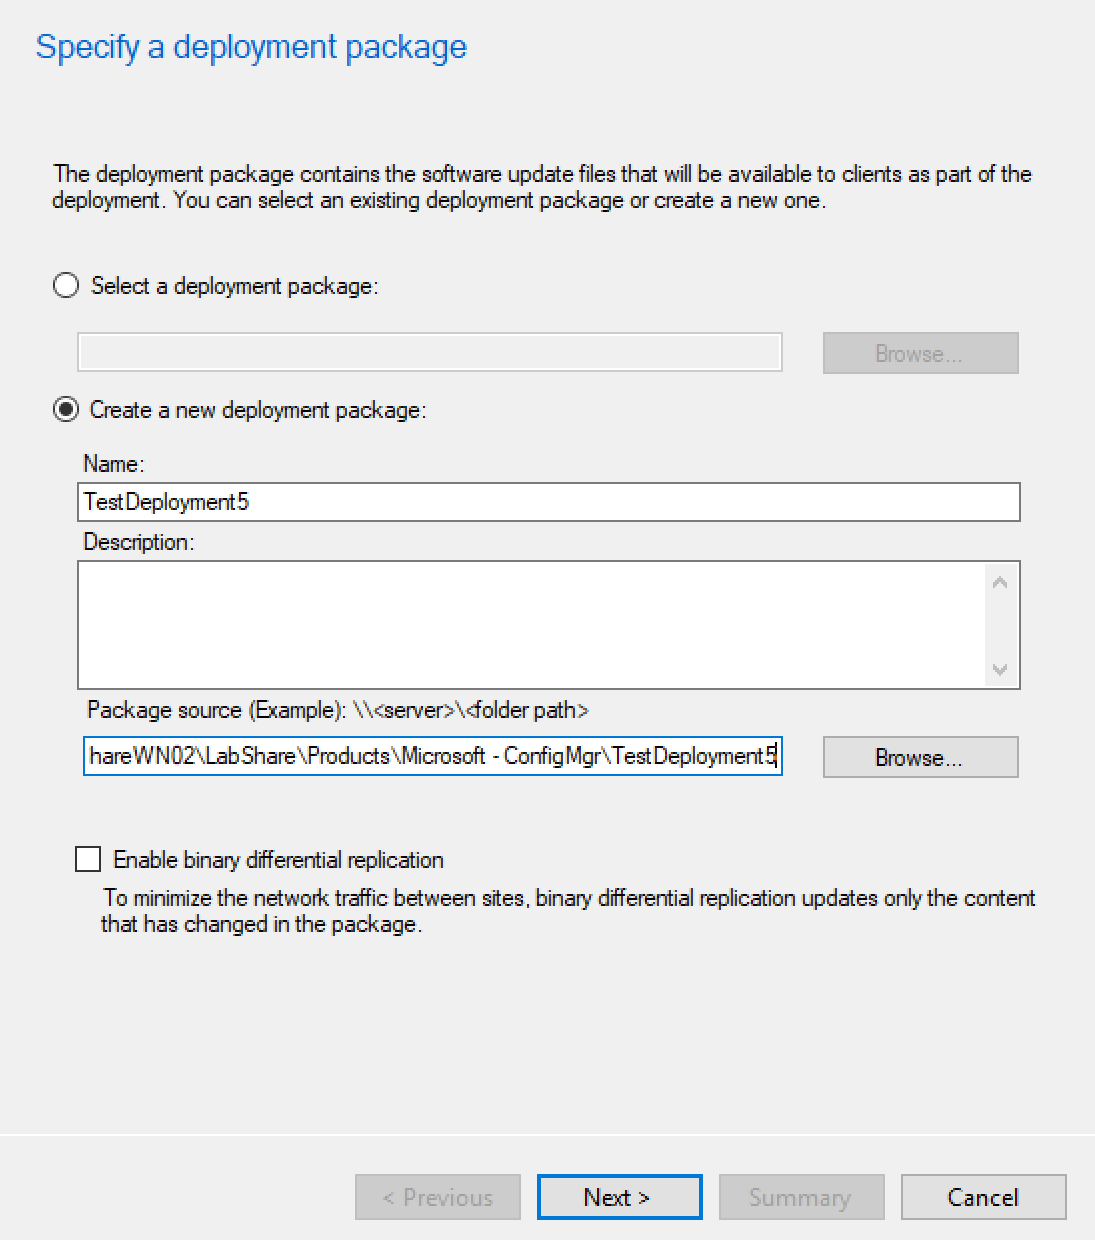
After creating a deployment package, the updates can be distributed to endpoints by adding the deployment package to a software update group. More information on how to use this method can be found here.
For instances where updates need to be deployed more quickly, deployments can be specified with immediate delivery by changing the deployment type to Required. See Figure 6-3 showing the settings for an example deployment.
Figure 6‑3 Deployment Settings
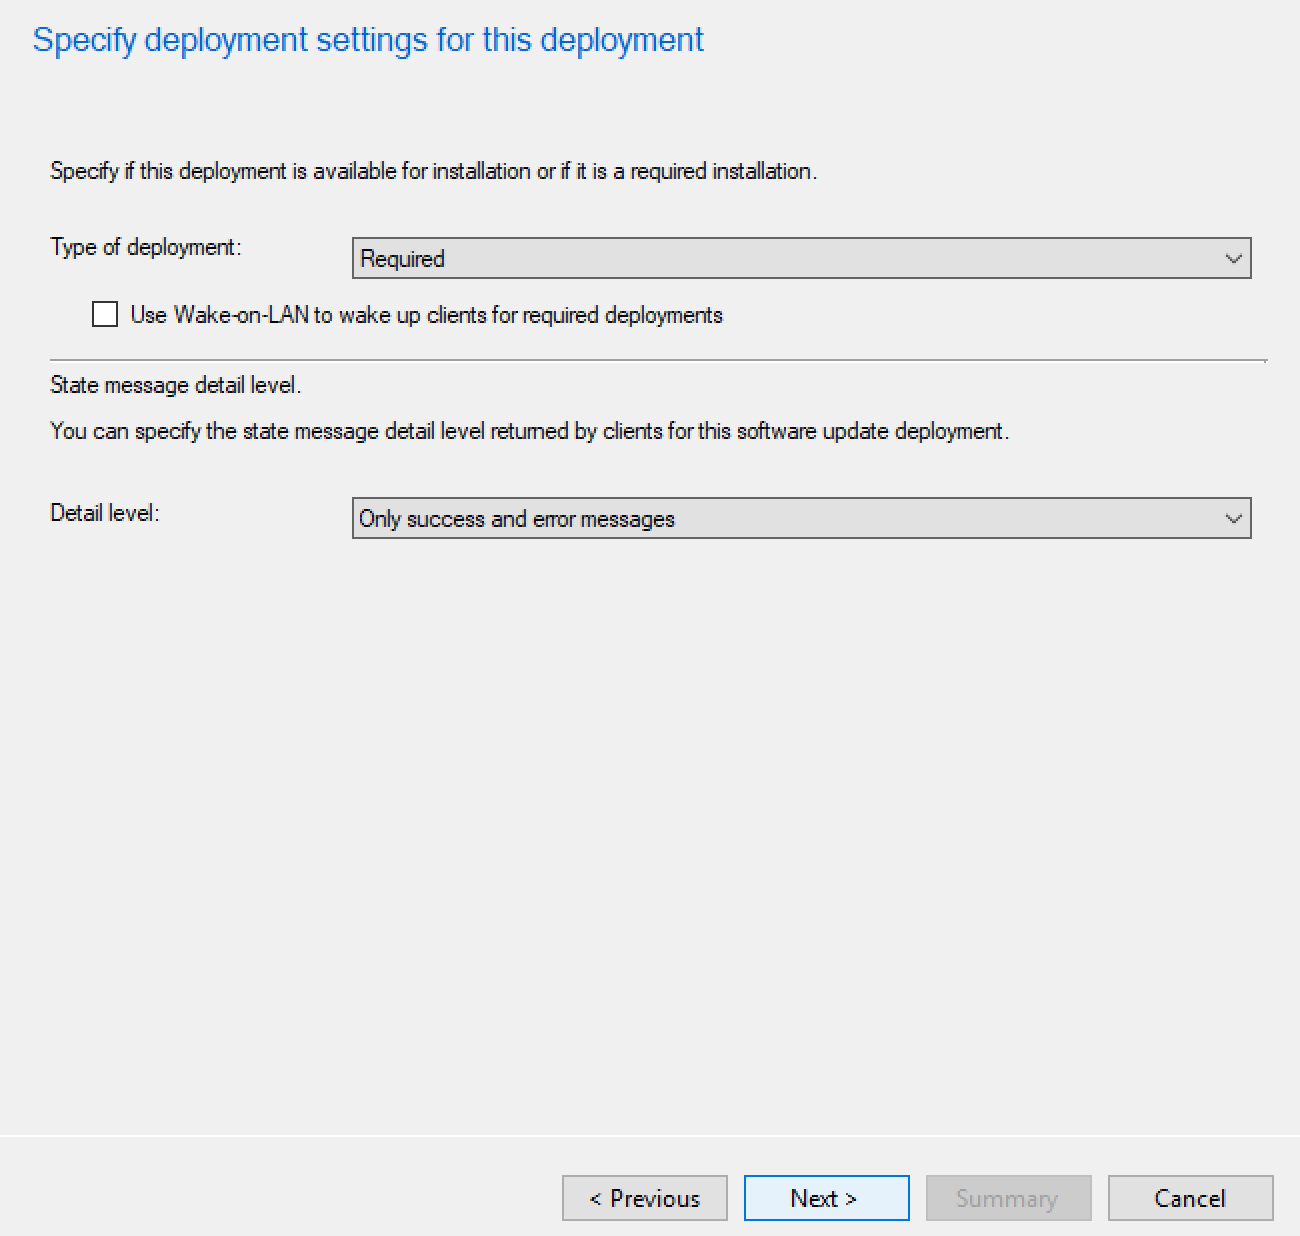
This forces the update to be installed based on the schedule specified in the deployment. For immediate updates, select As soon as possible when configuring the schedule for deployment. Figure 6-4 shows the schedule details for an example deployment.
Figure 6‑4 Deployment Schedule
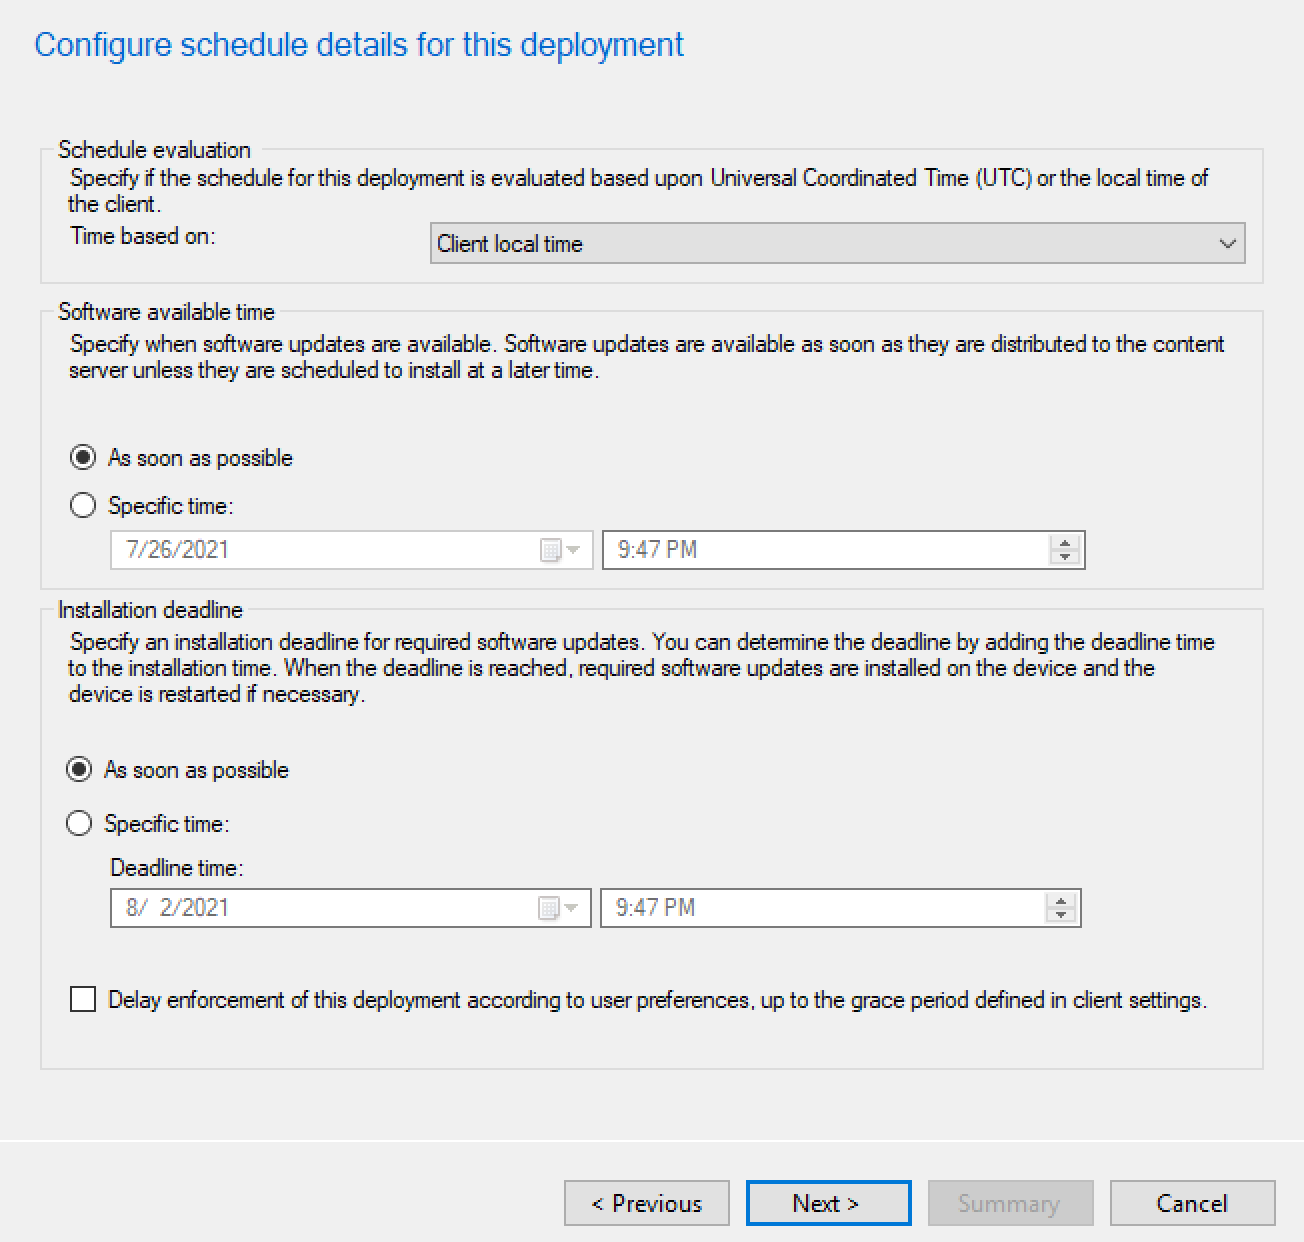
Our deployment also relied on Endpoint Configuration Manager’s ability to deploy a PowerShell script to endpoints for emergency mitigation scenarios. We utilized a script that uninstalled Java on the endpoint on which the script is run. More information on how to deploy PowerShell scripts can be found here.
The script we uploaded into Microsoft Endpoint Configuration Manager for the build was:
gwmi Win32_Product -filter "name like 'Java%'" \| % { $_.Uninstall() }
Our deployment relied on Microsoft Endpoint Configuration Manager’s ability to deploy scripts directly to endpoints. This was achieved by selecting an endpoint from the Devices view and selecting the Run Script option, as Figure 6-5 illustrates.
Figure 6‑5 Devices View with Run Script Option Selected
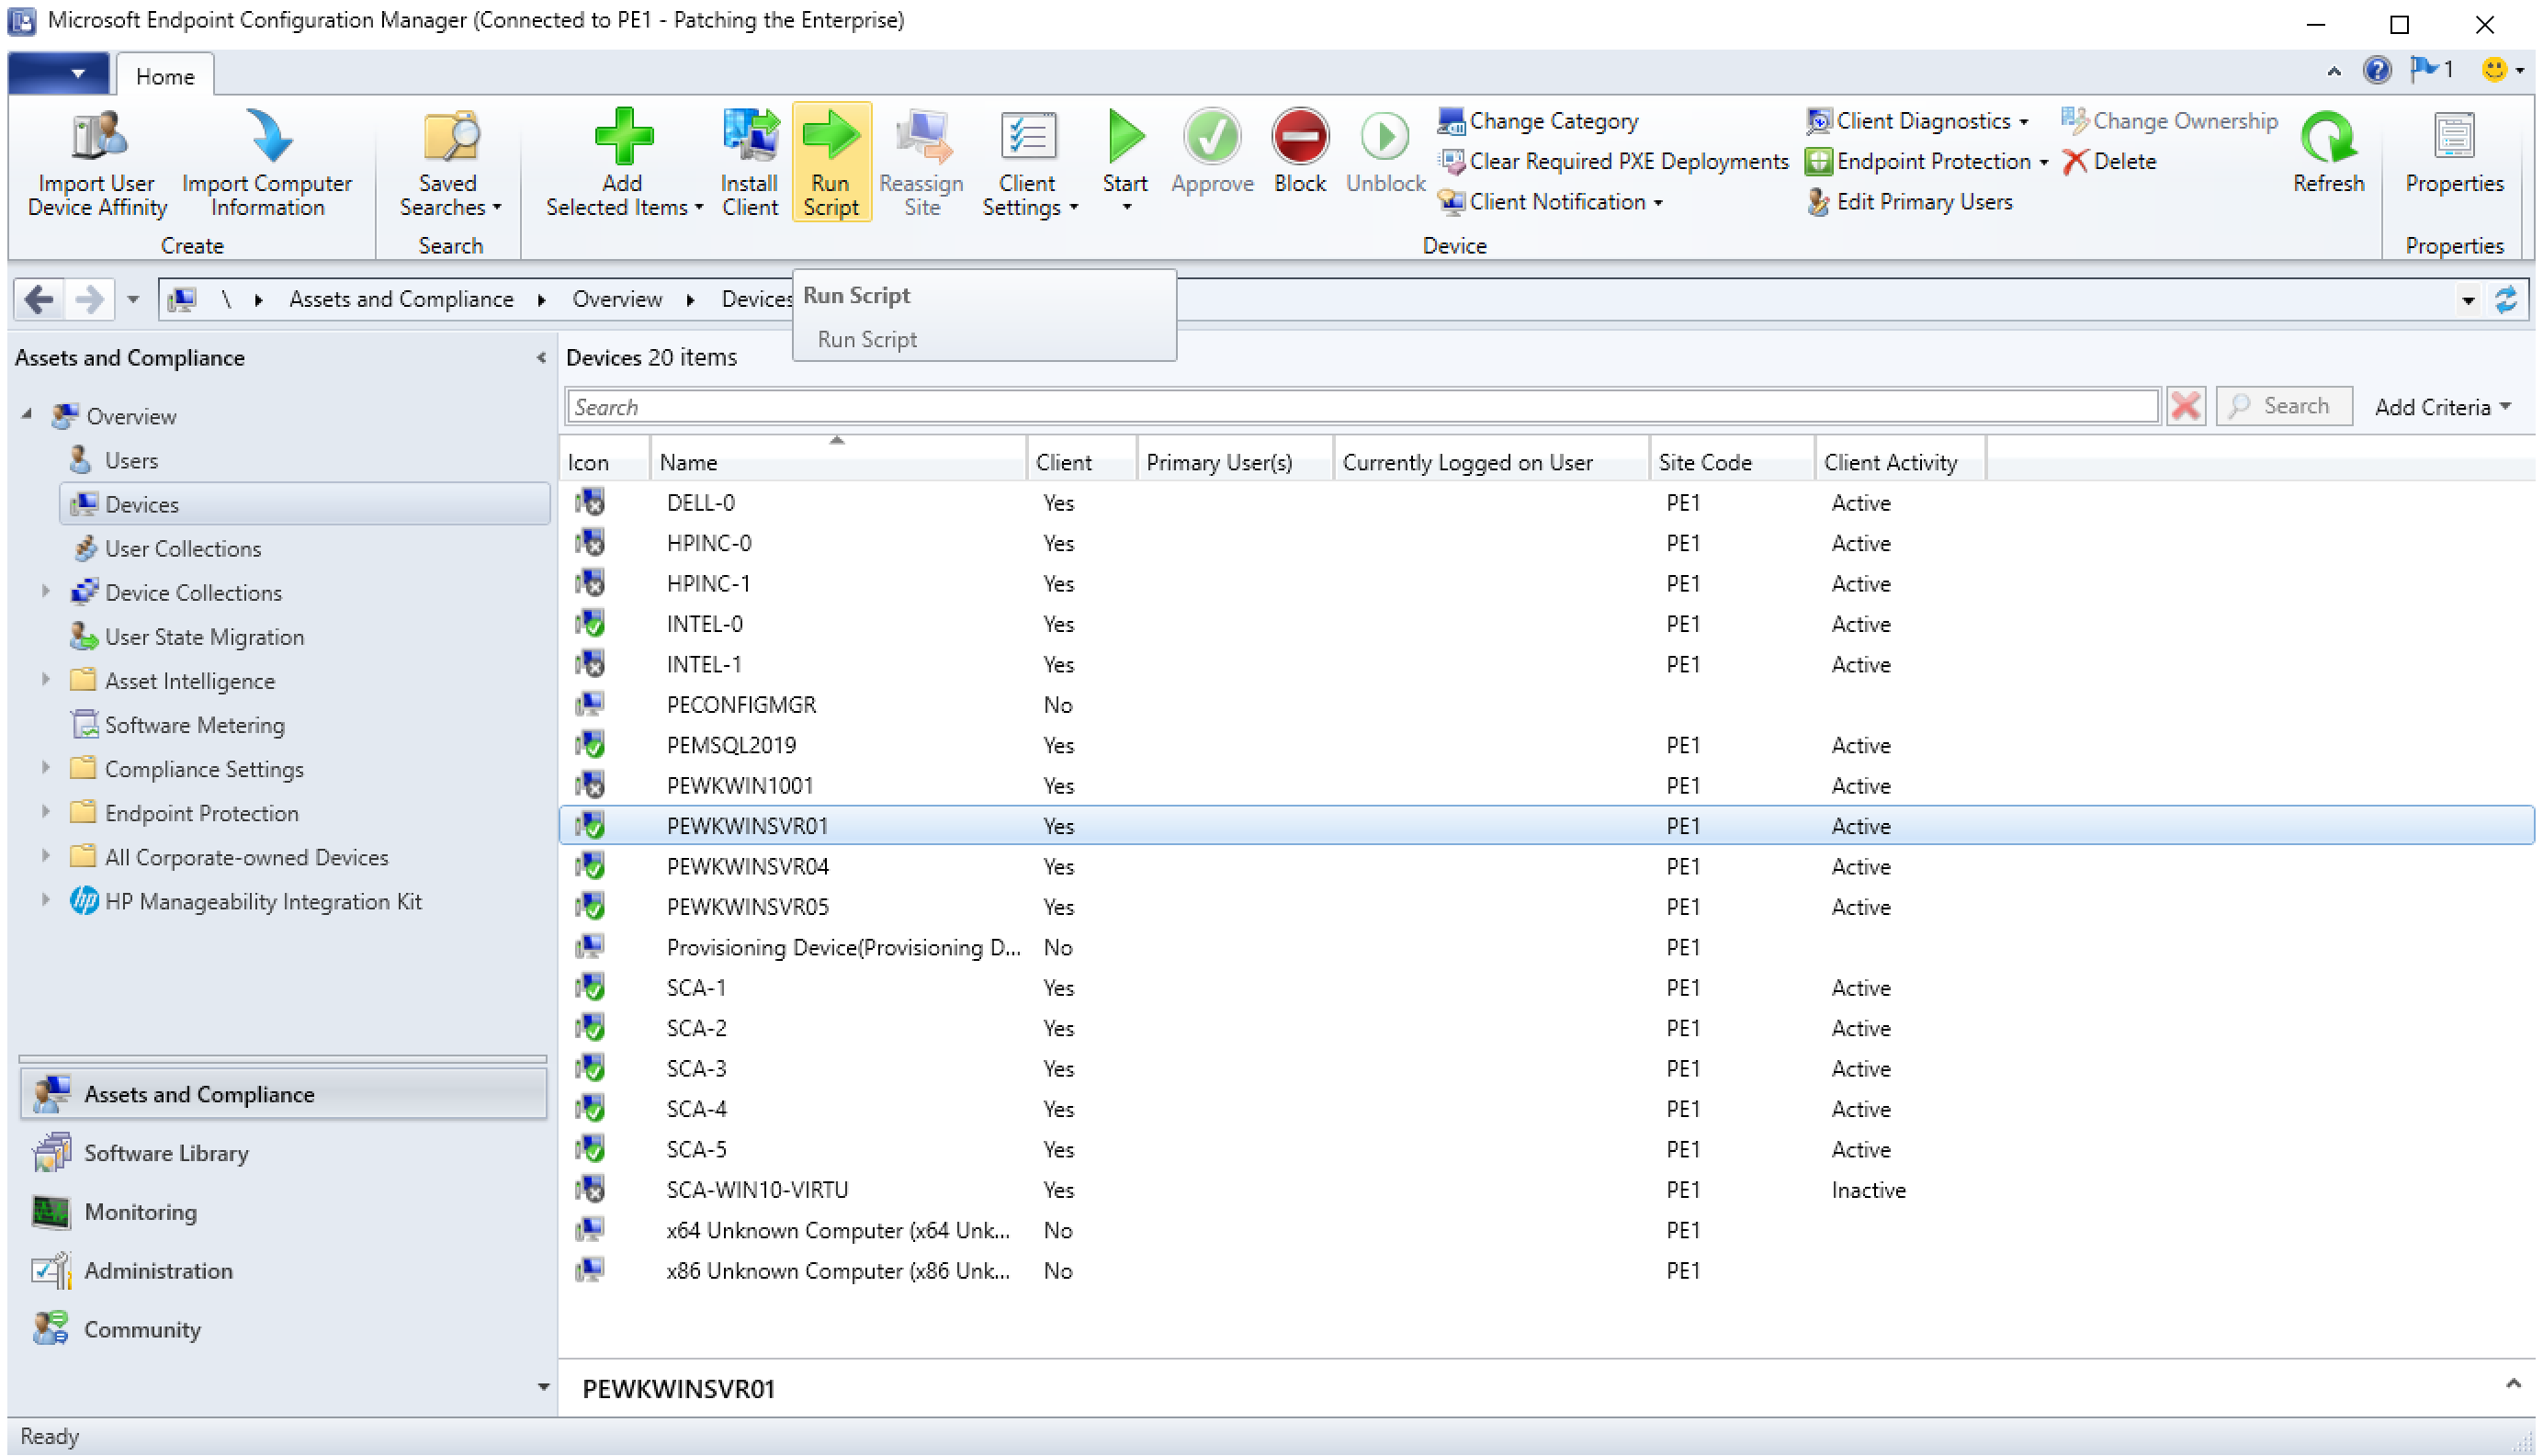
6.4 Microsoft Reporting
We utilized the reporting capabilities of Microsoft Endpoint Configuration Manager to determine which Windows patches and third-party updates were available for endpoints. Information on configuring those reporting capabilities can be found here.
The build utilized the available Software Updates reports from Microsoft Endpoint Configuration Manager to determine specific software updates that were available for endpoints. An example of a report used for this to determine what critical third-party updates are available can be seen in Figure 6-6.
Figure 6‑6 Report Showing Critical 3rd Party Updates Available for HP Business Clients
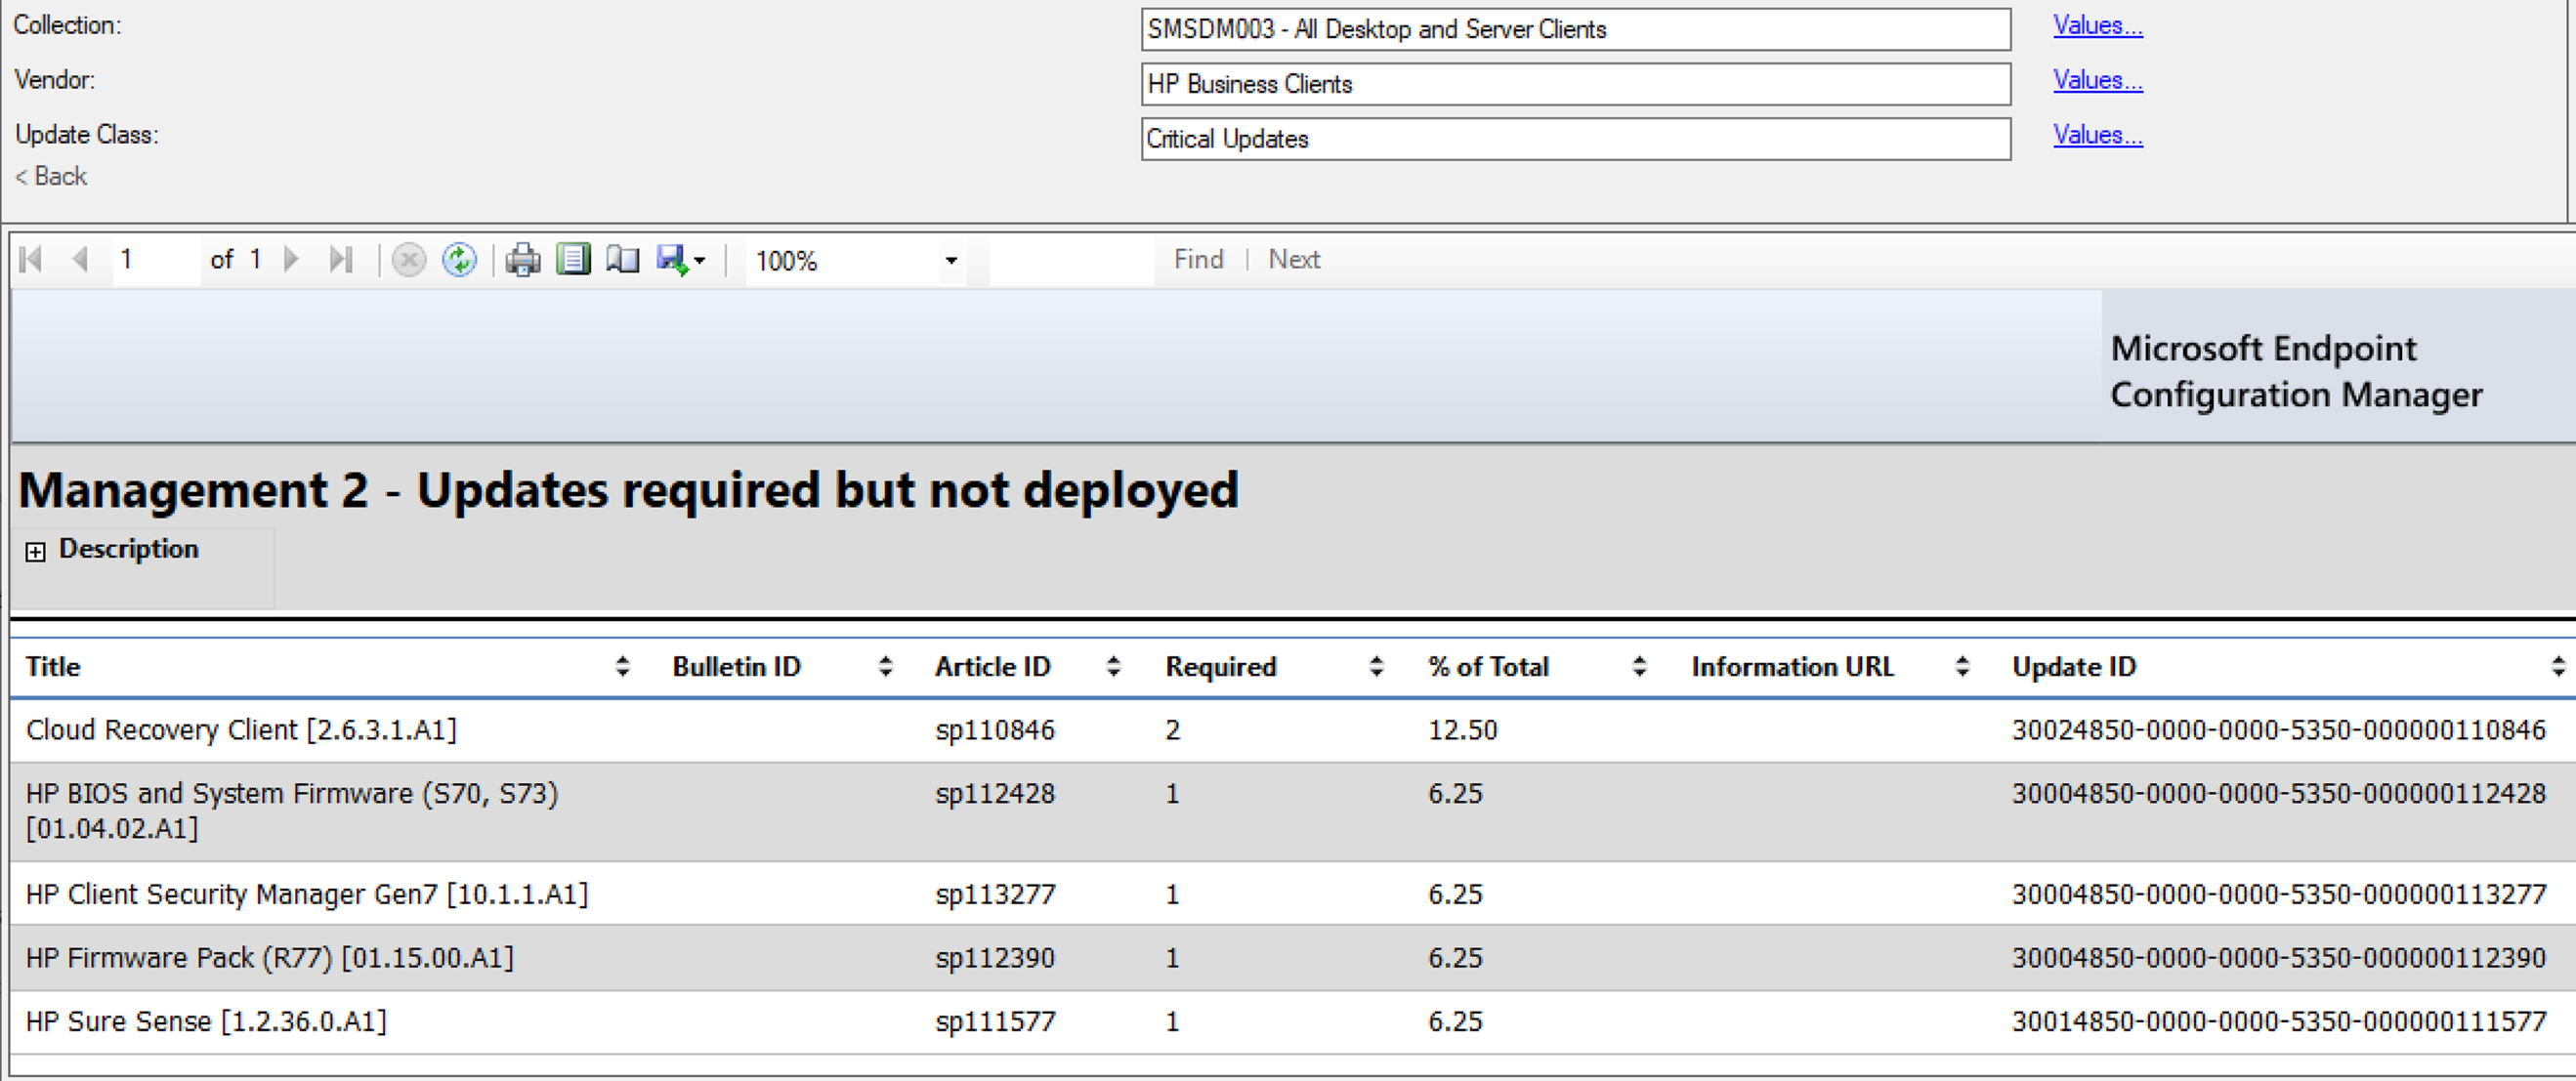
6.5 Microsoft Maintenance
Microsoft Endpoint Configuration Manager utilizes in-console updates and servicing. This feature automatically applies Microsoft-recommended updates that are relevant to your specific infrastructure and configuration.
7 Forescout
In this implementation, we used the Forescout platform to perform endpoint discovery. The Forescout platform can perform endpoint discovery by detecting endpoints and determining software information about those endpoints based on a set of attributes. The Forescout platform also provided the capability to isolate or restrict unpatchable assets and to respond to emergency scenarios, such as providing a temporary mitigation or deploying an emergency patch. This section explains how the Forescout platform was utilized in this build.
7.1 Installation and Configuration of Enterprise Manager and Appliance
Our implementation of the Forescout platform utilized both the Forescout Enterprise Manager and Forescout Appliance. Instructions for deploying these can be found here.
In our setup, the Enterprise Manager allowed for management of multiple Forescout Appliances. Although our build only contained one appliance, we chose to utilize the Enterprise Manager to demonstrate an enterprise environment and to enable adding more appliances to our build if needed. The Forescout Appliance was deployed to have a dedicated virtual device for monitoring network traffic. Depending on the size of your network and your specific requirements, more than one physical or virtual appliance may be recommended.
7.1.1 Installation via OVF
Instructions for deploying OVF templates that can be utilized as either an Enterprise Manager or Forescout Appliance can be found here. The OVF installation method was used by the team for both the Enterprise Manager and Appliance deployment; however, there are other installation methods available that may be better suited for your environment.
7.1.2 Installation of Forescout Console and Initial Setup
The console application is required to complete the installation of the Forescout platform and to administer the system. The console was installed on a dedicated VM running the Windows 10 OS. This VM has network access to the Forescout Enterprise Manager and Appliance. The instructions for initial installation and setup of the Forescout console can be found here.
7.2 Forescout Capabilities Enabled
After installation and initial setup, it is recommended to enable additional capabilities for the Forescout platform to utilize. The capabilities enabled will depend on what services are available in your environment for Forescout to integrate with. The following subsections cover the basic options the team enabled and utilized in our build.
7.2.1 Network
The Forescout platform was configured to capture network traffic from the Forescout Appliance. Traffic was collected from all the internal subnets from the lab environment. This allowed the Forescout Appliance to identify hosts on our network by collecting network traffic from the virtual switch using a mirror port. This allowed traffic to be collected from endpoints without requiring an agent or communicating directly between the Forescout platform and the endpoints.
7.2.2 User Directory
The User Directory plugin was configured so that the Forescout platform integrated with the lab’s AD Domain Controller. This plugin provided Lightweight Directory Access Protocol (LDAP) services to Forescout, allowing directory-based users to log in into Forescout as well as providing user directory information such as the current active domain users logged into each endpoint. More information about this plugin can be found in the Authentication Module: User Directory Plugin Server and Guest Management Configuration Guide.
7.2.3 DNS Query Extension
This configuration setting allowed Forescout to query the DNS server to determine the hostnames of devices identified by Forescout.
7.2.4 Tenable VM
The Tenable VM plugin provided the Forescout platform with vulnerability and scan status information which can be used to create custom policies. This plugin also enabled Forescout to utilize vulnerability management information that Tenable.sc collected from endpoints and allowed the Forescout platform to determine if scans had been performed on endpoints within the lab. More information about the Critical Vulnerability Quarantine policy, which utilizes the data from this policy, can be found in Section 7.3.3. Information on how this plugin can be installed and configured for your environment can be found in the eyeExtend for Tenable Vulnerability Management Configuration guide.
7.2.5 Microsoft SMS/SCCM
The Microsoft Systems Management Server (SMS)/System Center Configuration Manager (SCCM) module was configured to allow the Forescout platform to integrate with Microsoft Endpoint Configuration Manager. This module allowed for a custom policy to be created that used data from Microsoft Endpoint Configuration Manager. More information about the SCCM Agent Non Compliant Check policy, which utilizes the data from this module, can be found in Section 7.3.6. In our build, this module was primarily used to determine which hosts were running the Endpoint Configuration Manager agent and therefore communicating with Microsoft Endpoint Configuration Manager. Information on how this module can be installed and configured for your environment can be found in the Endpoint Module: Microsoft SMS/SCCM Plugin Configuration guide.
7.2.6 Linux
The Linux plugin was configured to collect information from and manage Linux-based endpoints via two methods: secure shell (SSH) access to the endpoints, and agent-based integration with the Linux endpoint. Both these methods for collecting data from endpoints were implemented in the lab environment. Information on how this plugin can be installed and configured for your environment can be found in the Endpoint Module: Linux SCCM Plugin Configuration guide.
7.2.7 HPS Inspection Engine
The HPS Inspection Engine was configured to collect information from Windows endpoints via two methods. The first method utilized a directory-based integration with the lab’s AD Domain Services instance, which collected domain-based information on the Windows endpoint. The second method utilized an agent-based integration called SecureConnector that allowed Forescout to collect and manage Windows endpoints. The agent-based integration was deployed to endpoints by a Windows Installer (MSI) installer that was manually downloaded from the Enterprise Manager and installed on the endpoint.
Multiple deployment methods can be utilized for installing the SecureConnector. Two methods that were not utilized in this build are automatically deploying software utilizing a configuration management tool and using a corporate image with the SecureConnector preinstalled when configuring new endpoints for your environment.
Information on how the HPS Inspection Engine can be installed and configured for your environment can be found in the Endpoint Module: HPS Inspection Engine Configuration guide.
7.2.8 pxGrid
The pxGrid plugin was configured to integrate with Cisco ISE. This plugin gave the Forescout Platform the ability to utilize Cisco ISE to apply adaptive network control (ANC) policies to endpoints. ANC policies can be used to control network access for endpoints. The ANC policies were enabled on Cisco ISE and could be controlled by third-party systems such as the Forescout platform using pxGrid.
In this implementation, an ANC policy configured within Cisco ISE was used to apply a quarantine policy against the host. For example, in the Critical Vulnerability Quarantine Policy in Section 7.3.3, Forescout communicates to Cisco ISE to quarantine the host when critical vulnerabilities are found on the endpoint via the Tenable VM plugin. After the Cisco ISE ANC policy is applied to a host, the device is assigned a Quarantine security group tag by Cisco ISE. The pxGrid integration between ISE and the Cisco FTD firewall allows for security group tags to be shared. This SGT is then applied by ISE, and network traffic at layer 3 is controlled via firewall rules that were created in Section 5.2.7. Information on how this plugin can be installed and configured for your environment can be found in the pxGrid Plugin Configuration guide.
7.2.9 Switch
The Switch plugin was configured to integrate the Forescout platform with the physical Cisco switch located in the lab. The plugin used information from the switch to collect information about endpoints that were physically connected to the switch. Information on how this plugin can be installed and configured for your environment can be found in the Network Module: Switch Plugin Configuration guide.
7.2.10 VMware vSphere/ESXi
Forescout can integrate with VMware vCenter or ESXi host via a plugin. Our build utilized this plugin to collect information on what virtual hosts and appliances were running in support of the host discovery scenario. We configured Forescout to collect information from a VMware ESXi host installed on a Dell R620 server in the lab environment. Information on how this plugin can be installed and configured can be found on the following page.
The following is an overview of the steps for configuring the plugin:
Open the Forescout Console and go to Options > Tools.
Select VMware vSphere from the left pane.
Select Add.
Fill out the resulting form with the requested parameters.
7.3 Policies
The project received policies from Forescout that are normally made available to a customer when they purchase professional services from Forescout. These policies helped the team to discover, classify, and assess endpoints on the lab network. More information on how to receive the professional services policies can be found here.
To satisfy the scenarios outlined in the project description, the team also created the following custom policies. More information on how to create custom policies can be found here.
7.3.1 Adobe Flash Player Removal Policy
The Adobe Flash Player Removal policy checks if Flash is running on a
Windows Endpoint. If it is, this policy will terminate the process
running Flash and uninstall Flash by running the command
“uninstall_flash_player.exe -uninstall” on the endpoint.
<RULES>

<RULE APP_VERSION="8.2.2-
731" CACHE_TTL="259200" CACHE_TTL_SYNCED="true" CLASSIFICATION="REG_STATUS" DES
CRIPTION=" " ENABLED="true" ID="-2605681954930199910" NAME="Adobe Flash Player
Removal" NOT_COND_UPDATE="true" UPGRADE_PERFORMED="true">

<GROUP_IN_FILTER>

<GROUP ID="1391284960034120761" NAME="Windows"/>

</GROUP_IN_FILTER>

<INACTIVITY_TTL TTL="0" USE_DEFAULT="true"/>

<ADMISSION_RESOLVE_DELAY TTL="0" USE_DEFAULT="true"/>

<MATCH_TIMING RATE="28800" SKIP_INACTIVE="true">

<ADMISSION ALL="true"/>

</MATCH_TIMING>

<EXPRESSION EXPR_TYPE="AND">

<!-- Rule expression. Rule name is: Adobe Flash Player Removal -->

<EXPRESSION EXPR_TYPE="SIMPLE">

<CONDITION EMPTY_LIST_VALUE="false" FIELD_NAME="process_no_ext" LABEL="Windows
Processes Running" LEFT_PARENTHESIS="0" LOGIC="AND" PLUGIN_NAME="HPS Inspection
Engine" PLUGIN_UNIQUE_NAME="va" PLUGIN_VESRION="11.1.2" PLUGIN_VESRION_NUMBER="
111020046" RET_VALUE_ON_UKNOWN="UNMATCH" RIGHT_PARENTHESIS="0">

<FILTER CASE_SENSITIVE="false" FILTER_ID="-8737023325596837863" TYPE="contains">

<VALUE VALUE2="Flash"/>

</FILTER>

</CONDITION>

</EXPRESSION>

<EXPRESSION EXPR_TYPE="SIMPLE">

<CONDITION EMPTY_LIST_VALUE="false" FIELD_NAME="nbthost" LABEL="NetBIOS
Hostname" LEFT_PARENTHESIS="0" LOGIC="AND" PLUGIN_NAME="NBT
Scanner" PLUGIN_UNIQUE_NAME="nbtscan_plugin" PLUGIN_VESRION="3.2.1" PLUGIN_VESR
ION_NUMBER="32010012" RET_VALUE_ON_UKNOWN="IRRESOLVED" RIGHT_PARENTHESIS="0">

<FILTER CASE_SENSITIVE="false" FILTER_ID="-575936128989425039" TYPE="contains">

<VALUE VALUE2="PEWKWINSVR02"/>

</FILTER>

</CONDITION>

</EXPRESSION>

</EXPRESSION>

<EXCEPTION NAME="ip" UNKNOWN_EVAL="UNMATCH">

<RANGE FROM="10.131.5.2" TO="10.131.5.2"/>

<RANGE FROM="10.132.2.11" TO="10.132.2.11"/>

</EXCEPTION>

<EXCEPTION NAME="mac" UNKNOWN_EVAL="UNMATCH"/>

<EXCEPTION NAME="nbthost" UNKNOWN_EVAL="UNMATCH"/>

<EXCEPTION NAME="user" UNKNOWN_EVAL="UNMATCH"/>

<EXCEPTION NAME="group" UNKNOWN_EVAL="UNMATCH"/>

<ORIGIN NAME="CUSTOM"/>

<UNMATCH_TIMING RATE="28800" SKIP_INACTIVE="true">

<ADMISSION ALL="true"/>

</UNMATCH_TIMING>

<SEGMENT ID="2960766429758300381" NAME="Endpoints">

<RANGE FROM="10.132.6.0" TO="10.132.6.255"/>

<RANGE FROM="10.151.40.0" TO="10.151.40.255"/>

<RANGE FROM="192.168.1.0" TO="192.168.1.255"/>

</SEGMENT>

<RULE_CHAIN>

<INNER_RULE APP_VERSION="8.2.2-
731" CACHE_TTL="259200" CACHE_TTL_SYNCED="true" CLASSIFICATION="REG_STATUS" DES
CRIPTION="" ID="1600971908334654081" NAME="Runing
Flash" NOT_COND_UPDATE="true" RECHECK_MAIN_RULE_DEF="true">

<MATCH_TIMING RATE="28800" SKIP_INACTIVE="true">

<ADMISSION ALL="true"/>

</MATCH_TIMING>

<EXPRESSION EXPR_TYPE="SIMPLE">

<!-- Rule expression. Rule name is: Runing Flash -->

<CONDITION EMPTY_LIST_VALUE="false" FIELD_NAME="process_no_ext" LABEL="Windows
Processes Running" LEFT_PARENTHESIS="0" LOGIC="AND" PLUGIN_NAME="HPS Inspection
Engine" PLUGIN_UNIQUE_NAME="va" PLUGIN_VESRION="11.1.2" PLUGIN_VESRION_NUMBER="
111020046" RET_VALUE_ON_UKNOWN="UNMATCH" RIGHT_PARENTHESIS="0">

<FILTER CASE_SENSITIVE="false" FILTER_ID="2547115646639713943" TYPE="contains">

<VALUE VALUE2="Flash"/>

</FILTER>

</CONDITION>

</EXPRESSION>

<ACTION DISABLED="false" NAME="add-to-group">

<PARAM NAME="temporary" VALUE="true"/>

<PARAM NAME="group-name" VALUE="id:-6458612277141846421;name:Adobe
Flash Running"/>

<PARAM NAME="item_key" VALUE="mac_or_ip"/>

<PARAM NAME="comment" VALUE=""/>

<SCHEDULE>

<START Class="Immediately"/>

<OCCURENCE onStart="true"/>

</SCHEDULE>

</ACTION>

</INNER_RULE>

<INNER_RULE APP_VERSION="8.2.2-731" CACHE_TTL="259200" CACHE_TTL_SYNCED="true" CLASSIFICATION="REG_STATUS" DES
CRIPTION="Upload the uninstaller into the script repository and have it push to the
endpoint and execute it with the silent uninstall option?
https://fpdownload.macromedia.com/get/flashplayer/current/support/uninstall_flash_player.exe
uninstall_flash_player.exe -uninstall Or to uninstall a specific
player type (ActiveX, NPAPI, or PPAPI), use the following:
uninstall_flash_player.exe -uninstall activex
uninstall_flash_player.exe -uninstall plugin
uninstall_flash_player.exe -uninstall
pepperplugin" ID="-7555287754841043925" NAME="Uninstall Adobe
Flash" NOT_COND_UPDATE="true" RECHECK_MAIN_RULE_DEF="true">

<MATCH_TIMING RATE="28800" SKIP_INACTIVE="true">

<ADMISSION ALL="true"/>

</MATCH_TIMING>

<EXPRESSION EXPR_TYPE="SIMPLE">

<!-- Rule expression. Rule name is: Uninstall Adobe Flash -->

<CONDITION EMPTY_LIST_VALUE="false" FIELD_NAME="process_no_ext" LABEL="Windows
Processes Running" LEFT_PARENTHESIS="0" LOGIC="AND" PLUGIN_NAME="HPS Inspection
Engine" PLUGIN_UNIQUE_NAME="va" PLUGIN_VESRION="11.1.2" PLUGIN_VESRION_NUMBER="
111020046" RET_VALUE_ON_UKNOWN="UNMATCH" RIGHT_PARENTHESIS="0">

<FILTER CASE_SENSITIVE="false" FILTER_ID="2974243046085011295" TYPE="contains">

<VALUE VALUE2="FLASH"/>

</FILTER>

</CONDITION>

</EXPRESSION>

<ACTION DISABLED="true" NAME="process_kill">

<PARAM NAME="process_name" VALUE="flash"/>

<SCHEDULE>

<START Class="Immediately"/>

<OCCURENCE onStart="true"/>

</SCHEDULE>

</ACTION>

<ACTION DISABLED="true" NAME="run_script">

<PARAM NAME="script_howtorun_ac" VALUE="uninstall_flash_player.exe
-uninstall"/>

<PARAM NAME="script_interactive" VALUE="false"/>

<PARAM NAME="define_time_to_run" VALUE="false"/>

<PARAM NAME="time_to_run" VALUE="1"/>

<SCHEDULE>

<START Class="Immediately"/>

<OCCURENCE onStart="true"/>

</SCHEDULE>

</ACTION>

</INNER_RULE>

</RULE_CHAIN>

<REPORT_TABLES/>

</RULE>

</RULES>
7.3.2 Java Removal Policy
The Java Removal policy checks if Java is running on a Windows Endpoint. If it is, this policy will terminate the process running Java and uninstall Java by running a script on the endpoint.
<?xml version="1.0" encoding="UTF-8" standalone="no"?>
<RULES>
<RULE APP_VERSION="8.2.2-731" CACHE_TTL="259200" CACHE_TTL_SYNCED="true"
CLASSIFICATION="REG_STATUS" DESCRIPTION=" "
ENABLED="true" ID="-1659136910494976646" NAME="Java Removal"
NOT_COND_UPDATE="true" UPGRADE_PERFORMED="true">
<GROUP_IN_FILTER>
<GROUP ID="1391284960034120761" NAME="Windows"/>
</GROUP_IN_FILTER>
<INACTIVITY_TTL TTL="0" USE_DEFAULT="true"/>
<ADMISSION_RESOLVE_DELAY TTL="0" USE_DEFAULT="true"/>
<MATCH_TIMING RATE="28800" SKIP_INACTIVE="true">
<ADMISSION ALL="true"/>
</MATCH_TIMING>
<EXPRESSION EXPR_TYPE="AND">
<!--Rule expression. Rule name is: Java Removal-->
<EXPRESSION EXPR_TYPE="SIMPLE">
<CONDITION EMPTY_LIST_VALUE="false" FIELD_NAME="process_no_ext"
LABEL="Windows Processes Running" LEFT_PARENTHESIS="0" LOGIC="AND"
PLUGIN_NAME="HPS Inspection Engine" PLUGIN_UNIQUE_NAME="va"
PLUGIN_VESRION="11.1.2" PLUGIN_VESRION_NUMBER="111020046"
RET_VALUE_ON_UKNOWN="UNMATCH" RIGHT_PARENTHESIS="0">
<FILTER CASE_SENSITIVE="false" FILTER_ID="3470905276050252920"
TYPE="contains">
<VALUE VALUE2="Java"/>
</FILTER>
</CONDITION>
</EXPRESSION>
<EXPRESSION EXPR_TYPE="SIMPLE">
<CONDITION EMPTY_LIST_VALUE="false" FIELD_NAME="nbthost"
LABEL="NetBIOS Hostname" LEFT_PARENTHESIS="0" LOGIC="AND"
PLUGIN_NAME="NBT Scanner" PLUGIN_UNIQUE_NAME="nbtscan_plugin"
PLUGIN_VESRION="3.2.1" PLUGIN_VESRION_NUMBER="32010012"
RET_VALUE_ON_UKNOWN="IRRESOLVED" RIGHT_PARENTHESIS="0">
<FILTER CASE_SENSITIVE="false" FILTER_ID="-575936128989425039"
TYPE="contains">
<VALUE VALUE2="PEWKWINSVR02"/>
</FILTER>
</CONDITION>
</EXPRESSION>
</EXPRESSION>
<EXCEPTION NAME="ip" UNKNOWN_EVAL="UNMATCH">
<RANGE FROM="10.131.5.2" TO="10.131.5.2"/>
<RANGE FROM="10.132.2.11" TO="10.132.2.11"/>
</EXCEPTION>
<EXCEPTION NAME="mac" UNKNOWN_EVAL="UNMATCH"/>
<EXCEPTION NAME="nbthost" UNKNOWN_EVAL="UNMATCH"/>
<EXCEPTION NAME="user" UNKNOWN_EVAL="UNMATCH"/>
<EXCEPTION NAME="group" UNKNOWN_EVAL="UNMATCH"/>
<ORIGIN NAME="CUSTOM"/>
<UNMATCH_TIMING RATE="28800" SKIP_INACTIVE="true">
<ADMISSION ALL="true"/>
</UNMATCH_TIMING>
<SEGMENT ID="2960766429758300381" NAME="Endpoints">
<RANGE FROM="10.132.6.0" TO="10.132.6.255"/>
<RANGE FROM="10.151.40.0" TO="10.151.40.255"/>
<RANGE FROM="192.168.1.0" TO="192.168.1.255"/>
</SEGMENT>
<RULE_CHAIN>
<INNER_RULE APP_VERSION="8.2.2-731" CACHE_TTL="259200"
CACHE_TTL_SYNCED="true" CLASSIFICATION="REG_STATUS" DESCRIPTION=""
ID="-7312022728321489321" NAME="Uninstall Java"
NOT_COND_UPDATE="true" RECHECK_MAIN_RULE_DEF="true">
<MATCH_TIMING RATE="28800" SKIP_INACTIVE="true">
<ADMISSION ALL="true"/>
</MATCH_TIMING>
<EXPRESSION EXPR_TYPE="SIMPLE">
<!--Rule expression. Rule name is: Uninstall Java-->
<CONDITION EMPTY_LIST_VALUE="false" FIELD_NAME="process_no_ext"
LABEL="Windows Processes Running" LEFT_PARENTHESIS="0" LOGIC="AND"
PLUGIN_NAME="HPS Inspection Engine" PLUGIN_UNIQUE_NAME="va"
PLUGIN_VESRION="11.1.2" PLUGIN_VESRION_NUMBER="111020046"
RET_VALUE_ON_UKNOWN="UNMATCH" RIGHT_PARENTHESIS="0">
<FILTER CASE_SENSITIVE="false" FILTER_ID="8761976385823184780"
TYPE="contains">
<VALUE VALUE2="java"/>
</FILTER>
</CONDITION>
</EXPRESSION>
<ACTION DISABLED="true" NAME="process_kill">
<PARAM NAME="process_name" VALUE="java"/>
<SCHEDULE>
<START Class="Immediately"/>
<OCCURENCE onStart="true"/>
</SCHEDULE>
</ACTION>
<ACTION DISABLED="false" NAME="run_script">
<PARAM NAME="script_howtorun_ac" VALUE="uninstall_java.ps1"/>
<PARAM NAME="script_interactive" VALUE="false"/>
<PARAM NAME="define_time_to_run" VALUE="false"/>
<PARAM NAME="time_to_run" VALUE="10"/>
<SCHEDULE>
<START Class="Immediately"/>
<OCCURENCE onStart="true"/>
</SCHEDULE>
</ACTION>
</INNER_RULE>
<INNER_RULE APP_VERSION="8.2.2-731" CACHE_TTL="259200"
CACHE_TTL_SYNCED="true" CLASSIFICATION="REG_STATUS" DESCRIPTION=""
ID="-8890693029182562272" NAME="Runing Java" NOT_COND_UPDATE="true"
RECHECK_MAIN_RULE_DEF="true">
<MATCH_TIMING RATE="28800" SKIP_INACTIVE="true">
<ADMISSION ALL="true"/>
</MATCH_TIMING>
<EXPRESSION EXPR_TYPE="SIMPLE">
<!--Rule expression. Rule name is: Runing Java-->
<CONDITION EMPTY_LIST_VALUE="false" FIELD_NAME="process_no_ext"
LABEL="Windows Processes Running" LEFT_PARENTHESIS="0" LOGIC="AND"
PLUGIN_NAME="HPS Inspection Engine" PLUGIN_UNIQUE_NAME="va"
PLUGIN_VESRION="11.1.2" PLUGIN_VESRION_NUMBER="111020046"
RET_VALUE_ON_UKNOWN="UNMATCH" RIGHT_PARENTHESIS="0">
<FILTER CASE_SENSITIVE="false" FILTER_ID="3138188613733535094"
TYPE="contains">
<VALUE VALUE2="Java"/>
</FILTER>
</CONDITION>
</EXPRESSION>
<ACTION DISABLED="false" NAME="add-to-group">
<PARAM NAME="temporary" VALUE="true"/>
<PARAM NAME="group-name" VALUE="id:-3761570262828389651;name:Java
Running"/>
<PARAM NAME="item_key" VALUE="mac_or_ip"/>
<PARAM NAME="comment" VALUE=""/>
<SCHEDULE>
<START Class="Immediately"/>
<OCCURENCE onStart="true"/>
</SCHEDULE>
</ACTION>
</INNER_RULE>
</RULE_CHAIN>
<REPORT_TABLES/>
</RULE>
</RULES>
7.3.3 Critical Vulnerability Quarantine Policy
The Critical Vulnerability Quarantine policy utilizes the Tenable VM plugin to determine if an endpoint has any known critical vulnerabilities. If it does, this policy uses Cisco ISE to quarantine the endpoint by utilizing the pxGrid plugin.
<?xml version="1.0" encoding="UTF-8" standalone="no"?>

<RULES>

    <RULE APP_VERSION="8.2.2-731" CACHE_TTL="259200"
CACHE_TTL_SYNCED="true" CLASSIFICATION="REG_STATUS" DESCRIPTION=""
ENABLED="true" ID="-663948591345721440" META_TYPE="COMPLY"
NAME="Forescout Critical Vulnerability Quarantine"
NOT_COND_UPDATE="true" UPGRADE_PERFORMED="true">

        <GROUP_IN_FILTER/>

        <INACTIVITY_TTL TTL="0" USE_DEFAULT="true"/>

        <ADMISSION_RESOLVE_DELAY TTL="0" USE_DEFAULT="true"/>

        <MATCH_TIMING RATE="28800" SKIP_INACTIVE="true">

            <ADMISSION ALL="true"/>

        </MATCH_TIMING>

        <EXPRESSION EXPR_TYPE="SIMPLE">

            <!--Rule expression. Rule name is: Forescout Critical Vulnerability
Quarantine-->

            <CONDITION EMPTY_LIST_VALUE="false" FIELD_NAME="nbthost"
LABEL="NetBIOS Hostname" LEFT_PARENTHESIS="0" LOGIC="AND"
PLUGIN_NAME="NBT Scanner" PLUGIN_UNIQUE_NAME="nbtscan_plugin"
PLUGIN_VESRION="3.2.1" PLUGIN_VESRION_NUMBER="32010012"
RET_VALUE_ON_UKNOWN="IRRESOLVED" RIGHT_PARENTHESIS="0">

                <FILTER CASE_SENSITIVE="false" FILTER_ID="-847734611131793936"
TYPE="contains">

                    <VALUE VALUE2="PEWKWINSVR02"/>

                </FILTER>

            </CONDITION>

        </EXPRESSION>

        <EXCEPTION NAME="ip" UNKNOWN_EVAL="UNMATCH"/>

        <EXCEPTION NAME="mac" UNKNOWN_EVAL="UNMATCH"/>

        <EXCEPTION NAME="nbthost" UNKNOWN_EVAL="UNMATCH"/>

        <EXCEPTION NAME="user" UNKNOWN_EVAL="UNMATCH"/>

        <EXCEPTION NAME="group" UNKNOWN_EVAL="UNMATCH"/>

        <ORIGIN NAME="CUSTOM"/>

        <UNMATCH_TIMING RATE="28800" SKIP_INACTIVE="true">

            <ADMISSION ALL="true"/>

        </UNMATCH_TIMING>

        <SEGMENT ID="2960766429758300381" NAME="Endpoints">

            <RANGE FROM="10.132.6.0" TO="10.132.6.255"/>

            <RANGE FROM="10.151.40.0" TO="10.151.40.255"/>

            <RANGE FROM="192.168.1.0" TO="192.168.1.255"/>

        </SEGMENT>

        <RULE_CHAIN>

            <INNER_RULE APP_VERSION="8.2.2-731" CACHE_TTL="259200"
CACHE_TTL_SYNCED="true" CLASSIFICATION="REG_STATUS" DESCRIPTION=""
ID="-7308160423478365115" NAME="CriticalVuln pxGrid Policy"
NOT_COND_UPDATE="true" RECHECK_MAIN_RULE_DEF="true">

                <MATCH_TIMING RATE="28800" SKIP_INACTIVE="true">

                    <ADMISSION ALL="true"/>

                </MATCH_TIMING>

                <META_TYPE STATE="NA"/>

                <ACTION DISABLED="false" NAME="apply_anc_policy">

                    <PARAM NAME="policy_name" VALUE="Forescout"/>

                    <SCHEDULE>

                        <START Class="Immediately"/>

                        <OCCURENCE onStart="true"/>

                    </SCHEDULE>

                </ACTION>

                <ACTION DISABLED="false" NAME="balloon_message">

                    <PARAM NAME="msg" VALUE="You have been quarantined. Please update
your computer or contact the helpdesk for assistence."/>

                    <PARAM NAME="look" VALUE="info"/>

                    <SCHEDULE>

                        <START Class="Immediately"/>

                        <OCCURENCE onStart="true"/>

                    </SCHEDULE>

                </ACTION>

            </INNER_RULE>

        </RULE_CHAIN>

        <REPORT_TABLES/>

    </RULE>

</RULES>
7.3.4 Force Windows Update Policy
The Force Windows Update policy will force a Windows update on an endpoint with Windows Update enabled by utilizing Forescout’s capability to determine if vulnerabilities exist on that endpoint.
<?xml version="1.0" encoding="UTF-8" standalone="no"?>
<RULES>
<RULE APP_VERSION="8.2.2-731" CACHE_TTL="259200"
CACHE_TTL_SYNCED="true" CLASSIFICATION="REG_STATUS"
DESCRIPTION=" " ENABLED="true"
ID="8956849743087666010" NAME="Force Windows Update"
NOT_COND_UPDATE="true" UPGRADE_PERFORMED="true">
<GROUP_IN_FILTER/>
<INACTIVITY_TTL TTL="0" USE_DEFAULT="true"/>
<ADMISSION_RESOLVE_DELAY TTL="0" USE_DEFAULT="true"/>
<MATCH_TIMING RATE="28800" SKIP_INACTIVE="true">
<ADMISSION ALL="true"/>
</MATCH_TIMING>
<EXPRESSION EXPR_TYPE="SIMPLE">
<!--Rule expression. Rule name is: Force Windows Update-->
<CONDITION EMPTY_LIST_VALUE="false" FIELD_NAME="vulns"
LABEL="Microsoft Vulnerabilities" LEFT_PARENTHESIS="0" LOGIC="AND"
PLUGIN_NAME="HPS Inspection Engine" PLUGIN_UNIQUE_NAME="va"
PLUGIN_VESRION="11.1.2" PLUGIN_VESRION_NUMBER="111020046"
RET_VALUE_ON_UKNOWN="IRRESOLVED" RIGHT_PARENTHESIS="0">
<FILTER AUTO_UPDATE="true" FILTER_ID="-32838886002658939"
OPTIONS_DIGEST="b3eaa0cf6df1fc550859e51703f2665a">
<OPT VALUE="KB890830-141"/>
<OPT VALUE="KB890830-139"/>
<OPT VALUE="KB890830-144"/>
<OPT VALUE="KB890830-138"/>
<OPT VALUE="KB890830-143"/>
<OPT VALUE="KB890830-140"/>
<OPT VALUE="KB890830-148"/>
<OPT VALUE="KB890830-145"/>
<OPT VALUE="KB890830-136"/>
<OPT VALUE="KB890830-151"/>
<OPT VALUE="KB890830-146"/>
<OPT VALUE="KB890830-142"/>
<OPT VALUE="KB890830-147"/>
<OPT VALUE="KB890830-31"/>
<OPT VALUE="KB890830-137"/>
<OPT VALUE="KB890830-150"/>
<OPT VALUE="KB890830-149"/>
</FILTER>
</CONDITION>
</EXPRESSION>
<ACTION DISABLED="false" NAME="remediate_wua">
<PARAM NAME="update_type" VALUE="keep_update_settings"/>
<PARAM NAME="wsus_target_group" VALUE=""/>
<PARAM NAME="automatic_updates_type" VALUE="keep_update_settings"/>
<PARAM NAME="use_default_if_disabled" VALUE="false"/>
<SCHEDULE>
<START Class="Immediately"/>
<OCCURENCE onStart="true"/>
</SCHEDULE>
</ACTION>
<EXCEPTION NAME="ip" UNKNOWN_EVAL="UNMATCH">
<RANGE FROM="10.131.5.2" TO="10.131.5.2"/>
<RANGE FROM="10.132.2.11" TO="10.132.2.11"/>
</EXCEPTION>
<EXCEPTION NAME="mac" UNKNOWN_EVAL="UNMATCH"/>
<EXCEPTION NAME="nbthost" UNKNOWN_EVAL="UNMATCH"/>
<EXCEPTION NAME="user" UNKNOWN_EVAL="UNMATCH"/>
<EXCEPTION NAME="group" UNKNOWN_EVAL="UNMATCH"/>
<ORIGIN NAME="CUSTOM"/>
<UNMATCH_TIMING RATE="28800" SKIP_INACTIVE="true">
<ADMISSION ALL="true"/>
</UNMATCH_TIMING>
<SEGMENT ID="2960766429758300381" NAME="Endpoints">
<RANGE FROM="10.132.6.0" TO="10.132.6.255"/>
<RANGE FROM="10.151.40.0" TO="10.151.40.255"/>
<RANGE FROM="192.168.1.0" TO="192.168.1.255"/>
</SEGMENT>
<RULE_CHAIN/>
<REPORT_TABLES/>
</RULE>
</RULES>
7.3.5 Agent Compliance Check Policy
The Agent Compliance Check policy will determine if a Windows endpoint has the Microsoft Endpoint Configuration Manager agent installed by seeing if the endpoint has checked in with Endpoint Configuration Manager.
<?xml version="1.0" encoding="UTF-8" standalone="no"?>

<RULES>

    <RULE APP_VERSION="8.2.2-731" CACHE_TTL="259200"
CACHE_TTL_SYNCED="true" CLASSIFICATION="REG_STATUS" DESCRIPTION=""
ENABLED="true" ID="-329523829728915879" NAME="SCCM Agent Compliance"
NOT_COND_UPDATE="true" UPGRADE_PERFORMED="true">

        <GROUP_IN_FILTER>

            <GROUP ID="1391284960034120761" NAME="Windows"/>

        </GROUP_IN_FILTER>

        <INACTIVITY_TTL TTL="0" USE_DEFAULT="true"/>

        <ADMISSION_RESOLVE_DELAY TTL="0" USE_DEFAULT="true"/>

        <MATCH_TIMING RATE="28800" SKIP_INACTIVE="true">

            <ADMISSION ALL="true"/>

        </MATCH_TIMING>

        <EXPRESSION EXPR_TYPE="SIMPLE">

            <!--Rule expression. Rule name is: SCCM Agent Compliance-->

            <CONDITION EMPTY_LIST_VALUE="false" FIELD_NAME="Client_registered"
LABEL="SMS/SCCM Client Registration Status" LEFT_PARENTHESIS="0"
LOGIC="AND" PLUGIN_NAME="Microsoft SMS/SCCM" PLUGIN_UNIQUE_NAME="sms"
PLUGIN_VESRION="2.4.4" PLUGIN_VESRION_NUMBER="24040014"
RET_VALUE_ON_UKNOWN="IRRESOLVED" RIGHT_PARENTHESIS="0">

                <FILTER AUTO_UPDATE="false" FILTER_ID="8830579494271797354"
OPTIONS_DIGEST="93e42278ee53b84f8427494bd2a235c6">

                    <OPT VALUE="db_found_true"/>

                </FILTER>

            </CONDITION>

        </EXPRESSION>

        <ACTION DISABLED="false" NAME="add-to-group">

            <PARAM NAME="temporary" VALUE="true"/>

            <PARAM NAME="group-name" VALUE="id:8255406739413382154;name:SCCM
Client Registered"/>

            <PARAM NAME="item_key" VALUE="mac_or_ip"/>

            <PARAM NAME="comment" VALUE=""/>

            <SCHEDULE>

                <START Class="Immediately"/>

                <OCCURENCE onStart="true"/>

            </SCHEDULE>

        </ACTION>

        <EXCEPTION NAME="ip" UNKNOWN_EVAL="UNMATCH"/>

        <EXCEPTION NAME="mac" UNKNOWN_EVAL="UNMATCH"/>

        <EXCEPTION NAME="nbthost" UNKNOWN_EVAL="UNMATCH"/>

        <EXCEPTION NAME="user" UNKNOWN_EVAL="UNMATCH"/>

        <EXCEPTION NAME="group" UNKNOWN_EVAL="UNMATCH"/>

        <ORIGIN NAME="CUSTOM"/>

        <UNMATCH_TIMING RATE="28800" SKIP_INACTIVE="true">

            <ADMISSION ALL="true"/>

        </UNMATCH_TIMING>

        <SEGMENT ID="2960766429758300381" NAME="Endpoints">

            <RANGE FROM="10.132.6.0" TO="10.132.6.255"/>

            <RANGE FROM="10.151.40.0" TO="10.151.40.255"/>

            <RANGE FROM="192.168.1.0" TO="192.168.1.255"/>

        </SEGMENT>

        <RULE_CHAIN/>

        <REPORT_TABLES/>

    </RULE>

</RULES>
7.3.6 SCCM Agent Non Compliant Check Policy
The SCCM Agent Non Compliant Check policy will determine if a Windows endpoint is non-compliant by seeing if the endpoint has or has not checked into Microsoft Endpoint Configuration Manager.
<?xml version="1.0" encoding="UTF-8" standalone="no"?>

<RULES>

    <RULE APP_VERSION="8.2.2-731" CACHE_TTL="259200"
CACHE_TTL_SYNCED="true" CLASSIFICATION="REG_STATUS" DESCRIPTION=""
ENABLED="true" ID="6927087801731630440" NAME="SCCM Agent Non
Compliant Check" NOT_COND_UPDATE="true" UPGRADE_PERFORMED="true">

        <GROUP_IN_FILTER/>

        <INACTIVITY_TTL TTL="0" USE_DEFAULT="true"/>

        <ADMISSION_RESOLVE_DELAY TTL="0" USE_DEFAULT="true"/>

        <MATCH_TIMING RATE="28800" SKIP_INACTIVE="true">

            <ADMISSION ALL="true"/>

        </MATCH_TIMING>

        <EXPRESSION EXPR_TYPE="SIMPLE">

            <!--Rule expression. Rule name is: SCCM Agent Non Compliant Check-->

            <CONDITION EMPTY_LIST_VALUE="false" FIELD_NAME="Client_registered"
LABEL="SMS/SCCM Client Registration Status" LEFT_PARENTHESIS="0"
LOGIC="AND" PLUGIN_NAME="Microsoft SMS/SCCM" PLUGIN_UNIQUE_NAME="sms"
PLUGIN_VESRION="2.4.4" PLUGIN_VESRION_NUMBER="24040014"
RET_VALUE_ON_UKNOWN="IRRESOLVED" RIGHT_PARENTHESIS="0">

                <FILTER AUTO_UPDATE="false" FILTER_ID="-9113011034532548035"
OPTIONS_DIGEST="93e42278ee53b84f8427494bd2a235c6">

                    <OPT VALUE="db_found_false"/>

                </FILTER>

            </CONDITION>

        </EXPRESSION>

        <ACTION DISABLED="false" NAME="add-to-group">

            <PARAM NAME="temporary" VALUE="true"/>

            <PARAM NAME="group-name" VALUE="id:6514702438169432101;name:SCCM
Missing Agent"/>

            <PARAM NAME="item_key" VALUE="mac_or_ip"/>

            <PARAM NAME="comment" VALUE=""/>

            <SCHEDULE>

                <START Class="Immediately"/>

                <OCCURENCE onStart="true"/>

           </SCHEDULE>

        </ACTION>

        <EXCEPTION NAME="ip" UNKNOWN_EVAL="UNMATCH"/>

        <EXCEPTION NAME="mac" UNKNOWN_EVAL="UNMATCH"/>

        <EXCEPTION NAME="nbthost" UNKNOWN_EVAL="UNMATCH"/>

        <EXCEPTION NAME="user" UNKNOWN_EVAL="UNMATCH"/>

        <EXCEPTION NAME="group" UNKNOWN_EVAL="UNMATCH"/>

        <ORIGIN NAME="CUSTOM"/>

        <UNMATCH_TIMING RATE="28800" SKIP_INACTIVE="true">

            <ADMISSION ALL="true"/>

        </UNMATCH_TIMING>

        <SEGMENT ID="2960766429758300381" NAME="Endpoints">

            <RANGE FROM="10.132.6.0" TO="10.132.6.255"/>

            <RANGE FROM="10.151.40.0" TO="10.151.40.255"/>

            <RANGE FROM="192.168.1.0" TO="192.168.1.255"/>

        </SEGMENT>

        <RULE_CHAIN/>

        <REPORT_TABLES/>

    </RULE>

</RULES>
7.4 Forescout Maintenance
Forescout releases suggested updates and plugins in the Forescout Console and through its ActiveCare Maintenance and Support policy.
8 IBM
We used two cloud-based IBM offerings for this build. One, IBM MaaS360 with Watson, was used for endpoint management for desktop and laptop computers in the first phase, and for Android and iOS mobile devices in the second phase. The second offering, the IBM Code Risk Analyzer, was used during the second phase to scan source code in cloud-based containers for vulnerabilities. This section shows how each cloud-based service was configured and used for the build.
8.1 IBM Code Risk Analyzer
The IBM Code Risk Analyzer, a feature of IBM Cloud Continuous Delivery for DevSecOps application architectures, enables developers to quickly assess and remediate security and legal risks that they are potentially introducing into source code and provides them direct actionable feedback. It works with code repositories such as Git to analyze your application, perform a set of compliance control checks, produce a bill of materials, and report vulnerability findings. Code Risk Analyzer is provided as a set of Tekton tasks, which can be easily incorporated into delivery pipelines. Also, it is available as a managed service on IBM Cloud, which eliminates the need to host your own infrastructure to run these delivery pipelines. This section illustrates how we configured Code Risk Analyzer on IBM Cloud to embed and use in development workflows.
8.1.1 Getting Ready
No software installation is required to use Code Risk Analyzer on IBM Cloud. However, make sure you have an active IBM Cloud account.
All the Tekton pipeline definitions for Code Risk Analyzer are open-sourced and publicly available.
We used this sample cloud native micro-service application to demonstrate the configuration and analysis via a delivery pipeline. You need to fork this application under your authorized account for the code repository. If you have any other micro-service application, you can use that as well. Make sure you have WRITE access to the code repository that you plan to use.
8.1.2 Creating Your Toolchain
Follow these steps to create and populate your toolchain:
Login to your IBM Cloud account and select DevOps from the service catalog on the left. The dashboard for Toolchains opens.
Select Create toolchain > Build your own toolchain. Give a name to your toolchain and click Create.
Once the toolchain is created, it needs to be populated with developer tools. Click the Add tool button to add the following tools to the toolchain:
Github (code repository for Code Risk Analyzer Tekton definition): configure it as shown below. Note: For a first-time user, it will ask you to authorize IBM Cloud to access your code repository account. This one-time authorization is necessary.
Github (code repository for our sample application): perform a similar integration as above for your application repository.
DevOps Insights (required for authorization and integration): no configuration is necessary, but make sure it is added to your Toolchain workspace.
Delivery Pipeline (automation engine for our pipeline): first give it a Name and select “Tekton” as the Pipeline Type. The next section contains more detailed information on pipeline configuration.
At this point, your toolchain workspace should have the tools depicted below.
8.1.3 Configuring Delivery Pipeline
The core logic of configuring Code Risk Analyzer is in the Delivery Pipeline. We need to perform four sections of configuration:
Definition is where we specify the source for our Code Risk Analyzer pipeline definitions. To do so, click Add multiple times to add the following list of locations for sources. When done, click Save.
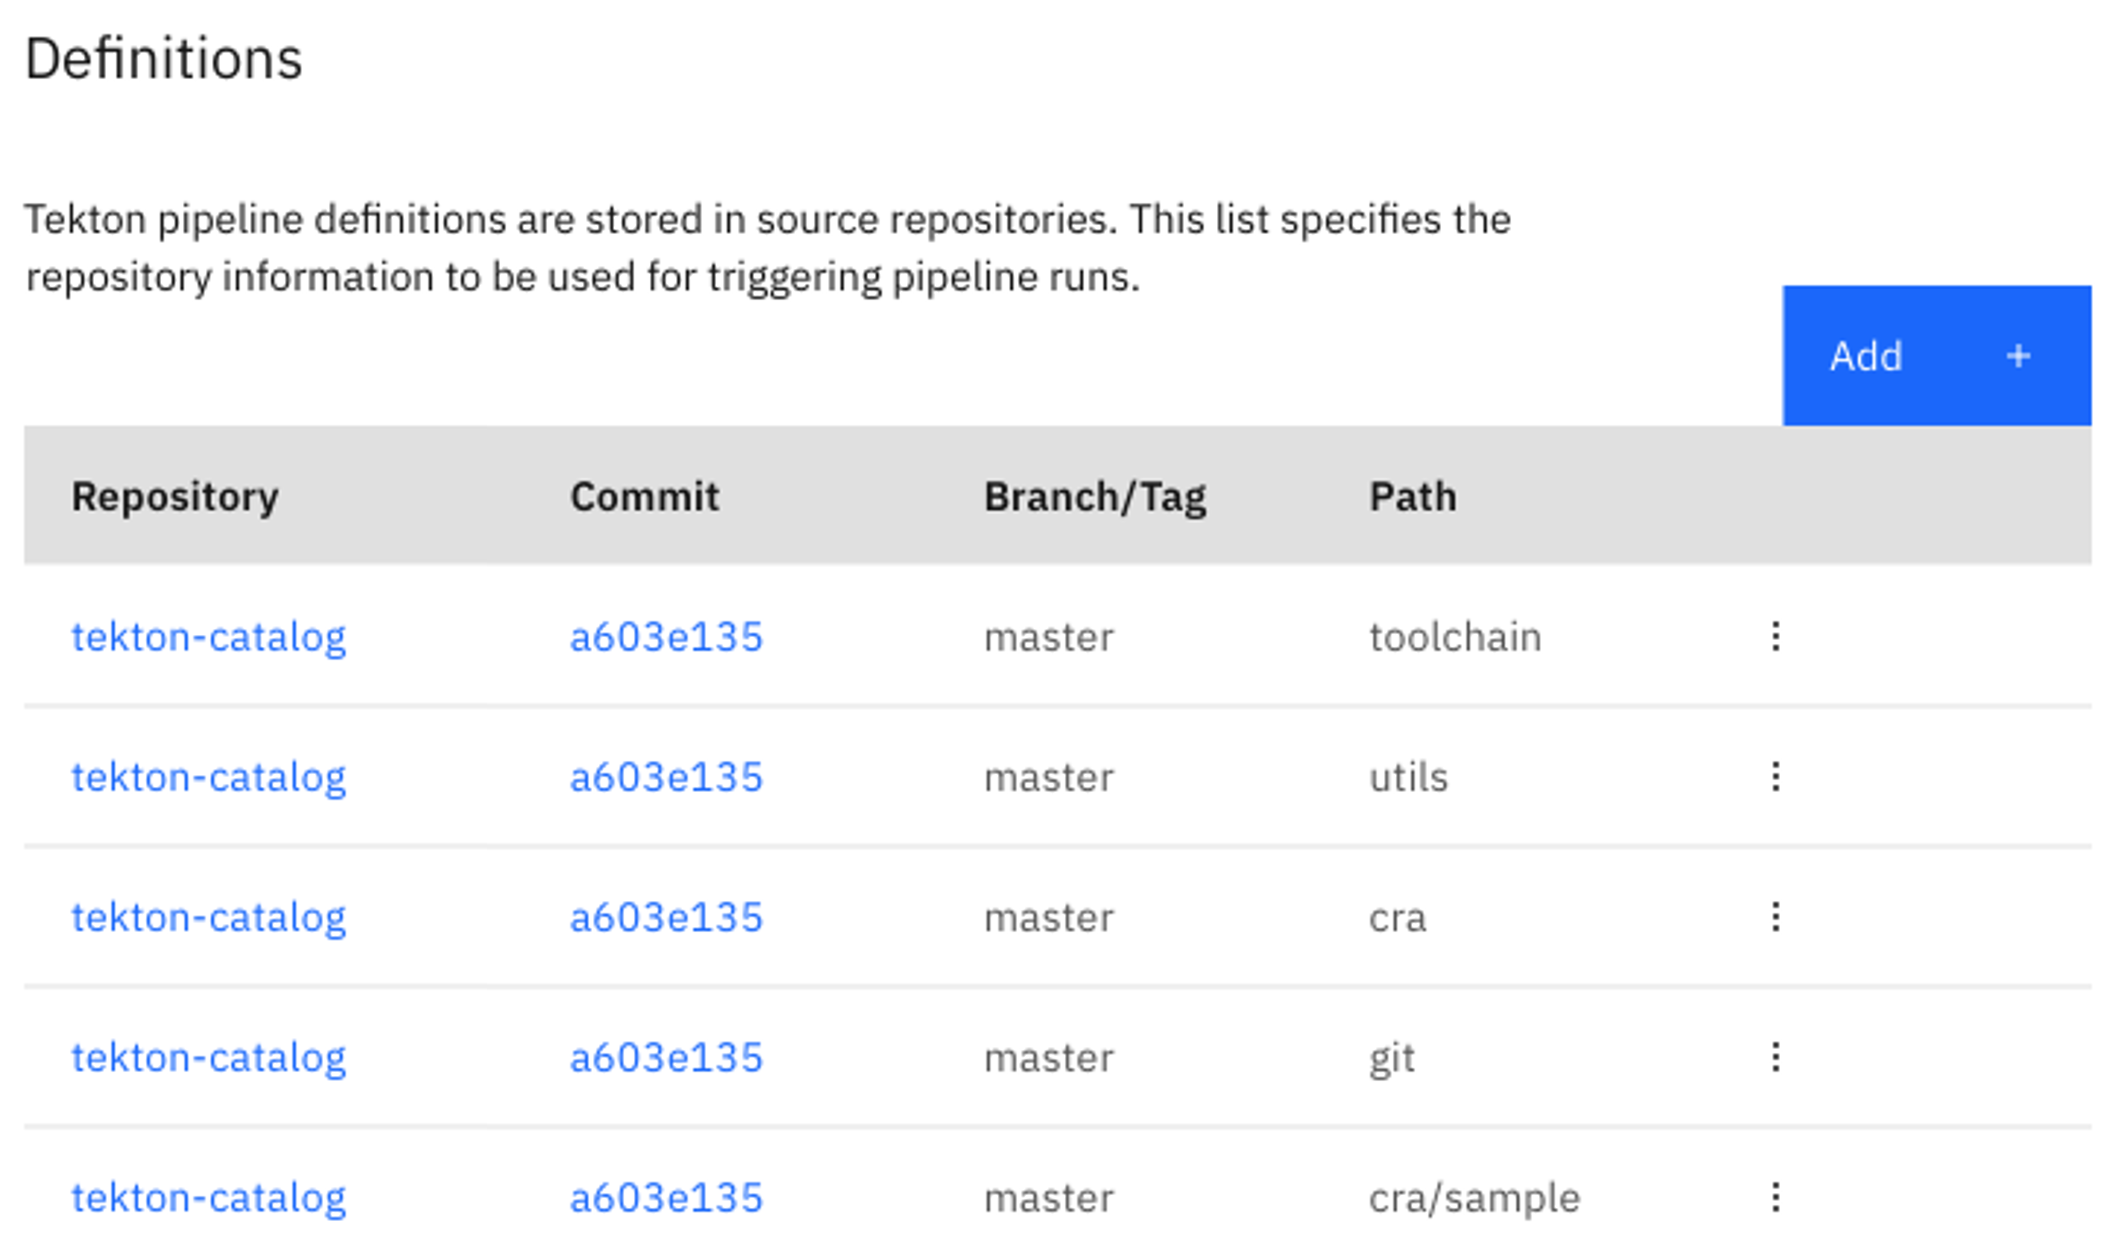
Worker allows us to select the cluster where the pipeline should execute. We used a managed Kubernetes worker on IBM Cloud to run our pipeline. To do so, select IBM Managed workers from the drop-down list.
Trigger allows us to specify “when” or on which events we want to execute a Code Risk Analyzer scan on a code repository. To configure this, select our sample application code repository, then enable the option to run when a pull request is opened or updated.
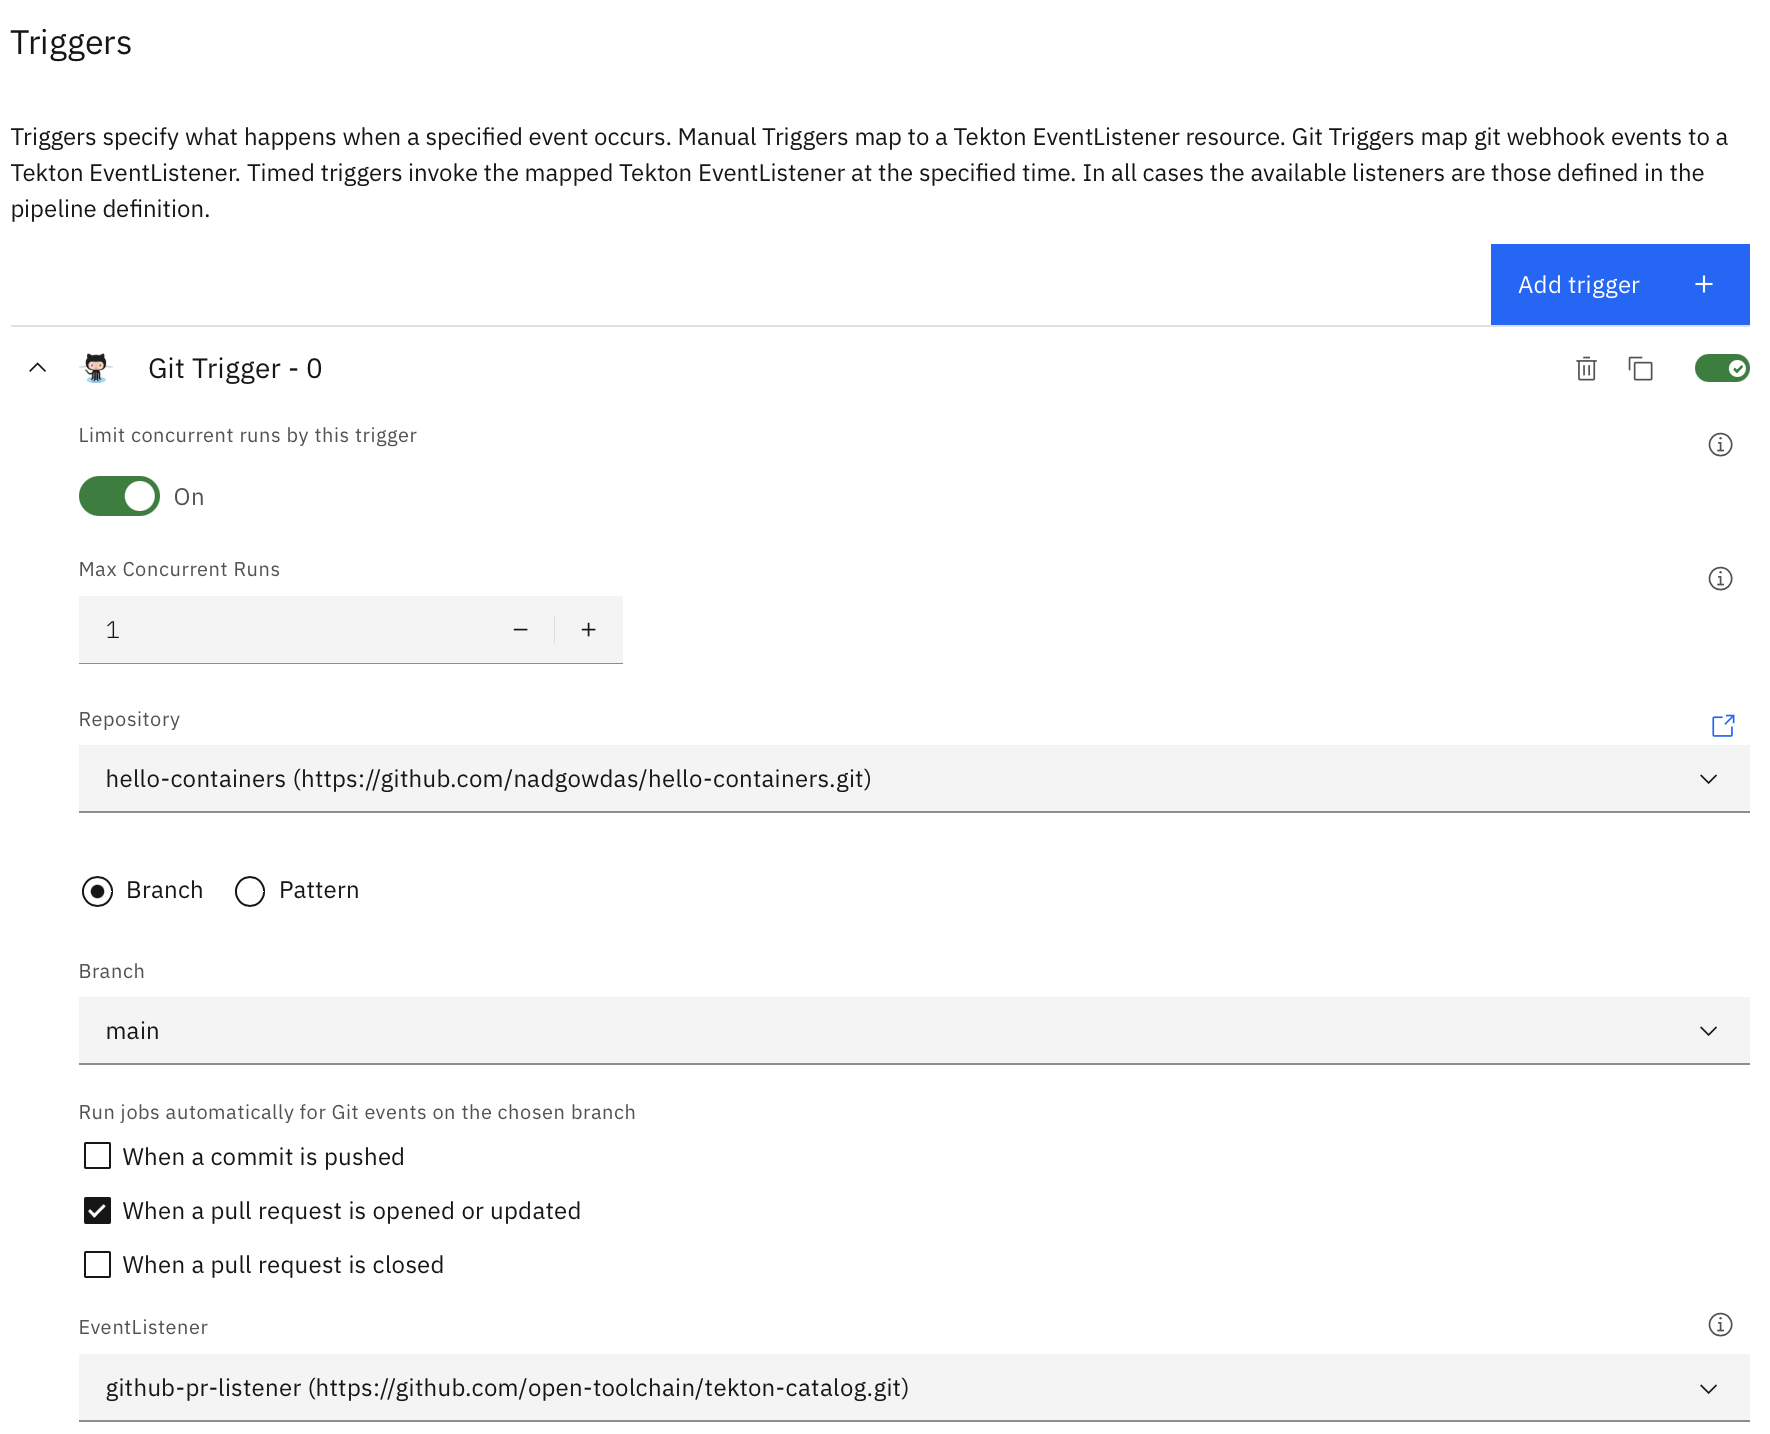
Environment Properties allows you to store name-value pairs for use in your pipeline. For this build, specify a Secure value type named apikey with the API_KEY for your IBM Cloud account. You can create a new API_KEY with Manage > Access (IAM) -> API Keys.
At this point, your pipeline is successfully created and configured to be executed. As per our trigger configuration, it will be automatically executed on any “Pull Request” on our application repository.
8.1.4 Executing the Developer Workflow
To demonstrate the developer workflow execution, perform the following steps:
Switch to the application repository.
Make some code change and create a pull request against the “main” branch. This should automatically trigger our Code Risk Analyzer pipeline on IBM Cloud. You can view the status of our pipeline execution in our configured pipeline.
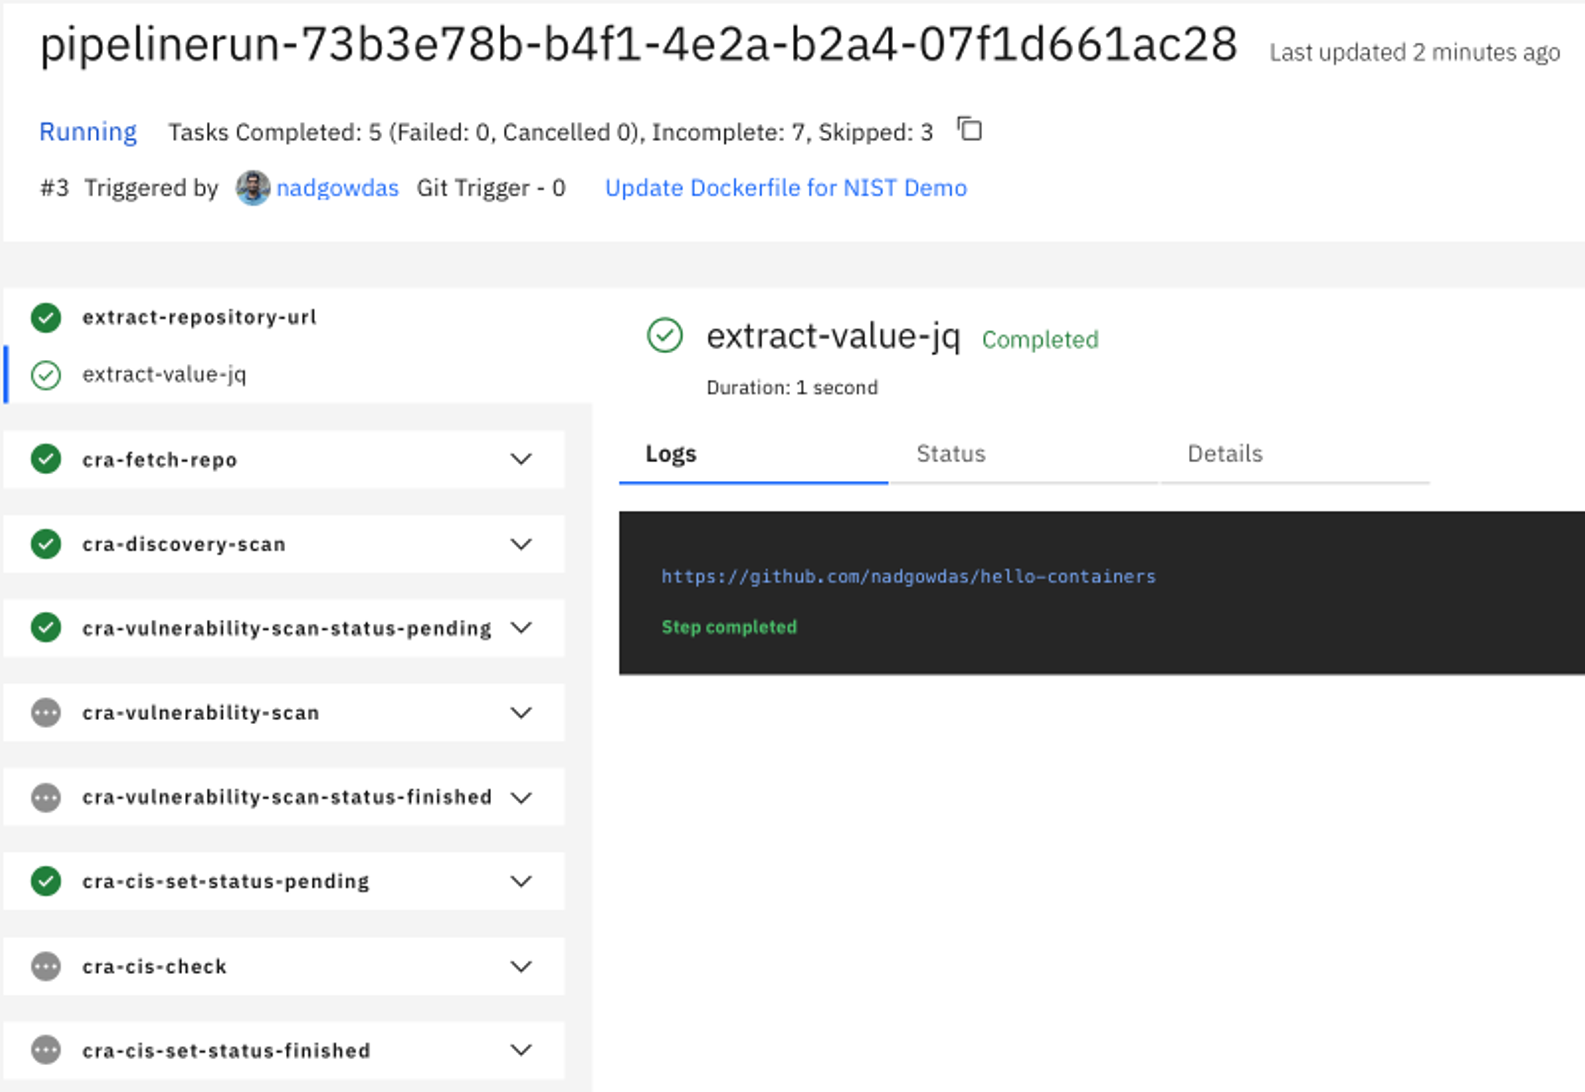
Once all these pipeline tasks finish, they emit their findings as git-comments to your original pull request.
8.1.5 Reviewing the Code Risk Analyzer Results
After successful execution of our pipeline, you can find the following updates in your pull requests:
Deployment Configuration Analysis. If there are any Kubernetes deployment manifests (*.yaml) in the code repository, they are scanned against Docker CIS Benchmarks to identify any failures to follow best practices.
Vulnerability Report. The Code Risk Analyzer allows you to discover vulnerabilities in your application (Python, Node.js, Java, golang) and OS stack (base image) based on rich threat intelligence from Snyk. It also provides fix recommendations, as the example below illustrates.
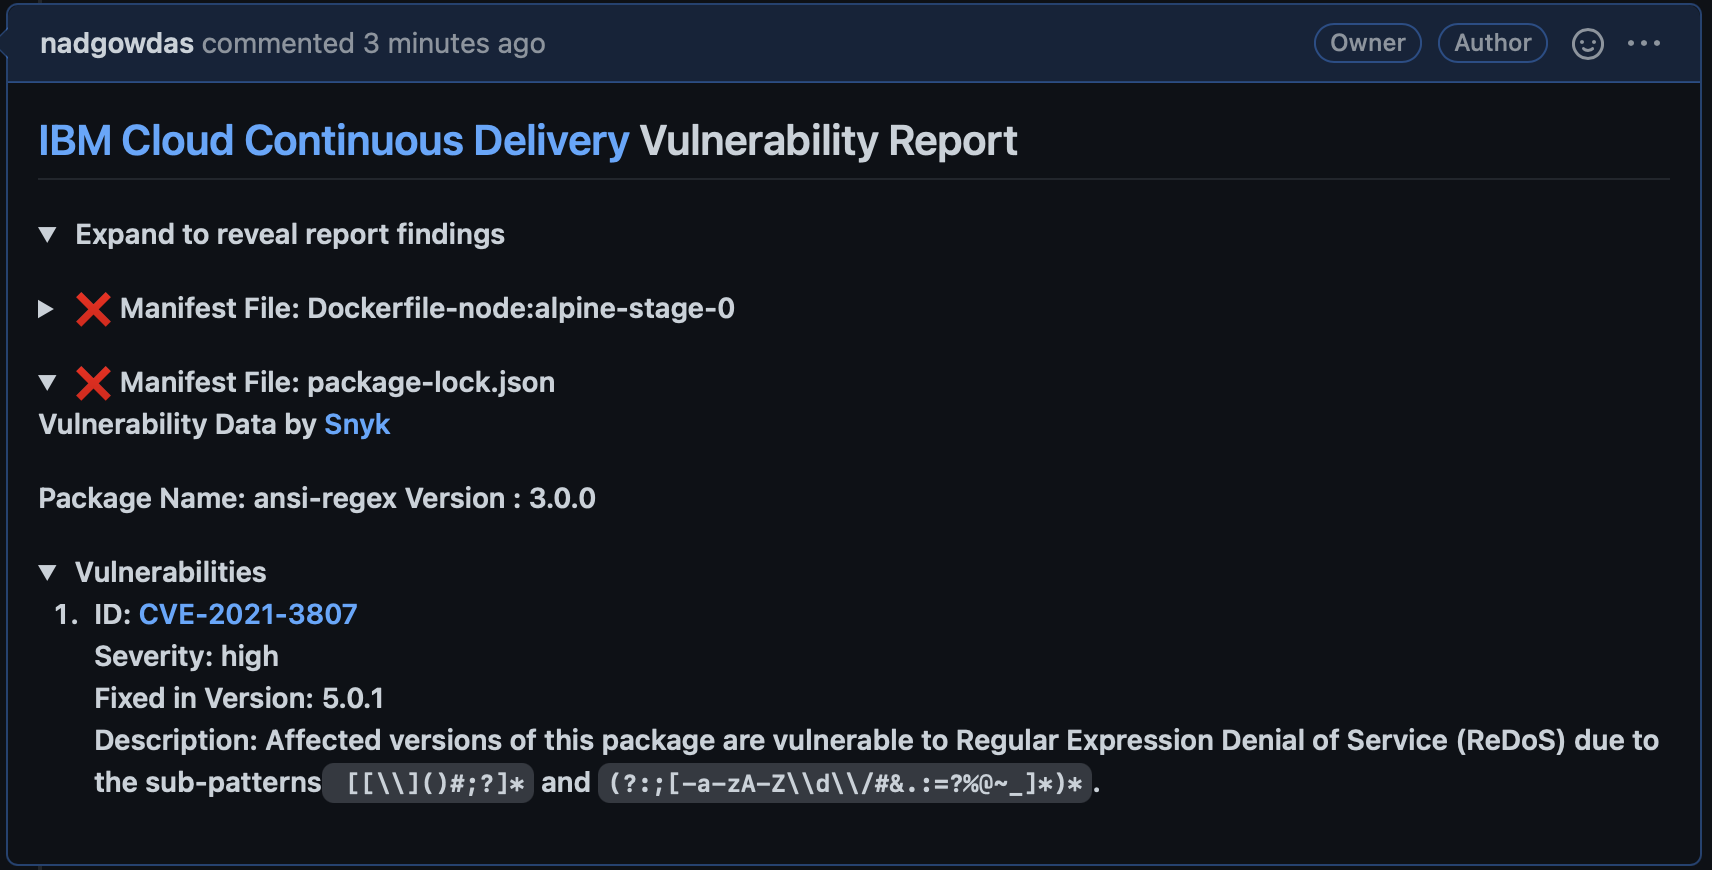
Bill of Materials. The Code Risk Analyzer generates a Bill of Materials (BoM) accounting for all the dependencies and their sources for your application. The BoM is produced in JSON format. The image below shows a portion of a BoM example.
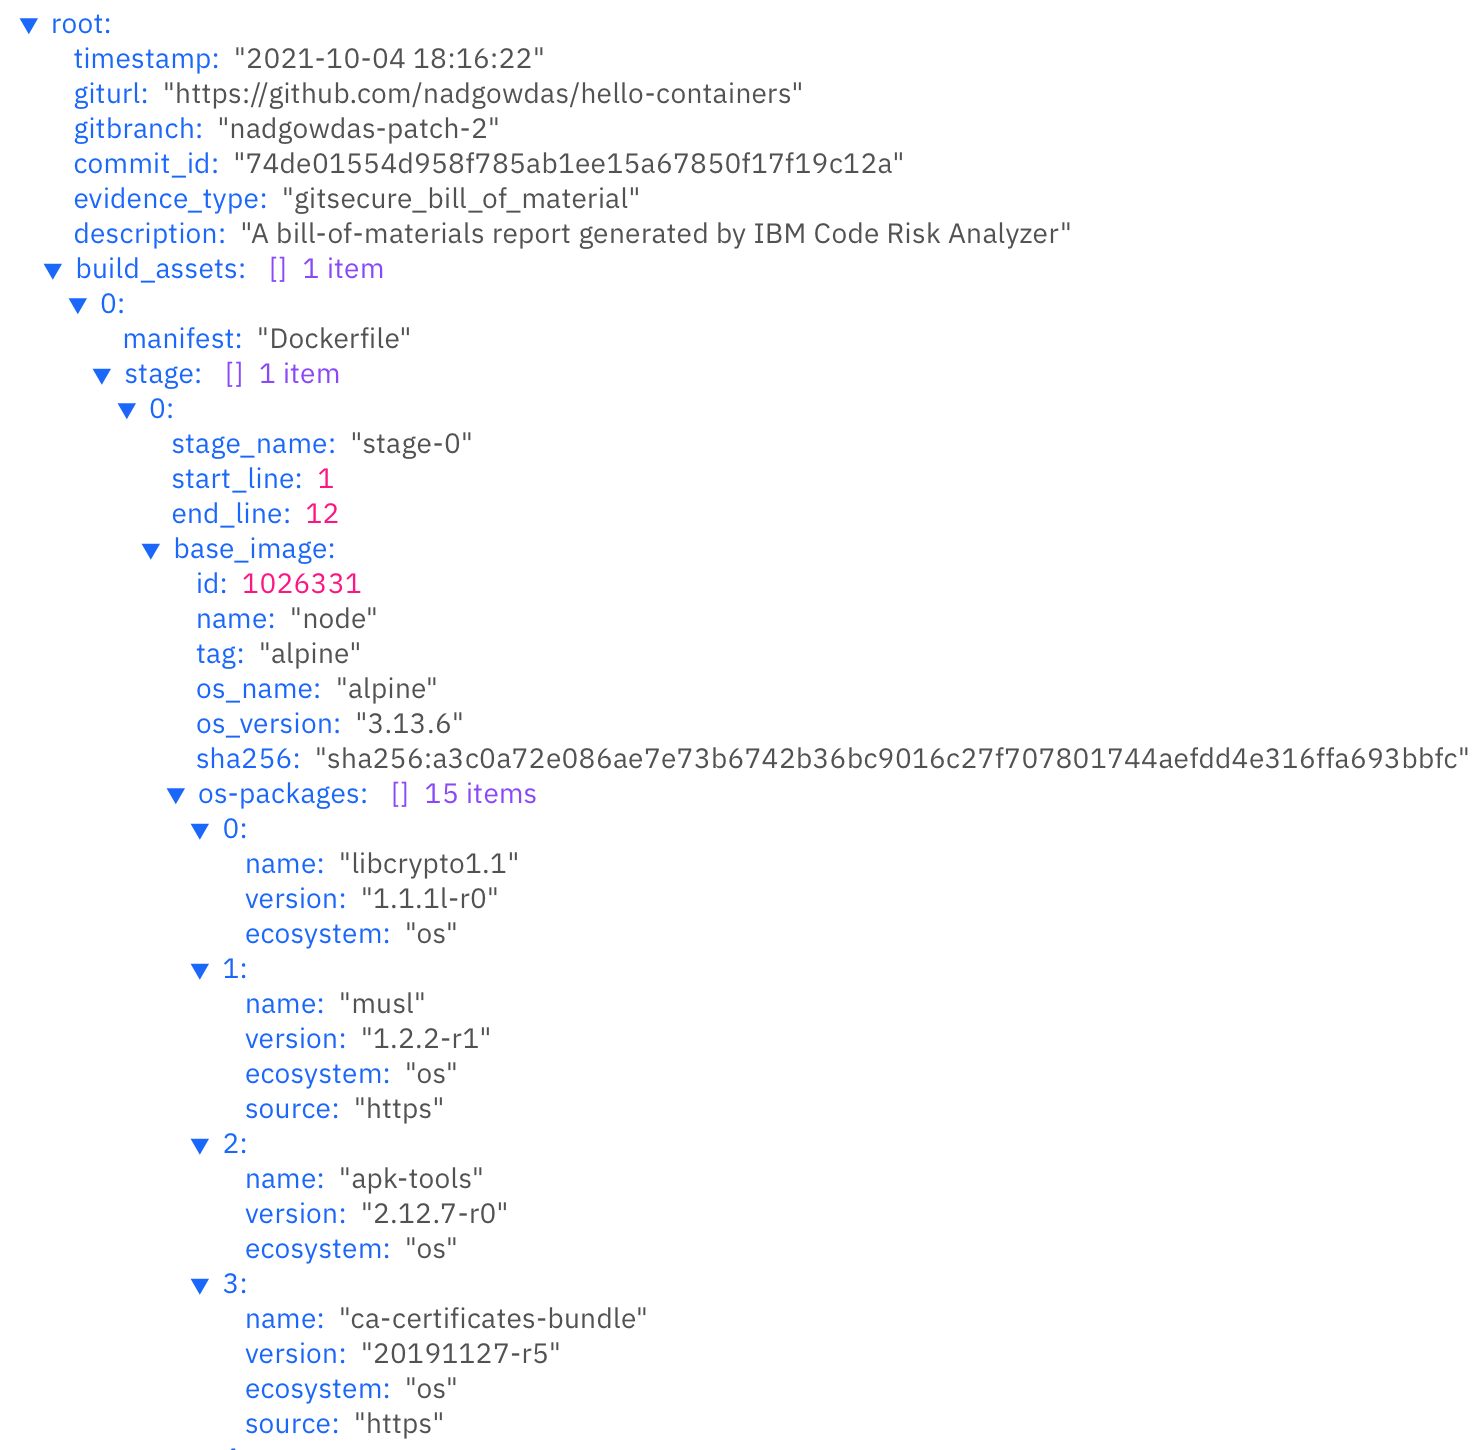
Git Status. In addition to git comments describing the security findings, Code Risk Analyzer also assigns Pass/Fail status to the pull request. This allows the application owner to enforce policy-based gates to automatically block code changes with security failures.
Terraform Scan. Terraform is frequently used to define and configure cloud-based infrastructure for proper application deployment. The Code Risk Analyzer also scans any terraform provider files to detect compliance issues before actual deployment. Examples of compliance checks include requirements for the minimum strength of passwords, and identity and access management (IAM) requirements for users and services. Code Risk Analyzer supports the configuration of a profile for terraform scans; this enables choosing rule parameters and which rules to run. An embedded JSON file in the Git repo can contain the following properties, which are also illustrated in the screenshot below:
“scc_goals” - SCC goals to evaluate by goal ID
“scc_goal_parameters” - Parameter values for configurable SCC goals
8.2 IBM MaaS360 with Watson Phase 1
IBM MaaS360 with Watson is a cloud-based platform that enterprises can utilize for enterprise mobile device management (MDM) and desktop/laptop management. MaaS360 allows users to enroll organization-owned and personal devices. Administrators can send enrollment requests to users, centrally manage security policies, wipe corporate data, and push apps to devices. IBM MaaS360 is operated using an online portal. The platform system requirements for IBM MaaS360 components like client device OSs and web browsers are listed here.
Our build used this service for asset identification and assessment, routine and emergency patching, emergency mitigations, and isolation of assets that cannot be patched. For the first phase of our build, our managed devices were a MacBook Pro and a Windows 10 virtual desktop. For the second phase of this project, Android and iOS mobile devices were managed.
MaaS360 provides a Quick Start guide for customers when logging in for the first time. The guide helps with setting up device enrollment, establishing security policies, configuring corporate email, and enrolling devices. For this lab, a corporate identifier was set up, as well as an internal AD (lab.nccoe.org), as the default identification mode. The corporate identifier allows users to enroll their devices in MaaS360. More information on configuration can be found here.
8.2.1 Enrolling Devices
IBM MaaS360 supports traditional endpoints running Windows 10 and up, as well as macOS endpoints. Device enrollment is critical in helping enterprises register devices and apply device management policies that are specific to their organization. The IBM MaaS360 Portal handles all enrollment settings for devices, apps, and users.
The device enrollment process is as follows:
Select SETUP, then choose Settings.
Click Device Enrollment Settings and set the corporate identifier that users will utilize to enroll devices. It will also be shown in the enrollment URLs. In our lab, we set the identifier to “nccoelab”. Additional device enrollment settings can be found here.
Open a web browser and proceed to the MaaS360 enrollment URL.
Enter your credentials.
Review and accept the terms and conditions.
Install the MDM profile.
Figure 8-1 provides a sample of enrolled devices utilized in this lab.
Figure 8‑1 Sample of Enrolled Devices
See the linked pages for detailed enrollment instructions, including bulk enrollment, for macOS devices and Windows devices.
8.2.2 Cloud Extender Installation
The IBM MaaS360 Cloud Extender allows enterprises to integrate mobile devices with corporate on-premises and cloud-based resources. The Cloud Extender is installed on a Microsoft Windows server behind the firewall to allow users and devices to use internal resources like directory services, file shares, email, and applications.
In this lab, the Cloud Extender was installed on the AD server to allow users to log in with AD accounts. The Maas360 portal provided links to the Cloud Extender software download, installation, and license key generation; they were available on the SETUP menu under Enterprise Gateway, as Figure 8-2 shows. The same line also pointed to a scaling tool that can aid administrators in calculating the number of Cloud Extenders needed.
More information about the requirements and instructions on installing the Cloud Extender can be found here.
Figure 8‑2 IBM Maas360 Cloud Extender Download
8.2.3 App Catalog and Distribution
This lab build sought to demonstrate how a tool like MaaS360 could be helpful in allowing administrators to more easily distribute applications required for business operations to users. MaaS360 provides the ability to push applications to users by allowing administrators to build a customizable app catalog. An app catalog makes it easier to distribute custom apps created by the organization. Also, multiple versions of the same app can be pre-released to specific groups as a test before a full deployment.
Lastly, the app catalog allows for the remote distribution, installation, uninstallation, updating, and configuring of applications. The ability to remotely control apps is an important step in managing updates and security for an enterprise’s patch management process. In MaaS360, applications must be added to the app catalog before they can be deployed to devices. The following outlines the steps:
From the Maas360 Portal’s APPS menu, select Catalog.
The image below is a sample App Catalog page from this project’s build. To add an application, click Add.
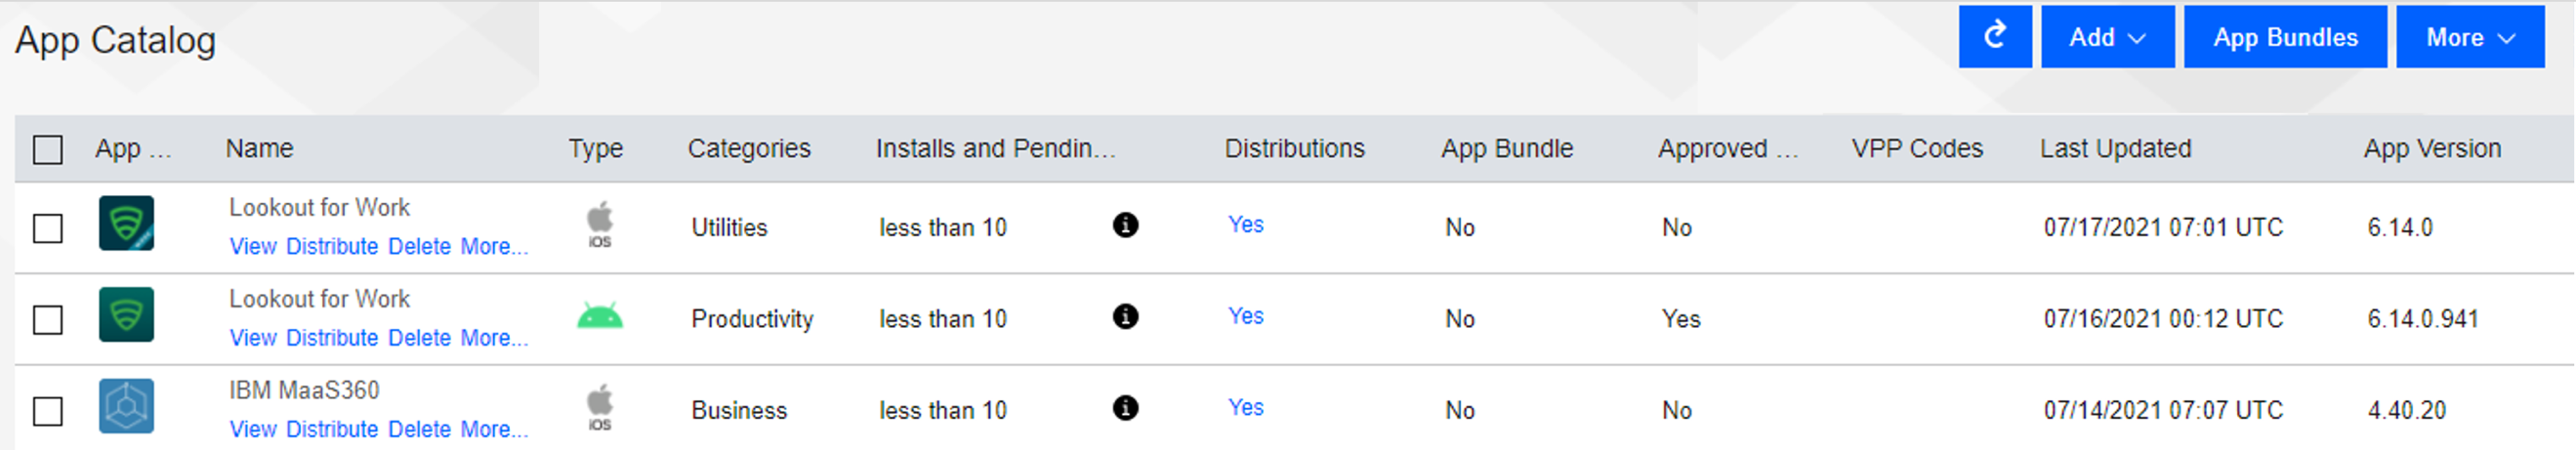
Next, select the kind of app that will be added. For this example, Windows Store App is selected.
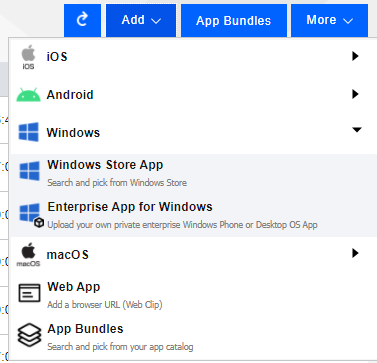
Enter the desired app in the App field (for example, Slack) and select Add to complete the process.
To distribute an app after it is added to the app catalog, select it from the App Catalog list, then click Distribute.
Additional information on the app catalog and app installation can be found here.
8.2.4 Deploying Patches
This build utilized the capability of MaaS360 to provide alerts about required patches and take action to remedy the issues. MaaS360 listed alerts on a dashboard on the Home Page, as illustrated in Figure 8-3. The first half of the page utilizes colored tiles to demonstrate items in compliance (green) and those that need attention (red). The information listed on these tiles can be customized. Below the security alert tiles, there is a My Advisor with Watson section. Watson is an artificial intelligence tool developed by IBM that scans the internet and other resources for the most recent trends in malware. It then lists any threats found that are linked to devices that are enrolled in MaaS360. Additional information about the MaaS360 Portal Home Page is listed here.
Figure 8‑3 MaaS360 Portal Home Page
MaaS360 allows administrators to apply and distribute patches to a single device or multiple devices. The patches page for Windows and macOS devices lists the patches that are missing from devices. Administrators are also able to see current patching schedules. For example, these steps were followed in the lab to use MaaS360 to schedule deployment of patches:
Select SECURITY, then click OS Patches (Windows).
Select the Windows machines to be patched, then click Distribute to apply the patches.
The options shown in Table 8-1 were utilized to schedule automated patching.
Table 8‑1 Values Specified for Scheduling Automated Patching
Distribution Setting |
Value |
Explanation |
|---|---|---|
Distribute to |
Devices Missing Patches |
Choose which device(s) to apply patching to. Select from Single Device, Device Groups, or All Devices. |
Start Date |
12/04/2021 |
This field sets the date that the remediation step will happen. This field was set to a future date so that patches would be scheduled for deployment. |
Start Time (0-23 Hrs) |
01 |
This establishes the time of day that distribution will start for selected devices. |
Distribute Over (0-24 Hrs) |
15 |
This causes patching to be staggered to reduce network load by making updates available over a set amount of time, in this case 15 hours, instead of instantaneous availability for all users. |
Action Expiry (in days) |
7 |
The action will automatically expire after seven days. |
To distribute patches out of schedule for emergency remediation needs, the following options were utilized:
Start Date: The current date was chosen
Start Time (0-23 Hrs): Immediate (causes the patch to be deployed immediately)
Distribute Over (0-24 Hrs): Immediate
Action Expiry (in days): 7
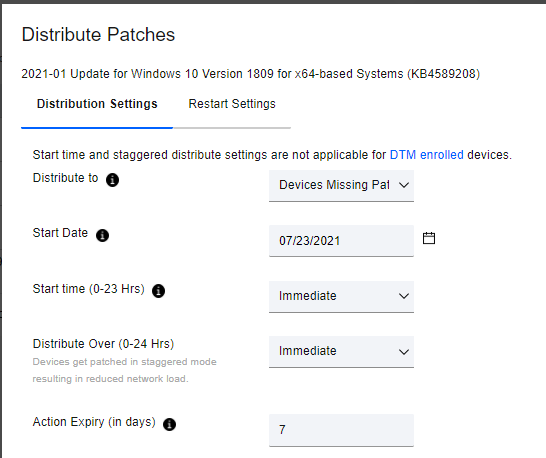
More information about patch management with IBM MaaS360 is available here.
8.2.5 MaaS360 Maintenance
MaaS360 is a SaaS offering, so updates are continuously pushed out by IBM, who maintains the platform.
8.3 IBM MaaS360 with Watson Phase 2
This section goes over phase 2 deployment of the lab instance utilizing MaaS360. The phase 2 build utilized MaaS360 to administer Google Android and Apple iOS devices.
8.3.1 Enrolling Mobile Devices
In our build we enrolled mobile devices in both a supervised state (or corporate owned) and a bring-your-own-device (BYOD) method. Corporate owned or supervised status means that organizations have full control over the device, as opposed to BYOD where organizations only have control over the work applications on the device. The following is an overview of how to enroll an iOS device in a supervised state using the Apple configurator:
Select Devices > Enrollments > Other Enrollment Options and select Apple Configurator from the drop-down menu.
Select the Non-DEP only Enrollment URL (Note: DEP stands for Device Enrollment Program), and copy the URL from the With Authentication tab.
Connect the Apple iPhone or iPad device to a MacBook and start the Apple Configurator.
Follow the wizard through specifying the MDM Server URL and certificates and assigning the device to an organization.
For more information on enrolling iOS devices in MaaS360 using Apple Configurator, review the following page.
The lab instance enrolled Android devices manually using a QR code during device setup. The following steps provide an overview for how to do this:
Click Devices > Enrollments > Other Enrollment Options > Android Enterprise QR Code Provisioning.
Enter the requested information into the form that appears. Of note is the Android Enterprise Mode options for Android Enterprise mode. The Device Owner option allows an organization to have complete control over the device, while Work Profile on Corporate Owned allows organizations to only manage apps under the work profile of the device.
During initial setup of the mobile device, tap the screen six times and then scan the QR code displayed in the MaaS360 portal.
For more information on enrolling devices using a QR code, follow the information on this page.
While the lab instance utilized manual processes to enroll devices, MaaS360 also supports bulk enrollment of Apple and Google devices. For information, consult the following links:
8.3.2 Device Inventory
The Devices > Inventory tab lists all the devices that have been enrolled into MaaS360. The patching instance utilized this tab to perform firmware and software discovery capabilities.
The firmware of enrolled devices is displayed directly on the device inventory list. The Operating System field shows the detected OS on the device. Figure 8-4 shows the connected devices in the patching instance with the OSes that were detected.
Figure 8‑4 Example of Enrolled Device Inventory
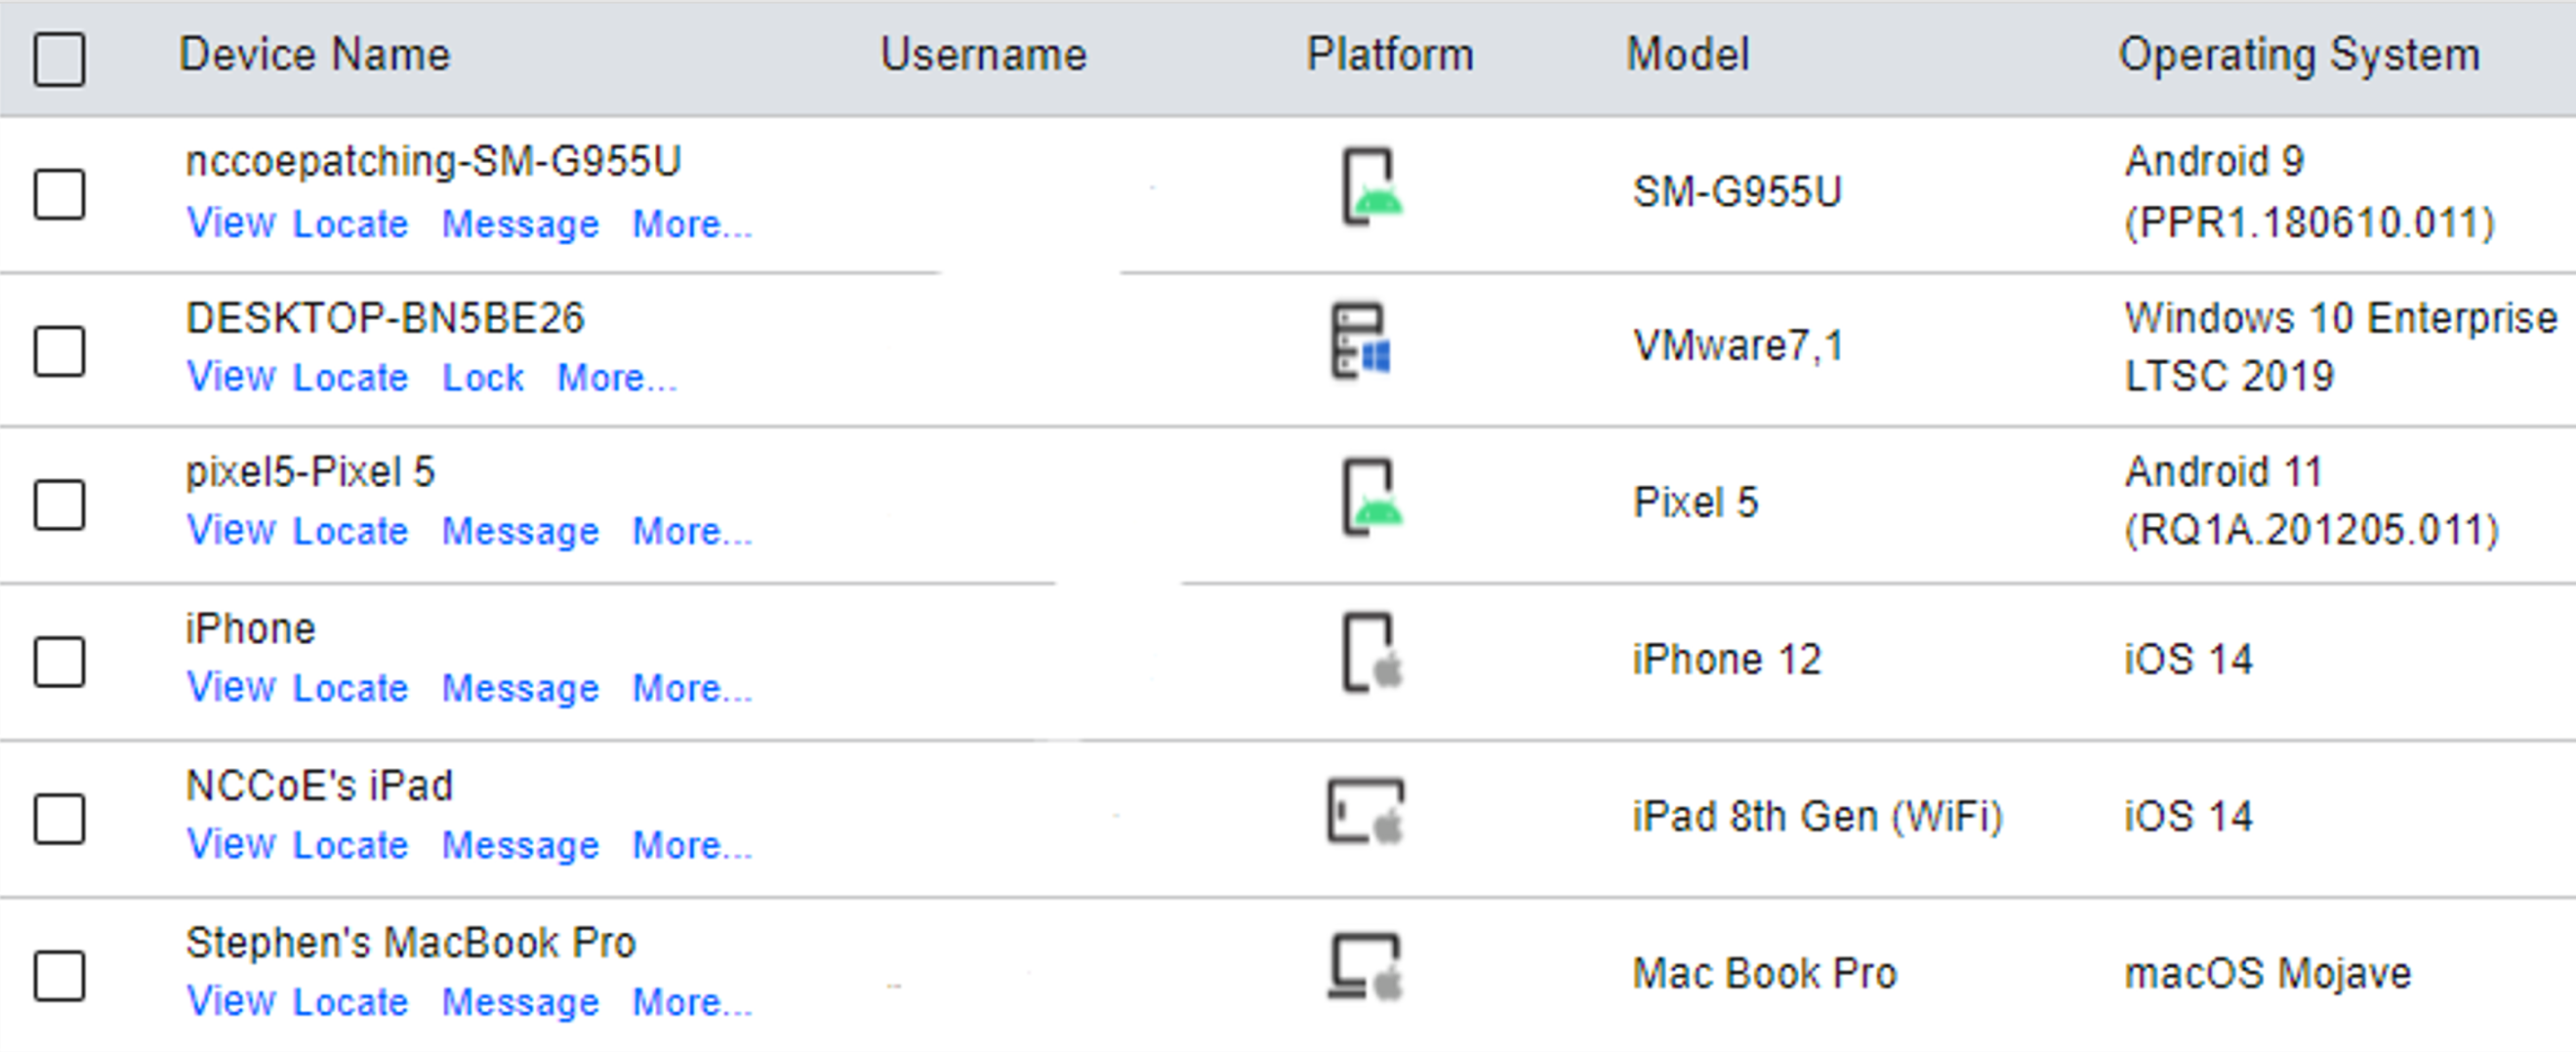
More detailed information regarding the installed OS and hardware information can be found under View > Device Summary > Hardware & OS.
The installed applications on enrolled devices can be found by going to Device Inventory > View > Apps Installed. The Apps Installed list shows all installed applications on a device. Figure 8-5 gives an example of installed applications on a device. The list allows user-installed applications to be uninstalled by administrators.
Figure 8‑5 Example of Installed Apps on a Mobile Device
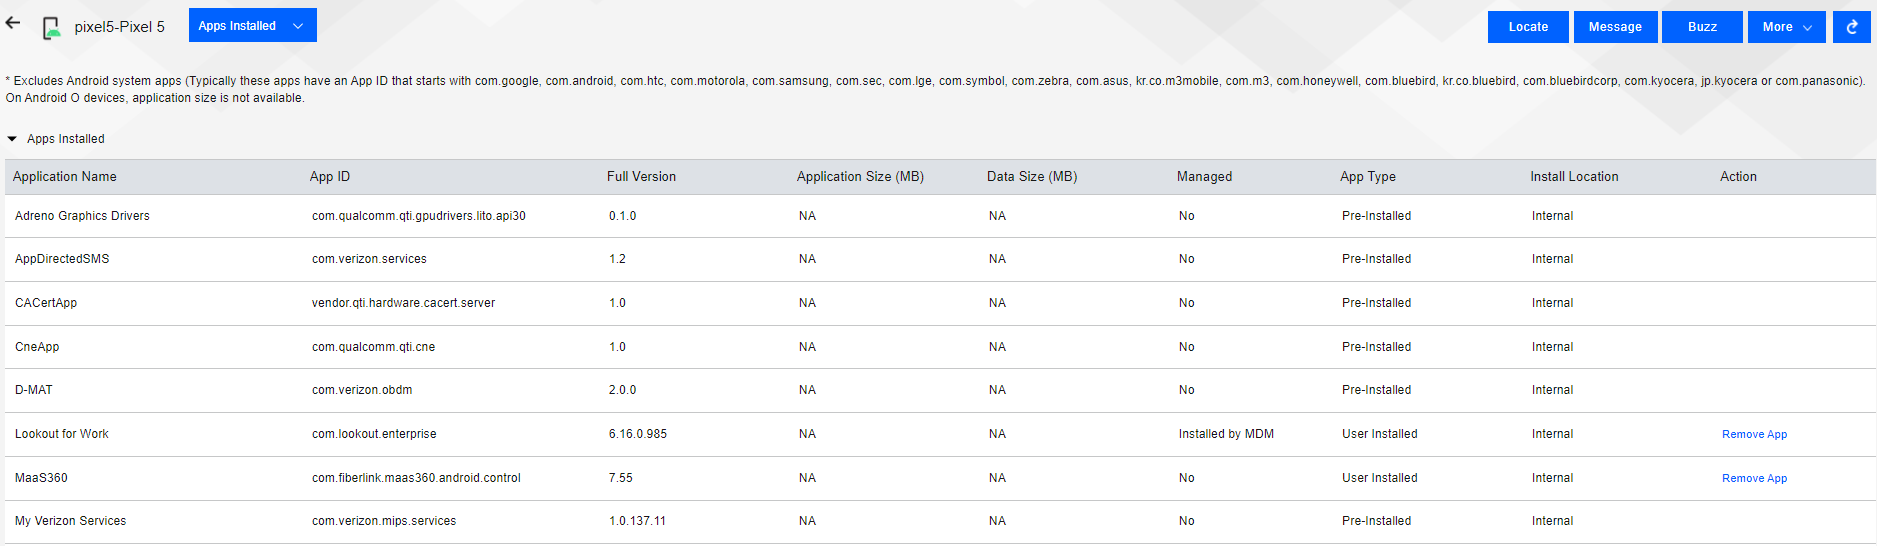
For more information regarding the device inventory page, please consult the following page.
8.3.3 Device Policies
The Security > Policies section of MaaS360 allows security policies and settings to be applied to devices to make sure they comply with organizational policies. The lab instance utilized policies to ensure that the Android devices had the MaaS360 and Lookout for Work applications, as well as to perform automatic OS updates. Policies for Apple were configured to require the MaaS360 and Lookout for Work applications.
To configure the Android Default Policy to support required apps and automatic updates, perform the following steps:
Click Security > Policies.
Under Default Android MDM Policy, click View.
Under the Android Enterprise Settings field, click App Compliance.
Click the Edit button.
Select Configure Required Apps.
Under Application Name, type the following:
app:com.fiberlink.maas360.android.controlapp:com.lookout.enterpriseClick on Android Enterprise Settings > System Update Settings.
Click the check box for Configure System Update Settings and fill out the information as shown in the screenshot below.
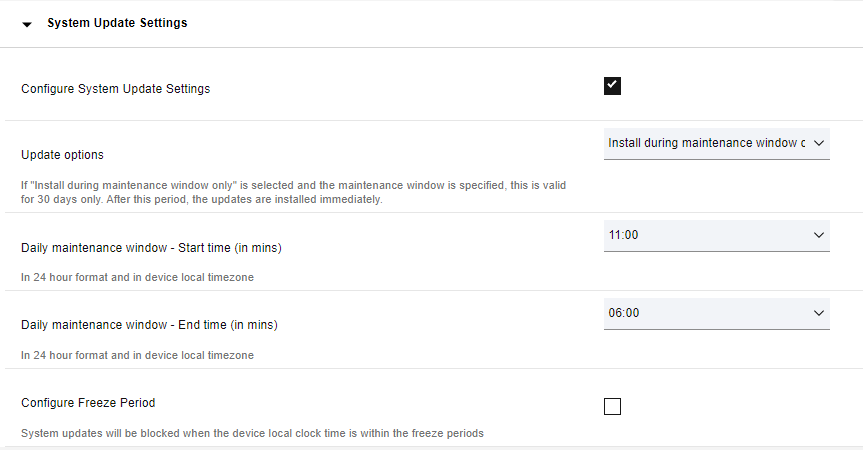
To configure a default Apple policy to require the installation of MaaS360 and Lookout for Work, perform the following steps:
Click Security > Policies.
Click the Default iOS MDM Policy.
Under Device Settings, click Application Compliance.
Click Edit and check the Configured Required Applications check box.
Under the application names, add Lookout for Work and IBM MaaS360. Note that typing in the Application Name field will cause MaaS360 to search for the application. Click the application when it appears in the search field.
Click the Save And Publish button.
8.3.4 Alerts
MaaS360 can alert via the My Alert Center dashboard on the home page. The My Alert Center dashboard can have custom alerts added. The lab instance used this capability to alert administrators when mobile devices might be running older firmware versions. For more information on building the alert center, see the following page.
The following steps walk through creating an alert to show out-of-date Apple devices:
Click the Home tab of MaaS360.
Under the My Alert Center, click the plus (+) icon.
Fill out the Search Criteria as shown below. This rule creates a search that looks for devices that are currently active and fall under the category of smartphones and tablets. To make sure that we only look at Apple devices, the first condition has been set to match devices that have been manufactured by Apple. The second condition sets the OS version to be no less than 14.8.
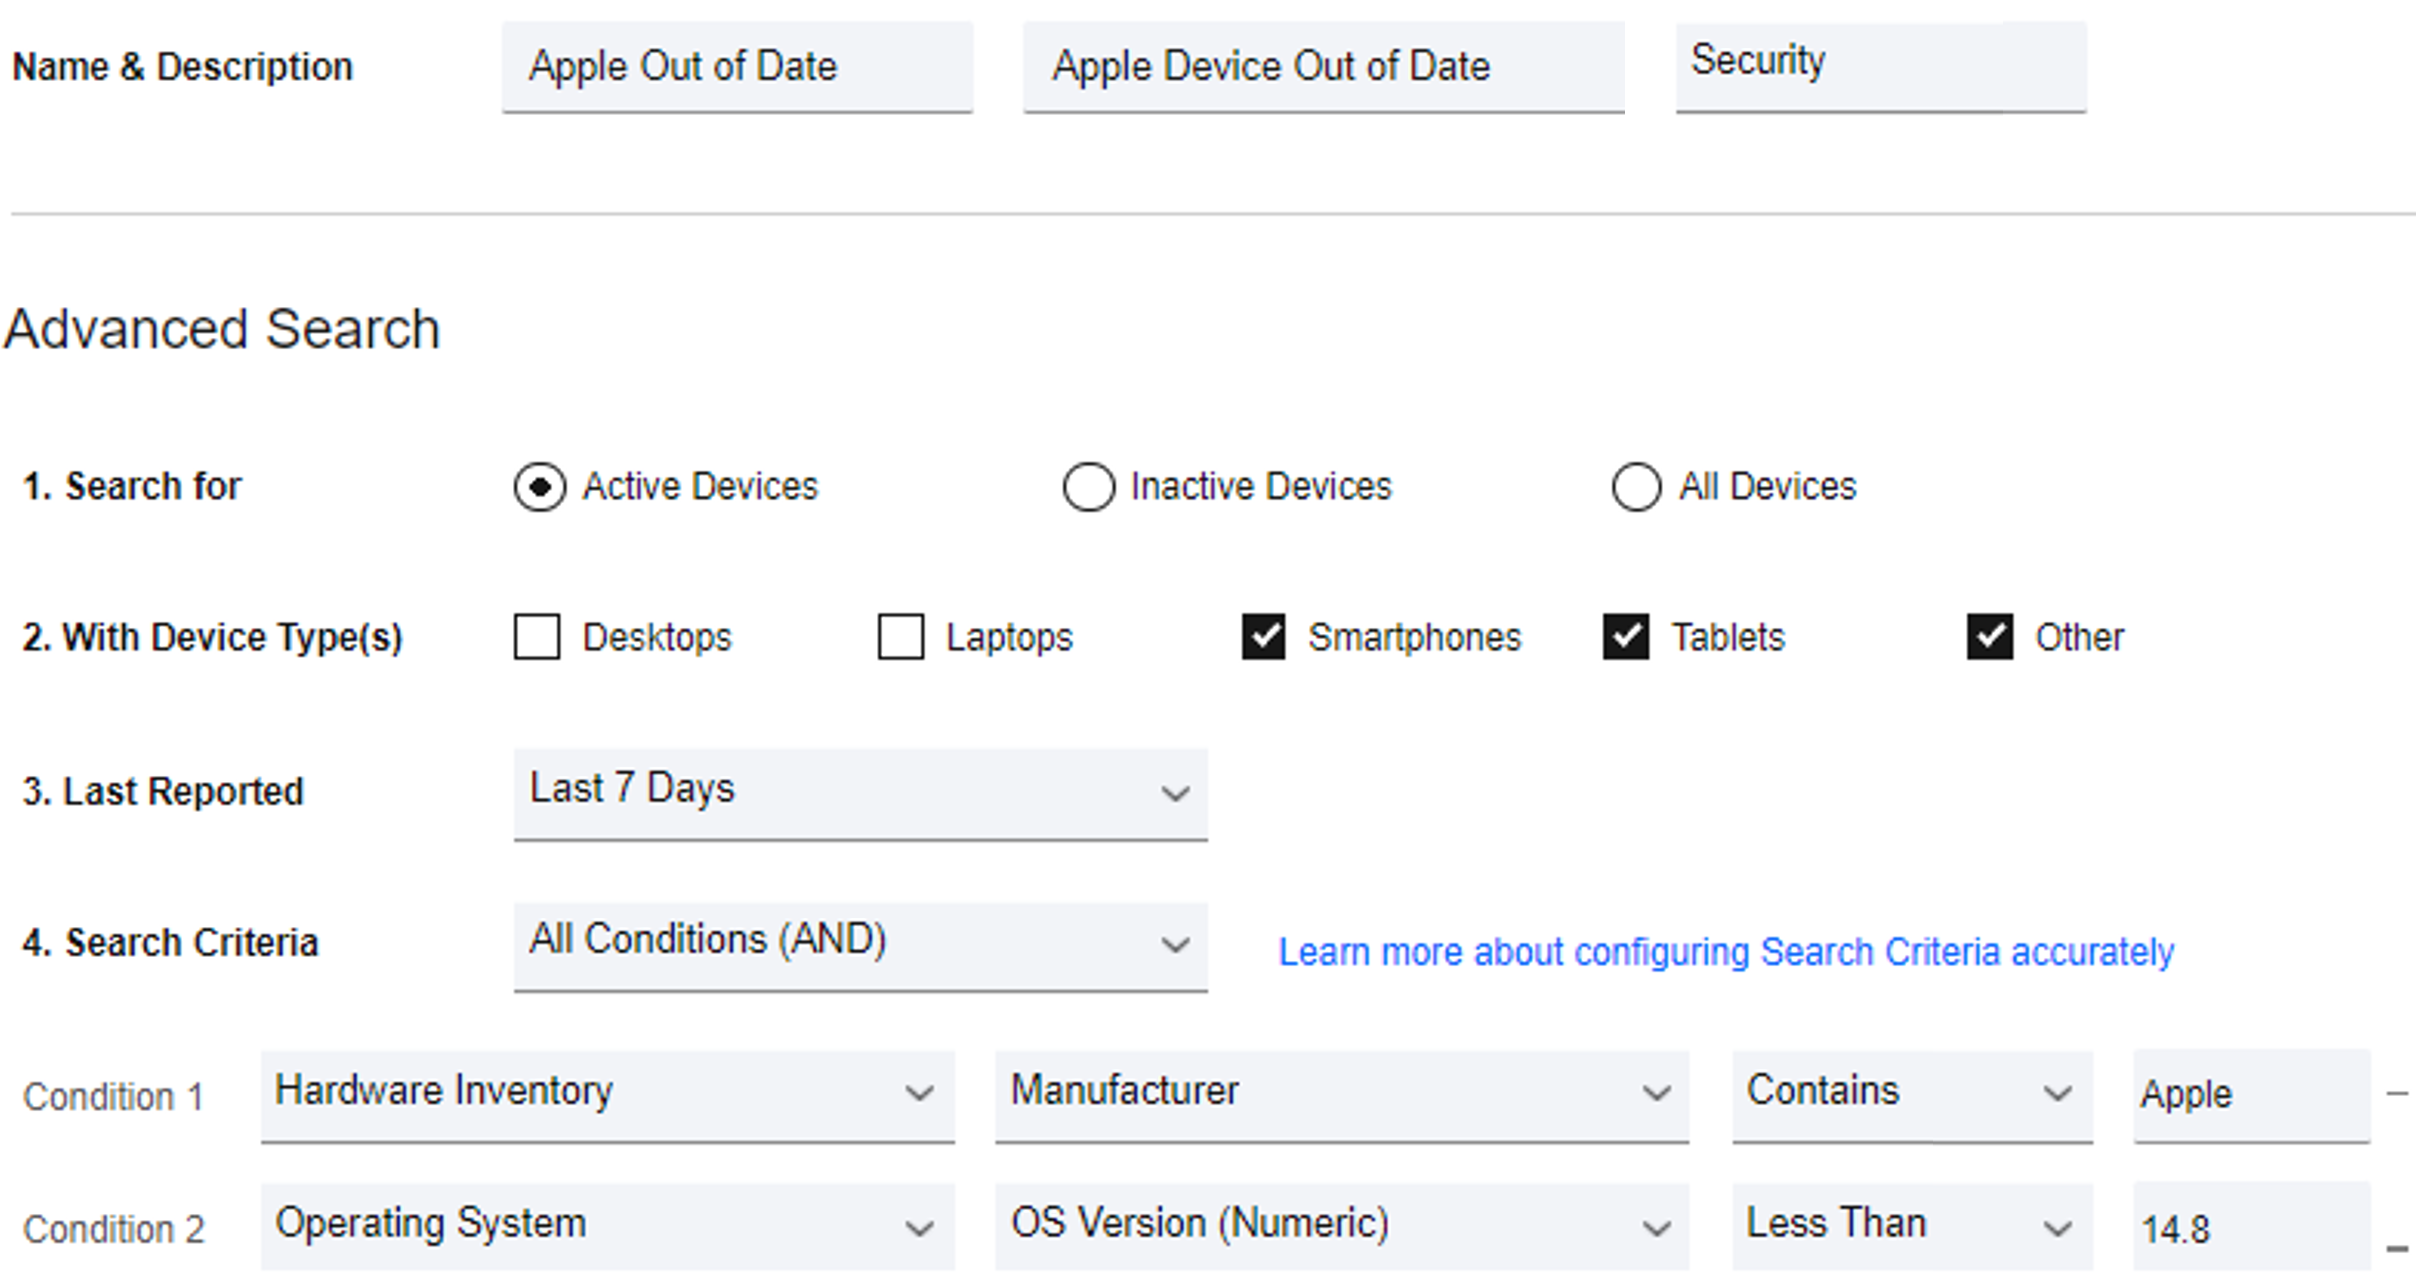
Click Save.
The My Alert Center will update with the results of the search, as shown below.
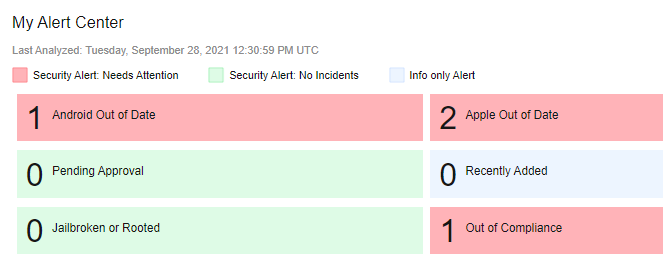
8.3.5 Firmware Updates
The MaaS360 tool can push out firmware updates to devices that are corporate owned or enrolled as supervised devices. The lab instance utilized this feature to push firmware updates to devices to meet the firmware patching scenario.
Android device patching was covered in Section 8.3.3. The policy that was previously configured will have Android devices automatically install software updates during a defined maintenance window. Administrators can set the policy to automatically install updates as soon as they are available instead of waiting for a maintenance window. This can be used to provide immediate patching in the case of emergencies. Please consult the following page for more information on configuring policy for Android system updates.
Apple iOS devices do not have a way for policy to be configured to automatically push out system updates. However, administrators can still push out iOS updates to supervised devices through a manual process. To push out an Apple iOS update to a group of devices, perform the following steps:
From the MaaS360 Portal click Devices > Groups.
Under the Groups list, find iOS devices. Note that other device groups are automatically available, such as iPhones or iPads, if an administrator does not want to push out the update to all iOS devices.
Under the More button, select Push iOS Update.
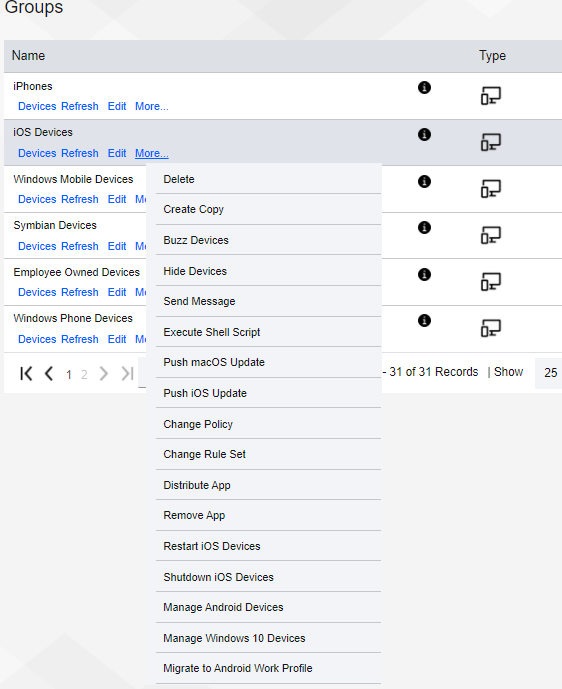
The Push iOS Update window will appear. Select Download and Install, then click the Continue button.
8.4 IBM MaaS360 with Watson Reporting
IBM MaaS360 has the capability to create a variety of reports that may help administrators gain better insight of the enterprise’s mobile environment. Reports are available for hardware inventory, network, app inventory, mobile data usage, user endpoint management overview, and app security settings. Administrators can also customize reports and opt to have reports delivered on a daily, weekly, or monthly basis. Reports are refreshed every 24 hours, and they are available for data that is up to 180 days old. There are also filters available that may be helpful with managing the report data.
Reports can be accessed by selecting REPORTS from the MaaS360 Portal, then choosing the type of report that is needed. For example, the sample report from the lab shown in Figure 8-6 broke down devices by platform to provide an asset inventory.
Figure 8‑6 Sample Report from MaaS360
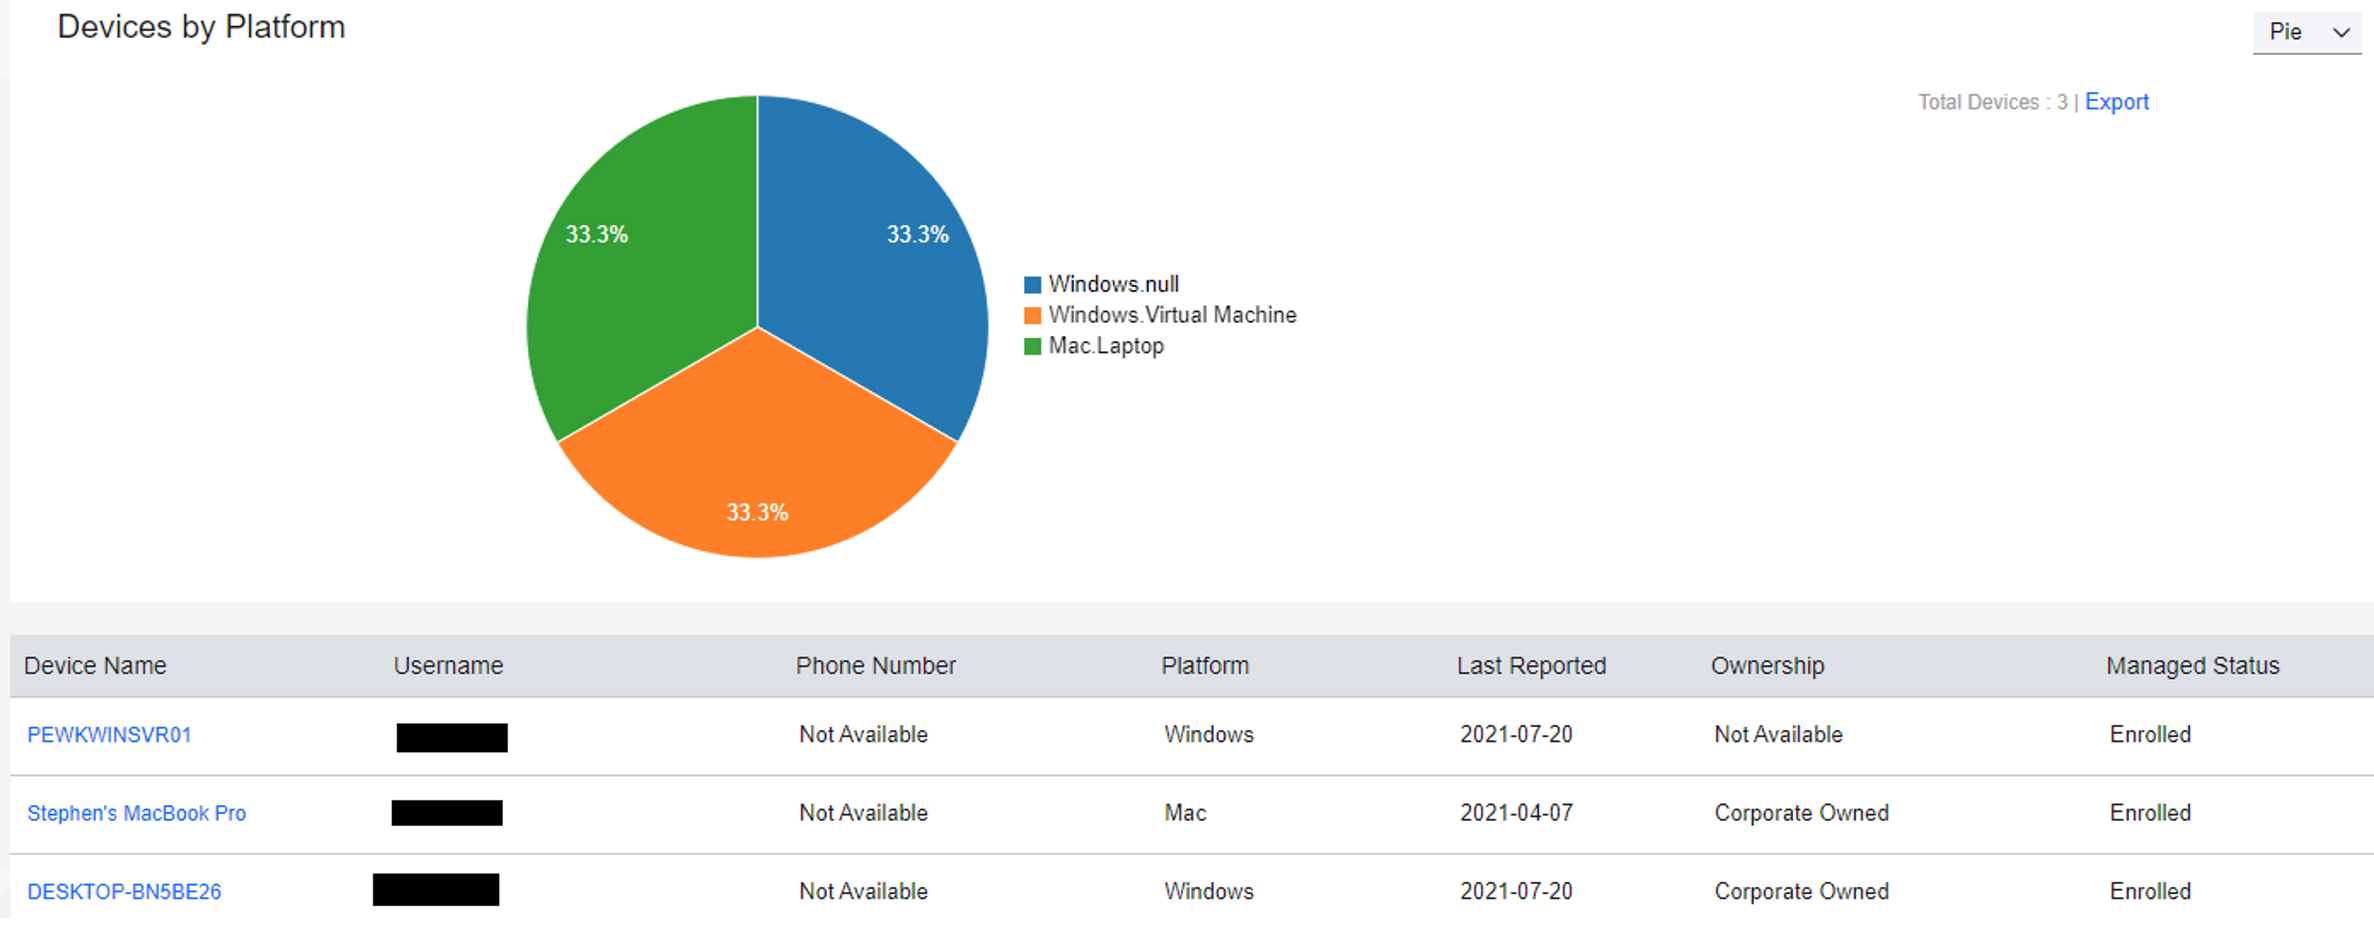
Figure 8-7 demonstrates the administrator’s ability to create reports based on the Security State, Vulnerability, Mailbox Approval State, MDM Policy, ActiveSync Policy, and Details Report.
Figure 8‑7 IBM Maas360 Report Options

Additional instructions concerning managing reports in MaaS360 are available here.
9 Lookout
Lookout Mobile Endpoint Security (MES) is a SaaS-based mobile threat defense solution that collects information from devices via the Lookout for Work mobile application. In our build, it provided vulnerability scanning, assessment, and reporting for Android and Apple mobile devices. We also integrated Lookout MES with IBM MaaS360 to provide security policy enforcement actions.
9.1 Integrating Lookout with IBM MaaS360
Lookout MES device enrollment can be accomplished without third-party integration. However, to enforce installation, the Lookout for Work client must be managed and pushed via an MDM to mobile devices. In our build, the MDM was IBM MaaS360 with Watson. Detailed information regarding integrating Lookout and MaaS360 can be found here. Please note that you will need an account to view the documentation. The following steps provide a high-level overview of integrating Lookout MES with MaaS360:
Create an API user in MaaS360: This step creates a user in MaaS360 with the correct permissions that can then be used for Lookout MES to access the MaaS360 API.
Create custom attributes in MaaS360: Lookout MES passes device state information back to MaaS360. Custom attributes will need to be set up in MaaS360 so that the information passed by Lookout can be stored by MaaS360 and used in policy enforcement. The following attributes are created:
lookout_activation_state: This specifies whether the Lookout for Work app is installed and activated on the device.
lookout_device_state: This indicates the overall state of the device, such as secured, threats detected, deactivated, or pending activation.
lookout_disconnected: This indicates if there is a connection from the mobile device to Lookout.
lookout_threat_level: This categorizes the threat level of the device by none, low, medium, or high.
lookout_unreachable: This indicates if the Lookout MES server is reachable by the mobile device.
Add the Lookout for Work app to the MaaS360 App Catalog.
Configure the MaaS360 connector from the Lookout Console.
9.2 Adding Lookout for Work to the MaaS360 App Catalog
Adding the Lookout for Work iOS and Android applications to the MaaS360 App makes the application available in the IBM MaaS360 app store. For supervised or corporate-owned devices, the application will install automatically without further user interaction. More information for adding the Lookout for Work App to MaaS360 can be found here.
The following steps provide an overview of the process of adding Lookout to MaaS360:
From the MaaS360 Portal, select APPS and then click Catalog.
Click Add and choose the OS required (iOS is chosen for this example).
Next, select iTunes App Store App. Then enter Lookout Mobile Security in the search bar and click Add.
Add the Lookout for Work configuration details so that when users open the application, it will be automatically configured and connect to Lookout without further interaction.
9.3 Configuring MaaS360 Connector in the Lookout MES Console
To integrate Lookout MES with IBM MaaS360, perform the following steps:
Select Integrations in the Lookout MES console.
Enter the Label for the connection, MaaS360 URL, the API username and password, Access Key, Apple ID, and Billing ID. An example is shown below.
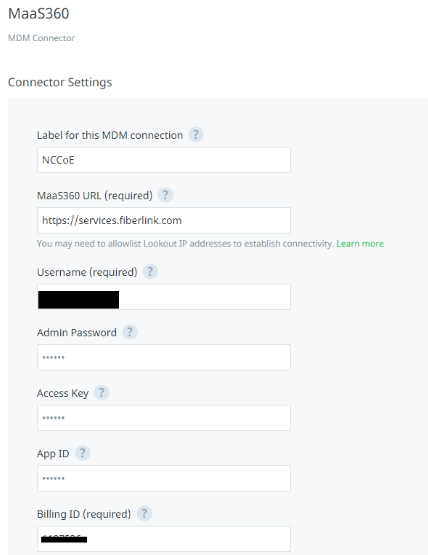
After a successful integration, the Integration page should display the following:
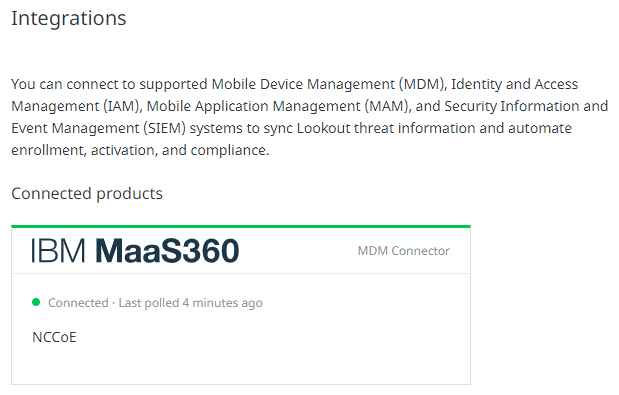
9.4 Firmware Discovery and Assessment
Once Lookout for Work is activated, it collects details about devices that include the device’s OS version and the patch level for Android devices, and then lists all CVEs associated with the device based on the OS version and Android Security Patch Level (ASPL). The Lookout MES platform can discover firmware (the OS running), and it displays this information under the Devices tab.
Once the Devices tab is chosen, a list of all connected devices are displayed in the window. Select a device from the list to discover its firmware. Then information about the device’s firmware, including OS and Security Patch level, can be found by scrolling down to the software section. An example of this information is displayed in Figure 9-1.
Figure 9‑1 Example of Device Firmware Information
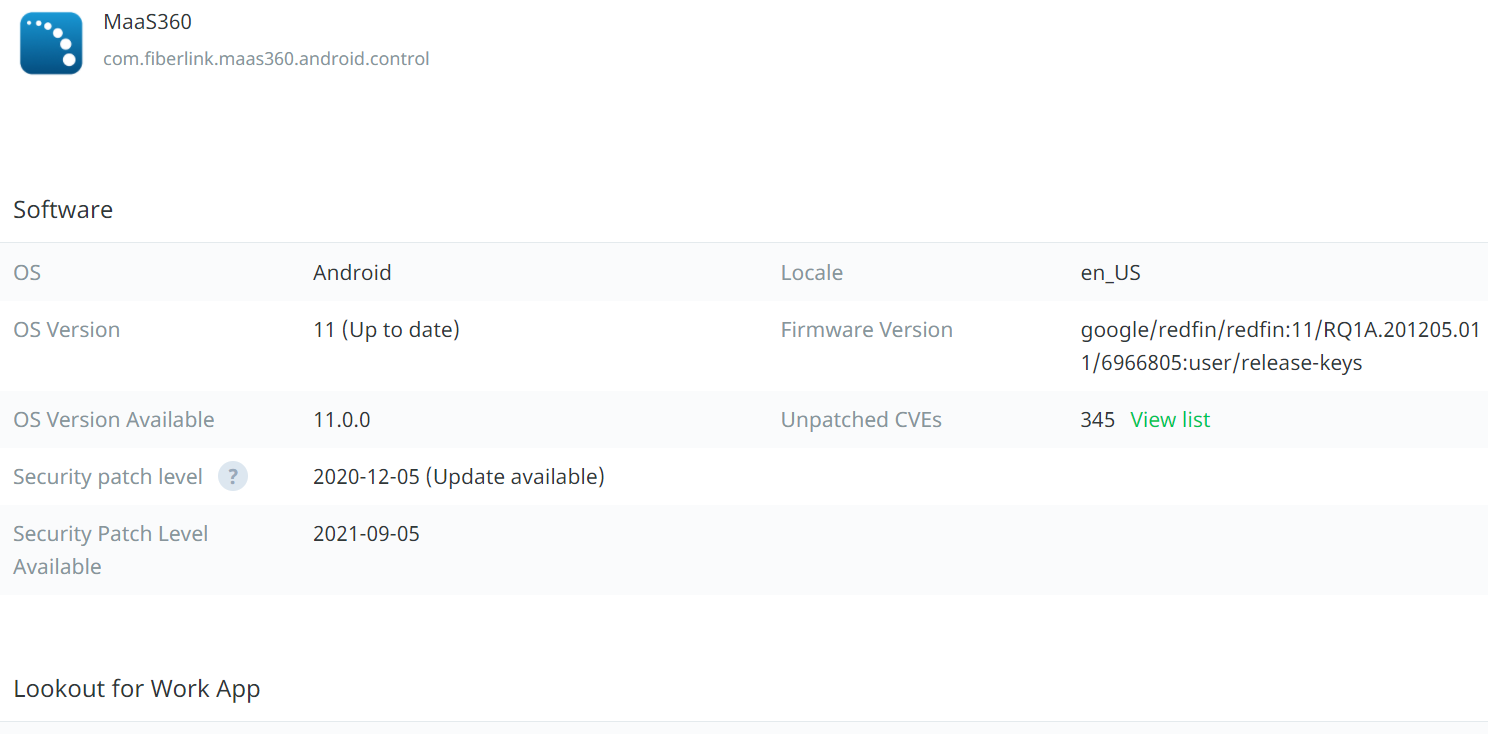
By clicking the View List button from the Unpatched CVEs section, administrators can see all CVEs that are associated with the current OS and ASPL on the device. The Vulnerability Summary tab breaks down the vulnerabilities associated with a device by severity. An example of this information is displayed in Figure 9-2.
Figure 9‑2 Example of Vulnerability Severity Information
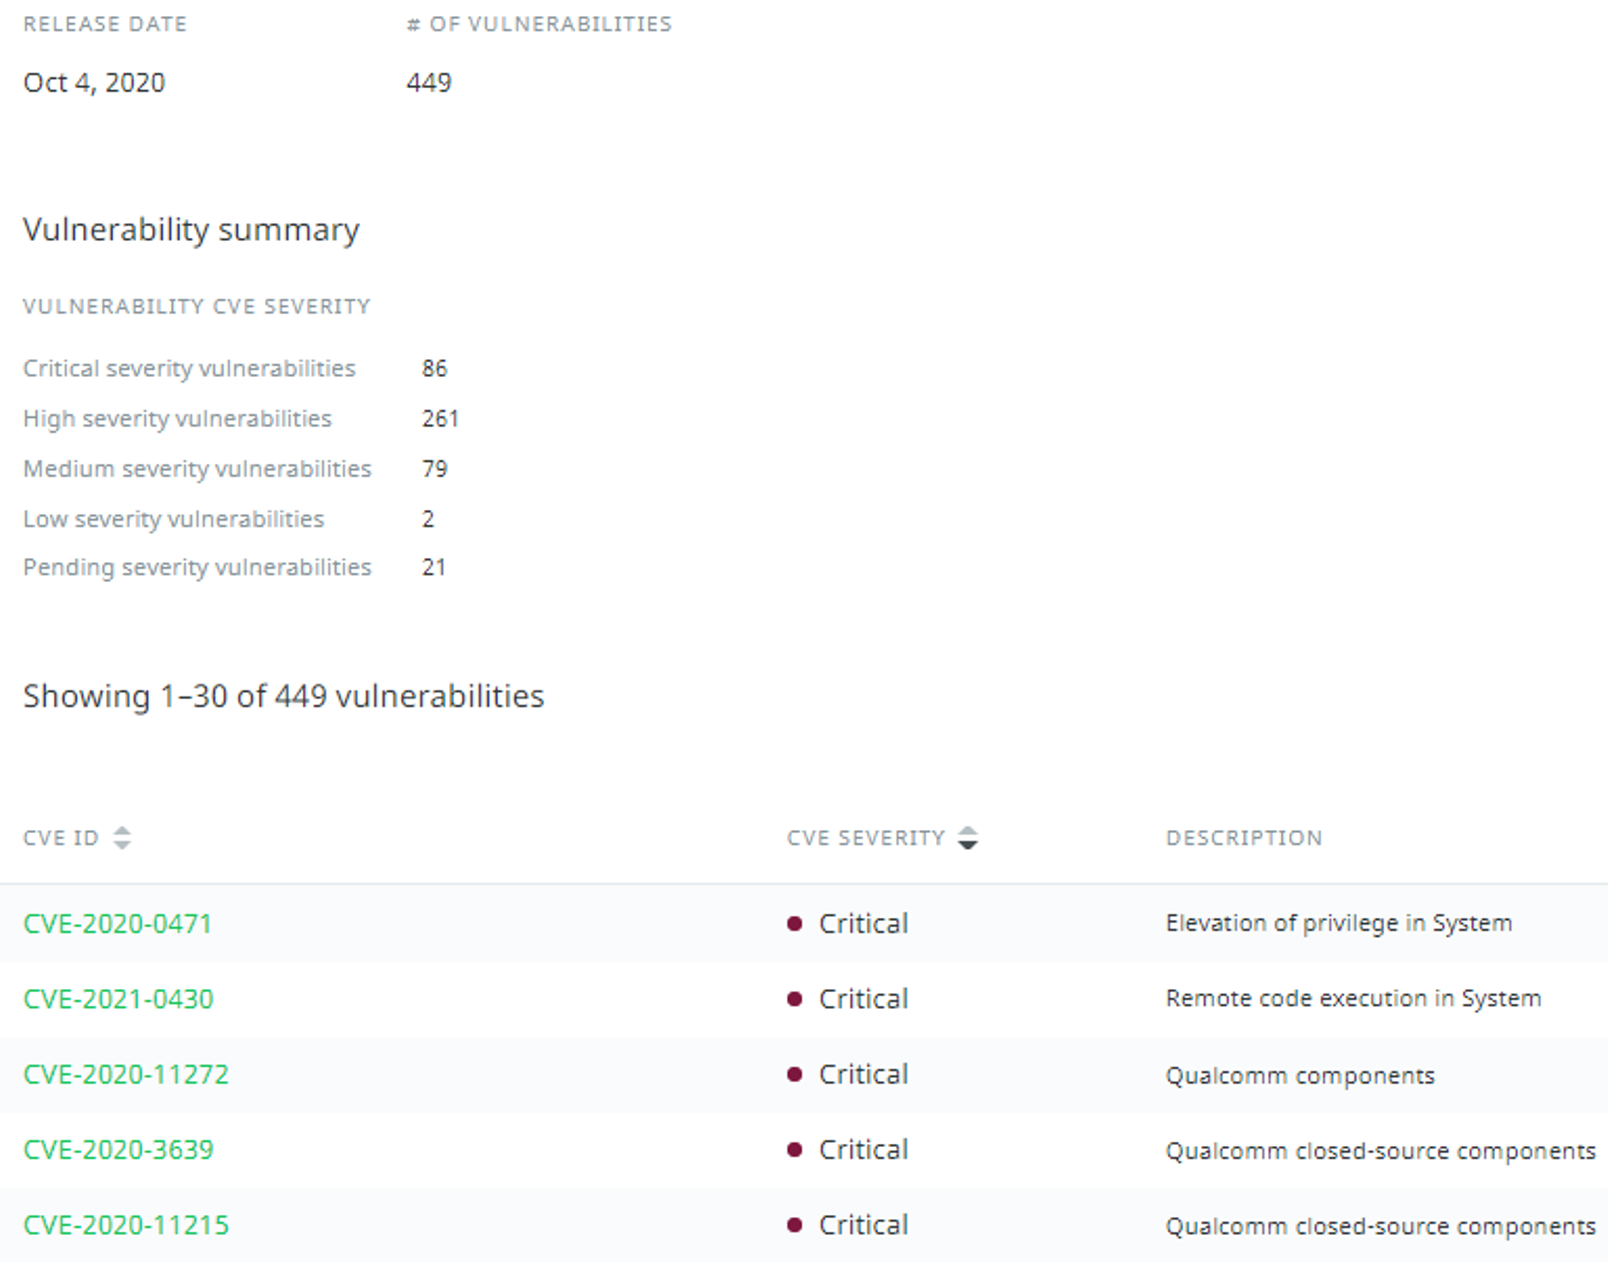
9.5 Software Discovery and Assessment
Activation of the Lookout for Work client allows for the collection of running applications on the device. For Android devices, Lookout collects an app inventory for the device which includes details about app versions plus libraries and software development toolkits (SDKs) used by the apps. For iOS devices, this information is obtained using the MaaS360 API. Lookout MES can also indicate if there are vulnerabilities in the applications themselves.
The Lookout MES platform displays a risk grade which shows the risk that the app presents if it was compromised. Lookout calculates this grade based on the application’s permission (what information it can access). Each risk grade is on an A to F scale (A, B, C, D, or F). Lookout MES does not link applications to specific devices unless a device fails a compliance check because of an installed application. For example, if there is a rule that prohibits the installation of TikTok, only devices with TikTok installed will be highlighted.
To view the applications that are installed on devices, select Apps from the Lookout MES dashboard. Figure 9-3 shows a sample of the Apps page from our build.
Figure 9‑3 Lookout Apps Page Sample
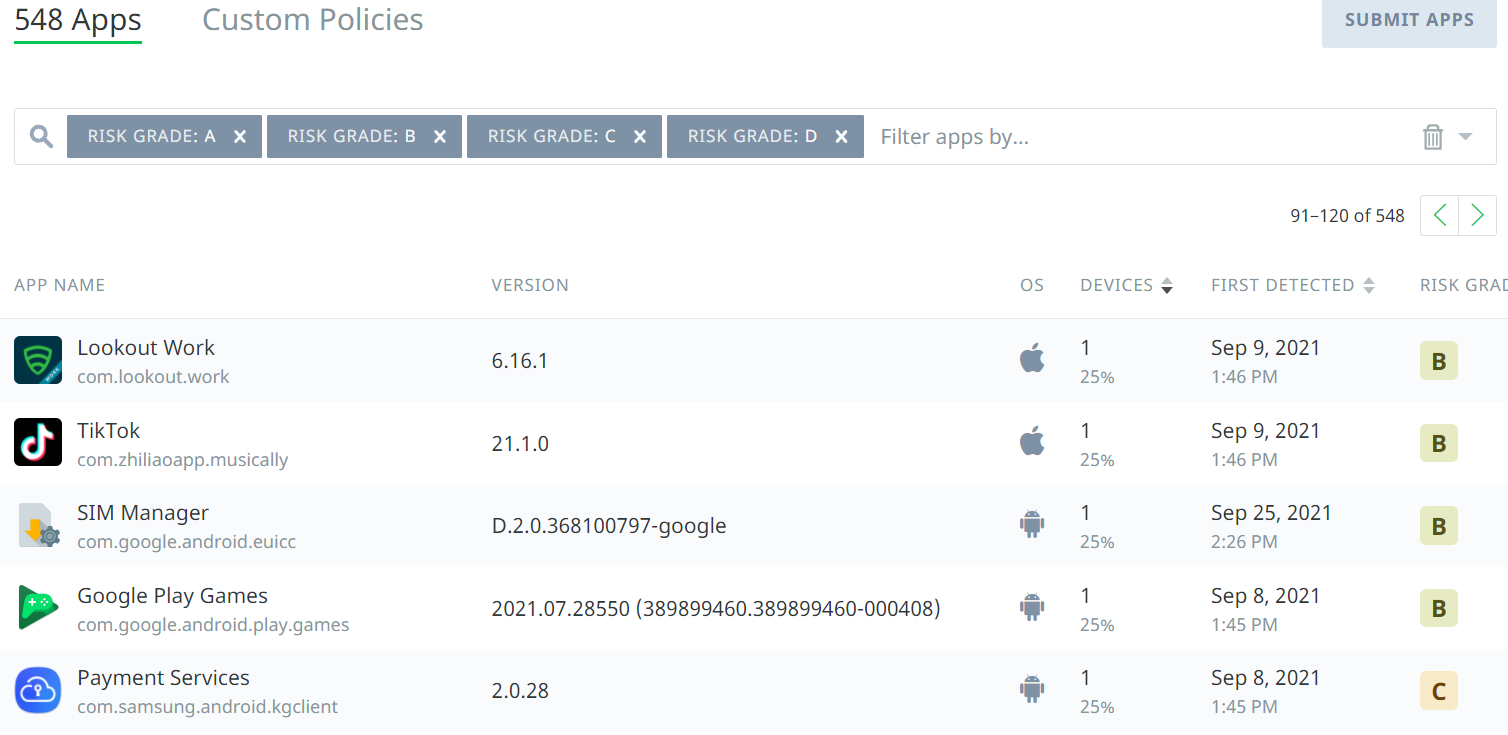
9.6 Lookout MES Security Protections
Lookout MES allows organizations to set protection parameters for enrolled devices. Lookout comes preconfigured with multiple templated rules that can be configured to meet organizational risk tolerance. Policy enforcement can be accomplished through MES directly or via integration with an MDM.
Our build utilized this feature to implement a rule to restrict network access to devices that had an out-of-date firmware level. The lab configured this rule by defining a minimum OS version and Android security patch level and by choosing to alert the device’s user and block access to certain domains if the minimum is not met.
To configure such a rule, perform the following steps:
Click the Protection tab.
Scroll down to OS Out-of-date and select a risk level of High under the Risk Level drop-down.
Click the gear icon by the Risk Level drop-down menu.
Select the minimum compliant iOS and Android OS versions from the drop-down, as shown below, then click Save changes.
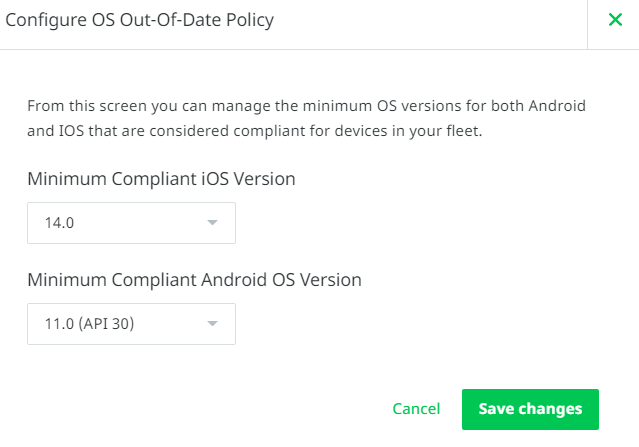
From the Protections tab, click On-Device Threat Protection, and set Enable On-Device Threat Protection to ON.
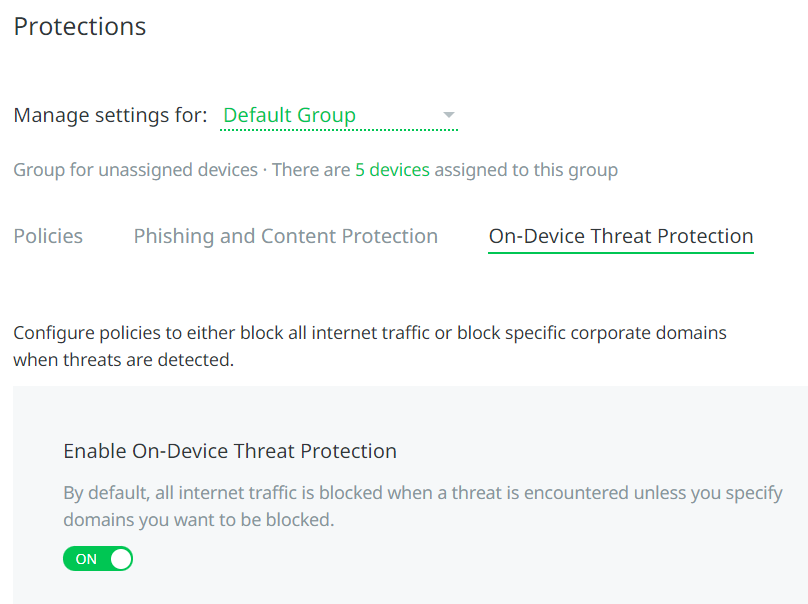
Under the Response drop-down, choose Block domains and alert devices.
Scroll down to Block specific domains and click a domain to add.
Specify a domain that non-compliant devices should not access. Note that domains can be added by CSV files.
Click Save changes.
9.7 Security Compliance Enforcement with IBM MaaS360
Lookout MES can pass custom attributes to MaaS360 for use in custom security compliance rules. This integration was set up in Section 9.1. Our build utilized this capability to block access to corporate resources for any device with a threat level of high by Lookout MES. Information on applying security compliance rules for devices can be found here.
The following steps show how to create a security compliance rule using Lookout custom attributes:
Under the MaaS360 console click Security > Compliance Rules.
Click Add Rule Set.
Under the Rule Set Name Field, type in Lookout Custom Attributes and then click Continue.
Under the Basic Settings, ensure that the iOS and Android fields are checked.
Click on Custom Attribute Rules and fill out the following fields:
Rule Name: Lookout Threat High
Select Attribute: lookout_threat_level (this corresponds to the threat level that Lookout assigns to a device, which was configured in Section 9.6)
Select Criteria: Equal To
Choose Value: High
Under Enforcement Action, click to Alert and then Block as shown below.
Click Save.